The main tag of Gold Price Articles.
You can use the search box below to find what you need.
[wd_asp id=1]
The main tag of Gold Price Articles.
You can use the search box below to find what you need.
[wd_asp id=1]
Risk aversion keeps fueling Gold demand, with the bright metal flirting with record highs on Wednesday. XAU/USD peaked at $2,685.25 on Wednesday despite broad US Dollar (USD) strength against other major currencies. The latter has gained extra strength after Wall Street’s opening, resulting in XAU/USD pulling back from the mentioned high yet still holding to modest intraday gains.
A dismal market mood prevailed throughout the first half of the day, with Asian and European indexes edging lower, following softer-than-anticipated earning reports in the Old Continent. Wall Street, however, managed to revert the sentiment, as the three major indexes stand in the green.
Speculative interest keeps looking at Middle East developments and China for guidance, given the absence of first-tier macroeconomic figures this week, yet headlines are also scarce on those fronts. On the one hand, the missile barrage between Israel and Iran continues, with fears the attacks will reach nuclear or oil plants. On the other hand, the Chinese government has bluffed about stimulus measures to revive the economy but failed to provide enough details on the matter.
If something, the European Central Bank (ECB) may trigger some action on Thursday, as the central bank will announce its decision on monetary policy. The ECB is widely anticipated to deliver a third consecutive interest rate cut. The Main Refinancing Operations Rate and the Rate on Deposit Facility are foreseen down by 25 basis points (bps) each amid struggling economic progress.
From a technical point of view, the XAU/USD pair is poised to extend its advance and challenge the $2,700 mark. In the daily chart, the pair is up for a second consecutive day, with a bullish 20 Simple Moving Average (SMA) providing dynamic support at around $2,644.10. In the same chart, the longer moving averages also maintain their bullish slopes far below the shorter one, reflecting the long-term positive stance. Finally, the Momentum indicator turned flat around its 100 line, while the Relative Strength Index (RSI) indicator keeps grinding higher, currently at around 64, in line with bulls’ dominance.
In the near term, and according to the 4-hour chart, the risk skews to the upside. A bullish 20 SMA runs above its 100 SMA, while the 200 SMA grinds higher below the shorter ones, usually understood as growing momentum. At the same time, technical indicators have resumed their advances within positive levels after a modest corrective decline.
Support levels: 2,668.80 2,655.65 2,644.10
Resistance levels: 2,685.45 2,700.00 2,715.00
What is not known is how cold it gets and how much demand there will be in the short term. And that’s why this is such a volatile contract because it’s focused on the short term more than anything else. It’s also influenced by the futures markets, which is actually where natural gas is traded, not the CFD markets. So, you are currently trading the forward month, which is going to be focusing on colder weather than we have right now, which is why the price has elevated.
This lasts for a while, and then sometime in the middle of winter, they start pricing in spring, which means less demand and the market rolls over. Yet again, this is a cyclical trade, nothing more, nothing less. At this point in time, if we do pull back, there’s probably value to be had, but it’s not something you go all in on.
For a look at all of today’s economic events, check out our economic calendar.
By Mahmoud Abdallah
Reviewer Adam Lemon
Fact-checker DailyForex.com Team
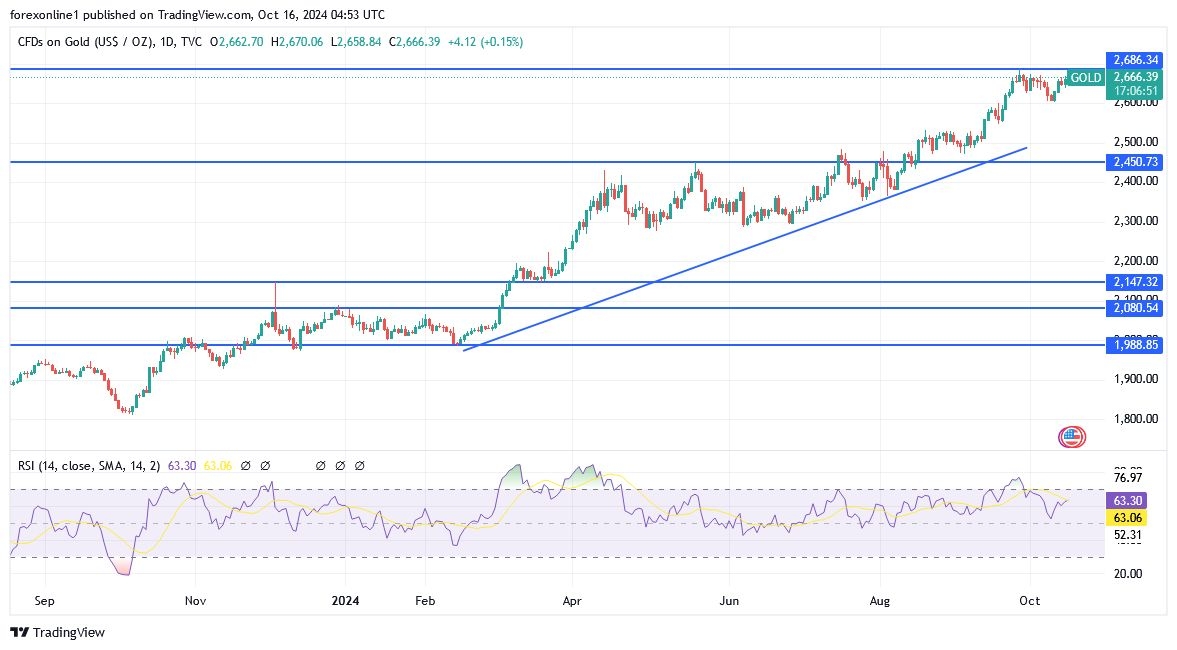
According to gold trading companies’ platforms, gold prices on the Comex exchange have been hovering around $2,600 per ounce during the past few sessions, with the upward movement pausing.

Gold prices have been struggling to surpass their September peak, when prices rose to $2,696.90 per ounce. Recently, the US dollar has risen sharply over the past few sessions as investors expect the US Federal Reserve to not cut interest rates by a larger amount like its previous meeting. In the United States, rising inflation and a resilient Labor market have reduced bets on further cuts in interest rates by the Federal Reserve.
Now, investors expect the Fed to cut US interest rates by 25 basis points at its November meeting. In September, the US central bank cut rates by 50 basis points, surprising financial and commodity markets. The US dollar extended its gains the previous week, hitting its highest level in more than two months, after Federal Reserve Governor Christopher Waller urged “more caution” about future rate cuts, citing recent economic data. Waller added: “Whatever happens in the near term, my baseline continues to call for gradual rate cuts over the next year.”
Also, gold bulls are facing some pressure from easing tensions in the Middle East as the world awaits Israel’s response to Iran after the latter attacked Tel Aviv on October 1st. As a result, gold prices are likely to face some headwinds after the Washington Post reported that Israeli Prime Minister Benjamin Netanyahu told the United States that Israel would target the Iranian military, not nuclear or oil facilities. Furthermore, the report indicates that there will be a more limited counterstrike aimed at preventing a wider war. However, there has been no escalation so far since Iran launched ballistic missiles towards Israel on October 1st. Ultimately, this has somewhat eased tensions in the region.
According to gold analysts today, gold prices enjoy support above the 21-day simple moving average (SMA) at $2,635 per ounce for the rest of this week. The 14-day Relative Strength Index (RSI) is flat, indicating that any decline in prices may be a good buying opportunity for traders.
If gold prices rebound from their current slumber, the next target could be around $2,700 per ounce. Conversely, immediate support is seen at the 21-day simple moving average at $2,632, which will test the three-week low near the $2600 threshold below. Overall, a sustained break below the latter could extend to the downside towards the September 20 low of $2585 per ounce.
Ready to trade today’s Gold Analysis? Here are the best brokers for Gold Trading to choose from.
Gold price is building on the previous recovery early Wednesday, challenging the static resistance level at $2,670. Gold buyers stay optimistic amid a bullish technical setup on the daily time frame and broad risk aversion.
Skepticism surrounding the Chinese fiscal stimulus grows, as investors remain expectant of details on the plans announced by China’s Finance Minister last Saturday. This coupled with a sharp slowdown in China’s exports amplifies the economic concerns, intensifying risk-off flows across the financial markets in Asia so far this Wednesday.
Risk aversion extended into Asia, following a steep sell-off in the European and Wall Street stocks after disappointing earnings from Europe’s biggest tech firm ASML dragged chip stocks around the world.
Additionally, investors remain wary, as the US Federal Reserve (Fed) is expected to adopt a modest interest-rate cut path.
Recent Fed commentary continues to suggest that a 25 basis points (bps) rate cut is likely to be the outcome in November. Atlanta Fed President Raphael Bostic said late Tuesday that “my dot was 25 basis points more in 2024 beyond the September 50 basis point cut.”
San Francisco Fed President Mary Daly noted on Tuesday that “if inflation wanes along the lines central bankers expect, I think one or two [rate cuts] this year would be a reasonable thing” for the central bank to implement.”
However, less dovish Fed commentary fails to threaten the Gold price recovery, as investors run for cover in the traditional safe haven on growing uncertainty from China. Further, the US Dollar (USD) struggles to sustain its ongoing uptrend amid recent declines in the US Treasury bond yields, helping Gold price attempt another run toward the record high of $2,686.
All eyes now turn to Thursday when China will hold a press conference to discuss promoting the “steady and healthy” development of the property sector. Also, the US Retail Sales report will go hog the limelight on Thursday, in the absence of high-impact economic data releases from the US in the first half of this week.
In the meantime, China worries will likely dominate risk trends, which could continue to impact the value of the US Dollar, eventually influencing the USD-sensitive Gold price. The bright metal could also take cues from the ongoing geopolitical escalation between Israel and Iran. Israeli Prime Minister Benjamin Netanyahu told French President Emmanuel Macron that he would not agree to a ceasefire deal that failed to stop Hezbollah from rearming and regrouping.
Gold price extends the upswing above the key 21-day Simple Moving Average (SMA) support, now at $2,640, as buyers regain control.
The 14-day Relative Strength Index (RSI), points north above the midline, suggesting that more gains remain in the offing.
Gold price needs acceptance above the key $2,670 resistance on a daily candlestick closing basis to take on the record high at $2,686.
Further up, the $2,700 round level will be tested.
On the flip side, the immediate support is seen at the 21-day SMA at $2,640, below which the three-week lows near the $2,600 threshold will be tested.
A sustained break below the latter could extend the downside toward the September 20 low of $2,585.
Gold has played a key role in human’s history as it has been widely used as a store of value and medium of exchange. Currently, apart from its shine and usage for jewelry, the precious metal is widely seen as a safe-haven asset, meaning that it is considered a good investment during turbulent times. Gold is also widely seen as a hedge against inflation and against depreciating currencies as it doesn’t rely on any specific issuer or government.
Central banks are the biggest Gold holders. In their aim to support their currencies in turbulent times, central banks tend to diversify their reserves and buy Gold to improve the perceived strength of the economy and the currency. High Gold reserves can be a source of trust for a country’s solvency. Central banks added 1,136 tonnes of Gold worth around $70 billion to their reserves in 2022, according to data from the World Gold Council. This is the highest yearly purchase since records began. Central banks from emerging economies such as China, India and Turkey are quickly increasing their Gold reserves.
Gold has an inverse correlation with the US Dollar and US Treasuries, which are both major reserve and safe-haven assets. When the Dollar depreciates, Gold tends to rise, enabling investors and central banks to diversify their assets in turbulent times. Gold is also inversely correlated with risk assets. A rally in the stock market tends to weaken Gold price, while sell-offs in riskier markets tend to favor the precious metal.
The price can move due to a wide range of factors. Geopolitical instability or fears of a deep recession can quickly make Gold price escalate due to its safe-haven status. As a yield-less asset, Gold tends to rise with lower interest rates, while higher cost of money usually weighs down on the yellow metal. Still, most moves depend on how the US Dollar (USD) behaves as the asset is priced in dollars (XAU/USD). A strong Dollar tends to keep the price of Gold controlled, whereas a weaker Dollar is likely to push Gold prices up.
Today’s low almost reached the prior trend high from September 17. That high was 2.44, close to the 50% retracement level at 2.45. Given the intraday bullish reaction, today’s low could hold and lead to a continuation of the bounce and therefore mark a possible completion of the retracement. If it does, the next sign of strength would be a rally above today’s high of 2.55.
Natural gas would then be heading up into resistance zone starting around the prior retracement low of 2.59. Further, the 20-Day MA, now at 2.68, also marks a potential key resistance area and it has converged with the internal uptrend line. It also points to the prior trend high and beginning of a gap at 2.67.
Nonetheless, a breakdown of the near-term trend was indicated yesterday as natural gas fell below the uptrend line and further below the 20-Day MA. The 20-Day line was broken and confirmed with a daily close below the line on Friday. Since the 20-Day MA was broken it opens the door to the possibility of reaching the 50-Day MA. The 50-Day line is now at 2.38.
It sits between two retracement levels. The first price level was reached today at the 50% retracement, and the next potential lower target would be the 61.8% Fibonacci retracement at 2.31. A little below the 2.31 level is the 200-Day MA at 2.52 currently.
Given the natural gas continues to trade inside a consolidation pattern in the form of a large symmetrical triangle the chance for further downside and choppy moves seems possible. The top side of the pattern was hit early this month leading to the current retracement. Therefore, a swing to the other side of the pattern, the bottom, remains a possibility.
For a look at all of today’s economic events, check out our economic calendar.
Gold price is marginally higher on Tuesday, pressuring the weekly high and trading not far from the record posted in September at $2,685.45 a troy ounce. The bright metal benefits from a risk-averse mood and easing US Dollar’s demand, albeit the latter is far from turning bearish.
As the United States (US) macroeconomic calendar remained scarce, speculative interest took clues from equities. Wall Street hit record highs on Monday, but the positive momentum faded in Asia, as falling oil prices undermined the energy sector, while tech shares were also on the back foot. Chinese stocks were also pressured amid disappointing local data and concerns about the economic health of the Asian giant.
As a result, European indexes closed in the red, while US ones are also down. Meanwhile, Crude Oil prices eased after Israeli Prime Minister Benjamin Netanyahu told the US that Israel would strike the Iranian military, not nuclear or oil targets, reducing the market’s concerns about the oil supply.
Multiple Federal Reserve (Fed) officials were on the wires but have provided no fresh clues about where the monetary policy is heading next. For the most, their speeches have been neutral, meaning neither dovish nor hawkish enough to hint at a change in the current view that the central bank will deliver 25 basis points (bps) interest rate cuts in the upcoming meetings.
The daily chart for XAU/USD shows buyers defended the downside at around a bullish 20 Simple Moving Average (SMA), currently at around $2,638. The 100 and 200 SMAs also head north far below the shorter one, in line with the bulls’ dominance. Finally, the Momentum indicator is hovering around its 100 line, while the Relative Strength Index (RSI) indicator turned modestly higher at around 62, also supportive of the bullish case.
The near-term picture shows a limited upward momentum, but the risk remains skewed to the upside. XAU/USD develops above a flat 100 SMA, while the 20 SMA is currently crossing above it, reflecting increased buying interest. Technical indicators, however, have lost their upward strength, holding anyways well above their midlines. Overall, chances are of fresh record highs, particularly if the $2,638.00 level holds.
Support levels: 2,654.90 2,638.00 2,625.40
Resistance levels: 2,673.10 2,685.45 2,700.00
Gold price is trading modestly flat near $2,650 early Tuesday, licking its wounds after retreating from a six-day high of $2,667 set on Monday.
The tepid recovery attempt in Gold price is sponsored by a mild correction in the US Dollar (USD) against its major rivals from over two-month highs. Meanwhile, retreating US Treasury bond yields on renewed haven flows into the government bonds exert downward pressure on the USD, allowing Gold price buyers to briefly come up for air.
Amid a quiet Asian affair, China’s economic worries persist and dent risk sentiment. The latest data showed that Chinese exports grew at the slowest pace in five months in September. Further, a lack of specifics on China’s fiscal stimulus announced last Saturday remains a drag on investors’ confidence.
However, it remains to be seen if Gold price builds on the rebound, as markets continue to bet on a smaller – 25 basis points (bps) interest rate cut by the US Federal Reserve (Fed) in November, with a probability of such a move seen at about 86%, according to the CME Group’s FedWatch Tool.
The Greenback extended its previous week’s advance and hit its highest in over two months across its competitors after Fed Governor Christopher Waller said Monday urged “more caution” on rate cuts ahead, citing recent economic data. “Whatever happens in the near term, my baseline still calls for reducing the policy rate gradually over the next year,” Waller added.
Joining the chorus, Minneapolis Fed President Neel Kashkari said on Monday that the monetary policy is still in a restrictive stance, adding further “modest” rate cuts could be appropriate, per Reuters.
Also, Gold price could face headwinds from easing geopolitical tensions between Israel and Iran after the Washington Post (WaPo) cited two officials familiar with the matter, as saying that Israeli Prime Minister Benjamin Netanyahu told the US that Israel would strike Iranian military, not nuclear or oil, targets. The report suggests that there will be a more limited counterstrike aimed at preventing a full-scale war.
Attention now turns toward speeches from more Fed policymakers for fresh trading impetus in the US Dollar and the Gold price, as full markets return later in the American session on Tuesday. Gold traders could also resort to position adjustments ahead of Thursday’s US Retail Sales data release.
Gold price stays supported above the key 21-day Simple Moving Average (SMA) support, now at $2,635, so far this week.
The 14-day Relative Strength Index (RSI), however, holds firm above the midline, suggesting that any dip in Gold price could be a good buying opportunity in the near term.
If the Gold price recovers, the next bullish target is seen at the previous high of $2,667, followed by the intermittent high at $2,670.
Further up, the record high at $2,686 will come into play.
Conversely, the immediate support is seen at the 21-day SMA at $2,632, below which the three-week lows near the $2,600 threshold will be tested.
A sustained break below the latter could extend the downside toward the September 20 low of $2,585.
Gold has played a key role in human’s history as it has been widely used as a store of value and medium of exchange. Currently, apart from its shine and usage for jewelry, the precious metal is widely seen as a safe-haven asset, meaning that it is considered a good investment during turbulent times. Gold is also widely seen as a hedge against inflation and against depreciating currencies as it doesn’t rely on any specific issuer or government.
Central banks are the biggest Gold holders. In their aim to support their currencies in turbulent times, central banks tend to diversify their reserves and buy Gold to improve the perceived strength of the economy and the currency. High Gold reserves can be a source of trust for a country’s solvency. Central banks added 1,136 tonnes of Gold worth around $70 billion to their reserves in 2022, according to data from the World Gold Council. This is the highest yearly purchase since records began. Central banks from emerging economies such as China, India and Turkey are quickly increasing their Gold reserves.
Gold has an inverse correlation with the US Dollar and US Treasuries, which are both major reserve and safe-haven assets. When the Dollar depreciates, Gold tends to rise, enabling investors and central banks to diversify their assets in turbulent times. Gold is also inversely correlated with risk assets. A rally in the stock market tends to weaken Gold price, while sell-offs in riskier markets tend to favor the precious metal.
The price can move due to a wide range of factors. Geopolitical instability or fears of a deep recession can quickly make Gold price escalate due to its safe-haven status. As a yield-less asset, Gold tends to rise with lower interest rates, while higher cost of money usually weighs down on the yellow metal. Still, most moves depend on how the US Dollar (USD) behaves as the asset is priced in dollars (XAU/USD). A strong Dollar tends to keep the price of Gold controlled, whereas a weaker Dollar is likely to push Gold prices up.
Spot Gold is under mild pressure on Monday, trading with modest losses after peaking at $2,666.71 earlier in the day. XAU/USD is stable at around $2,650 a troy ounce, as the positive tone of Wall Street limits the US Dollar (USD) demand. The Greenback, however, started the week with a firm footing amid persistent geopolitical tensions in the Middle East and news coming from China.
The Chinese Finance Minister Lan Fo’an offered a press conference over the weekend, but failed to provide details on additional support to the battered economy, leaving investors with a sour taste in their mouths. Additionally, Chinese data missed expectations, creating doubts about the economic future of the Asian giant.
Other than that, European equities posted modest gains as investors await clearer clues. This week, Canada and the United Kingdom (UK) will publish inflation updates, while the European Central Bank (ECB) will announce its decision on monetary policy next Thursday. In the meantime, Federal Reserve’s (Fed) officials will be on the wires and may or may not provide fresh clues on what the central bank may do next.
From a technical point of view, the daily chart for XAU/USD shows bulls may be a bit exhausted. The pair stands near its recent highs, but the Momentum indicator heads south and is currently crossing its midline into negative territory. The Relative Strength Index (RSI) indicator also turned lower but holds near overbought territory. At the same, the pair is developing above all its moving averages, which maintain moderated bullish slopes. Overall, the risk of a downward extension seems limited, yet bulls seem to have moved to the sidelines.
In the near term, and according to the 4-hour chart, the technical picture is quite similar. XAU/USD is finding intraday buyers around a flat 100 Simple Moving Average (SMA) while a mildly bullish 20 SMA advances below the longer one. Technical indicators, on the contrary, turned lower within positive levels, showing uneven bearish strength. The risk of a bearish continuation should increase on a break below the $2,636.00 region, the immediate support area.
Support levels: 2,363.00 2,325.40 2,603.90
Resistance levels: 2,661.20 2,673.10 2,685.45
There are several lower price levels to keep an eye on where support may eventually be seen. The maximum for the bulls would be a test of support around the 200-Day MA, currently at 2.25. The 200-Day line was recaptured in early-September leading to an accelerated advance that culminated with the recent swing high of 3.02. This would be the first pullback towards the 200-Day line following the recent advance. Therefore, the 200-Day line has a good chance of marking the maximum low-price zone for the current retracement.
Today’s decline took natural gas below the 38.2% Fibonacci retracement at 2.58, which was near last week’s low. It most likely leads to a test of support around the 50% retracement at 2.45, at a minimum. That price level should be considered along with a prior interim trend high at 2.44. Further down from there is the 50-Day MA, now at 2.37. Moreover, consider the 50-Day line to begin a potential support zone down to the 200-Day MA. However, in between those two moving averages is the 61.8% Fibonacci retracement at 2.31. The 2.31 price zone is also indicated as a potential support area by the mid-August swing high at 2.30.
In the bigger picture, natural gas remains within a large symmetrical triangle pattern that defines a consolidation range. A failed bullish breakout attempt occurred in the most recent rally that ended at the recent high of 3.02. However, since a consolidation triangle exists, there is always the possibility of an eventual test of support at the lower boundary line of the pattern.
For a look at all of today’s economic events, check out our economic calendar.
In its latest short term energy outlook (STEO), which was released this week, the U.S. Energy Information Administration (EIA) revealed its latest Brent oil price forecast for 2024 and 2025.
According to its October STEO, the EIA now sees the Brent spot price averaging $80.89 per barrel this year and $77.59 per barrel next year. In its previous STEO, which was released in September, the EIA projected that the Brent spot price would average $82.80 per barrel in 2024 and $84.09 per barrel in 2025.
A quarterly breakdown included in the October STEO revealed that the EIA sees the Brent spot price average coming in at $75.97 per barrel in the fourth quarter of this year, $78 per barrel in the first quarter of 2025, $79 per barrel in the second quarter, $77.67 per barrel in the third quarter, and $75.72 per barrel in the fourth quarter.
In the EIA’s September STEO, the organization forecast that the Brent spot price would average $81.64 per barrel in the fourth quarter of 2024, $83.34 per barrel in the first quarter of 2025, $85 per barrel across the second and third quarters of next year, and $83 per barrel in the fourth quarter.
The EIA’s latest STEO put the 2023 Brent spot price average at $82.41 per barrel.
“The Brent crude oil spot price averaged $74 per barrel in September, down $6 per barrel from August,” the EIA noted in its October STEO.
“Prices fell in September as concerns over global oil demand growth outweighed declines in oil inventories and OPEC+ members’ decision to delay production increases until December 2024,” it added.
“However, after recent military actions involving Israel, Lebanon, and Iran, the Brent spot price rose to $79 per barrel on October 4, up 11 percent from a week earlier,” it continued.
“The potential for further escalation – such as an Israeli response to Iran’s missile attack on October 1 – have injected significant uncertainty and volatility into oil markets in recent days,” it went on to state.
“Following the September drop in prices and our expectation that oil demand growth will be lower next year than we had previously forecast, we have lowered our forecast for crude oil prices despite increasing oil prices in early October,” it noted.
In its latest STEO, the EIA highlighted that no oil supplies have been affected by increased military action in the Middle East and noted that it does not assume any disruption in its forecast.
“However, the conflict has escalated in recent weeks with no timeline for a potential resolution, increasing the possibility for supply disruptions and price volatility,” the EIA warned.
“At the same time, we assess that significant surplus crude oil production capacity is available, which could be brought online in the event of a disruption,” it added.
In its October STEO, the EIA said OPEC+ production cuts continue to mean less oil is being produced globally than is being consumed and pointed out that oil is being withdrawn from inventories.
In the STEO, the EIA estimated that global oil inventories fell by 0.8 million barrels per day in the third quarter of 2024 and revealed that it expects inventories will fall by 0.6 million barrels per day through 1Q25.
“As a result, we expect Brent prices will rise from $74 per barrel in September to average $79 per barrel in 1H25, which is about $6 per barrel lower than in last month’s STEO,” the EIA said.
“By the middle of next year, we anticipate accelerated growth in oil production as OPEC+ increases its production and as production continues to grow in the United States, Guyana, Brazil, and Canada,” it added.
“We forecast oil inventories will increase by an average of almost 0.6 million barrels per day in 2H25 as production growth globally begins to outweigh global oil demand growth,” it continued.
The EIA also warned in its October STEO that, in addition to the escalating Middle East conflict, other sources of uncertainty remain.
“We now expect production in Libya will begin increasing in the coming weeks, following recent production outages,” it said.
“But production in Libya can be volatile and returning crude oil production volumes might fall short of our expectations,” it added.
“We also assess that OPEC+ producers are likely to continue to limit production below recently announced targets in 2025. However, if OPEC+ producers stick closely to announced production levels in 2H25, it would be a downside risk to oil prices,” it went on to state.
A research note sent to Rigzone by the JPM Commodities Research team last Friday showed that J.P. Morgan expects the Brent crude oil price to average $82 per barrel this year and $75 per barrel next year.
A quarterly breakdown in that note showed that J.P. Morgan sees the commodity averaging $80 per barrel in the fourth quarter of 2024, $82 per barrel in the first quarter of 2025, $77 per barrel in the second quarter, $73 per barrel in the third quarter, and $69 per barrel in the fourth quarter.
In a report sent to Rigzone by Standard Chartered Commodities Research Head Paul Horsnell on Tuesday, Standard Chartered projected that the ICE Brent nearby future crude oil price will average $87 per barrel in the fourth quarter of 2024, $89 per barrel in the first quarter of next year, $92 per barrel in the second quarter, $95 per barrel in the third quarter, and $93 per barrel in the fourth quarter.
“A short-covering rally has taken oil prices sharply higher over the past week,” Standard Chartered analysts, including Horsnell, stated in the report.
“Brent for December delivery settled at $80.93 per barrel on 7 October, a week on week increase of $9.23 per barrel (12.9 percent) making it the strongest over the week among the major commodity contracts,” they added.
“In our view, the entire move down from $80 per barrel to $70 per barrel was an unsustainable undershooting which carried little fundamental information. We see the unwinding of that move in similar terms; while attacks on Beirut provided some initial momentum higher, the rest of the increase was simply the start of a move towards less extreme speculative positioning,” they continued.
In the report, the Standard Chartered analysts noted that, once the unwinding of the undershoot in prices is accounted for, the market response to events in the Middle East, and particularly the threats made against Iranian energy infrastructure, appears extremely limited.
“Brent’s front-month settlement on 7 October was lower than the settlement for the equivalent days in 2021, 2022 and 2023 and prompt prices have simply returned to where they were as recently as late August,” they said.
“Despite the increase in prices, we detect little sign of any change to the overwhelmingly bearish sentiment that has dominated the oil market over the past three months,” they added.
“Many traders are seemingly still prepared to short oil aggressively if the daily news flow and market momentum allows,” they warned.
To contact the author, email andreas.exarheas@rigzone.com