The main tag of Gold Price Articles.
You can use the search box below to find what you need.
[wd_asp id=1]
The main tag of Gold Price Articles.
You can use the search box below to find what you need.
[wd_asp id=1]
Spot Gold trades just around the $2,500 mark, unchanged on Monday and confined to a tight intraday range. The bright metal peaked at $2,505.18 early in the American session, as Treasury yields started the day with a positive footing. The United States (US) 10-year note peaked at 3.76% but then trimmed gains and currently stands at 3.70%.
The US Dollar remained resilient throughout the first half of the day, extending Friday’s NFP-inspired gains. The poor performance of Asian indexes added to USD strength, which receded mid-European session, as local shares managed to post gains, underpinning Wall Street ahead of the opening.
Financial markets are waiting for US inflation data, as the country will release the August Consumer Price Index (CPI) next Wednesday. The index is foreseen up by 2.6% on a yearly basis, easing from the 2.9% posted in July. The core annual reading, however, is expected to remain unchanged at 3.2%.
Following the release of the Nonfarm Payroll (NFP) report, speculative interest lifted bets the Federal Reserve (Fed) may opt for a 50 basis points (bps) rate cut when it meets next week. Cooling inflationary pressures will add to such speculation.
From a technical point of view, the daily chart for XAU/USD shows bulls hold the grip but stay cautious. The pair is currently hovering around a mildly bullish 20 Simple Moving Average (SMA), with buyers quickly adding on dips below the media. At the same time, technical indicators hover around their midlines without clear directional strength. Finally, the longer moving averages maintain modest bullish slopes far below the current level.
The near-term picture is neutral-to-bearish. Converging 20 and 100 SMAs provide resistance around the aforementioned intraday high, while the 200 SMA aims north at around $2,465. The Momentum indicator aims lower at around its midline, skewing the risk to the downside without confirming it. Finally, the Relative Strength Index (RSI) indicator holds directionless at around 50, lacking directional strength.
Support levels: 2,489.60 2,475.70 2,461.50
Resistance levels: 2,507.60, 2,519.75 2,531.60
Just two weeks after lowering its Brent oil price estimate to $80 per barrel for the fourth quarter, Morgan Stanley cut again its forecast, now expecting the international benchmark to average $75 a barrel in the last quarter of the year.
Analysts at Morgan Stanley see rising headwinds on the demand side, which has been their key reason for cutting their Q4 oil price forecast.
“The recent trajectory of oil prices has similarities to other periods with considerable demand weakness,” Morgan Stanley analysts wrote in a Monday note carried by Bloomberg.
The time spreads on the oil’s futures curve have been signaling “recession-like inventory builds,” the analysts noted.
However, they wrote that it was too early to make that part of Morgan Stanley’s base-case scenario.
Monday’s downward revision to oil price forecasts is Morgan Stanley’s second such cut in a little over two weeks.
At the end of August, the Wall Street bank cut its Brent price forecast for the fourth quarter to $80 per barrel, down from $85 expected earlier.
Back then, Morgan Stanley said that the lowered oil price forecast reflected expectations of increased supply from OPEC and non-OPEC producers amid signs of weakening global demand. The bank anticipates that while the crude oil market will remain tight through the third quarter, it will begin to stabilize in the fourth quarter and potentially move into a surplus by 2025.
Early on Monday in Asian trade, Brent Crude prices traded at just below $72 per barrel, after settling on Friday at just above $71—the lowest level since June 2023.
Morgan Stanley isn’t the only major investment bank to have cut its oil price forecasts in recent weeks.
Goldman Sachs has lowered its expected range for Brent oil prices by $5 to $70-$85 per barrel, on the back of weaker Chinese oil demand, high inventories, and rising U.S. shale production.
Citi, for its part, sees $60-per-barrel oil prices next year if OPEC+ fails to implement more production cuts, amid slowing demand and strong supply coming from non-OPEC producers.
By Tsvetana Paraskova for Oilprice.com
Recent U.S. labor market data has fueled speculation about an aggressive rate cut. Private employers added the fewest workers in over three years in August, signaling a sharp slowdown in hiring. This follows a drop in U.S. job openings in July, further reinforcing concerns about the strength of the labor market. ADP’s employment data triggered a notable uptick in gold prices, as market participants viewed the labor market as being in a precarious state.
“The labor market is in a dire state, and there is a lot of concern about it,” noted Phillip Streible, chief market strategist at Blue Line Futures. Additional weekly jobless claims data also failed to improve sentiment, increasing the likelihood of a larger-than-expected rate cut.
Currently, traders see a 59% chance of a 25-basis-point rate cut at the Fed’s next meeting, with a 41% probability of a more substantial 50-basis-point reduction, according to the CME FedWatch tool. The Fed has signaled that incoming economic data, particularly employment figures, will play a key role in determining the size of the cut.
San Francisco Fed President Mary Daly emphasized that the central bank must take action to protect the labor market, but the extent of the move hinges on Friday’s NFP report. Should unemployment rates remain elevated at 4.3%, gold could push towards record highs as markets price in a larger rate cut.
The August NFP report is expected to show a gain of around 160,000 jobs. A result in line with expectations would likely favor a 25-basis-point rate cut, maintaining gold’s recent strength without significant volatility. However, if the jobs number comes in lower, potentially reflecting a more serious economic slowdown, the likelihood of a 50-basis-point cut increases, which would likely boost gold prices further as traders seek safe-haven assets.
Conversely, stronger-than-expected job growth could dampen the prospects of a large cut, leading to potential selling pressure on gold as investors reassess the Fed’s stance.
Gold price is trading on the front foot just shy of the $2,500 threshold early Monday, consolidating Friday’s late rebound. Gold price sticks to its familiar range, as traders brace for the US Consumer Price Index (CPI) data due later this week to confirm the size of the Federal Reserve (Fed) interest rate cut next week.
Gold price clings to the critical short-term daily support level, now at $2,498, finding support from a broadly risk-averse market environment even though the US equity futures rebound in early dealings.
Softer-than-expected China’s inflation data raise demand concerns in the world’s top consumer, fuelling speculations that Chinese authorities could roll out more stimulus measures to stimulate economic prospects, supporting the non-yielding Gold price. China’s inflation rate grew 0.6% in August over the year, lower than the 0.7% expected. Every month, the CPI rose 0.4%, lower than the 0.5% expected.
Increased bets for an outsized Fed rate cut this month help maintain the bullish outlook for Gold price from a wider perspective. However, the further recovery in Gold price could be capped, as the US Treasury bond yields see a modest uptick, courtesy of the improvement in the US stock futures, providing fresh legs to the US Dollar (USD) turnaround.
The USD staged a late recovery on Friday after hitting a fresh eight-day low against its major rivals, in an immediate reaction to the disappointing US labor market report. US Nonfarm Payrolls rose by 142,000 missing a 160,000 gain estimated. On the other hand, the unemployment rate edged down to 4.2%, in line with expectations.
Discouraging US employment data rekindled worries about a possible economic downturn, smashing risk assets such as Wall Street indices. The sell-off in US stocks sparked the haven demand for the Greenback, allowing it to stage a late comeback.
The risk-off sentiment fuelled demand for the US government bonds, weighing heavily on US Treasury bond yields on Friday, helping cushion the downside in Gold price.
Looking ahead, Gold price could extend its range play until Wednesday, when the US inflation data will be published. The data is likely to ramp u volatility around the US Dollar and, in turn, the Gold price. US inflation data will be key to gauging the magnitude of the upcoming Fed rate cut.
Heading into the new week, the short-term technical outlook continues to remain constructive so long as Gold price holds above the 21-day Simple Moving Average (SMA), now at $2,498.
The 14-day Relative Strength Index (RSI) also rebounds while above the 50 level, adding credence to the bullish potential in Gold price.
Recapturing the $2,500 level on a daily closing basis is critical for Gold price to strengthen its bullish bias. The next relevant topside barrier is seen at the record high of $2,532, above which the $2,550 psychological level will come into play.
If Gold price faces rejection once again near the $2,530 supply zone, the correction would require a daily closing below the 21-day SMA at $2,498. A breach of the latter will challenge the previous week’s low of $2,472.
Further down, sellers will need to crack the symmetrical triangle resistance-turned-support at $2,459 to initiate a sustained downtrend.
Gold has played a key role in human’s history as it has been widely used as a store of value and medium of exchange. Currently, apart from its shine and usage for jewelry, the precious metal is widely seen as a safe-haven asset, meaning that it is considered a good investment during turbulent times. Gold is also widely seen as a hedge against inflation and against depreciating currencies as it doesn’t rely on any specific issuer or government.
Central banks are the biggest Gold holders. In their aim to support their currencies in turbulent times, central banks tend to diversify their reserves and buy Gold to improve the perceived strength of the economy and the currency. High Gold reserves can be a source of trust for a country’s solvency. Central banks added 1,136 tonnes of Gold worth around $70 billion to their reserves in 2022, according to data from the World Gold Council. This is the highest yearly purchase since records began. Central banks from emerging economies such as China, India and Turkey are quickly increasing their Gold reserves.
Gold has an inverse correlation with the US Dollar and US Treasuries, which are both major reserve and safe-haven assets. When the Dollar depreciates, Gold tends to rise, enabling investors and central banks to diversify their assets in turbulent times. Gold is also inversely correlated with risk assets. A rally in the stock market tends to weaken Gold price, while sell-offs in riskier markets tend to favor the precious metal.
The price can move due to a wide range of factors. Geopolitical instability or fears of a deep recession can quickly make Gold price escalate due to its safe-haven status. As a yield-less asset, Gold tends to rise with lower interest rates, while higher cost of money usually weighs down on the yellow metal. Still, most moves depend on how the US Dollar (USD) behaves as the asset is priced in dollars (XAU/USD). A strong Dollar tends to keep the price of Gold controlled, whereas a weaker Dollar is likely to push Gold prices up.
International crude oil prices have been on a broader downtrend and crashed nearly 20 per cent in the last 12 months due to a demand-supply imbalance in the market, even as the Organisation of Petroleum Exporting Countries and its allies (OPEC+) eye price stability. Brent and US West Texas Intermediate (WTI) crude futures logged the steepest year-to-date (YTD) crash last week after mixed US jobs data and a potential resolution of the Libya deal.
Amid the price decline, the OPEC+ group agreed last week to pause its planned oil output hike for two months after the benchmark Brent crude futures crashed to a 14-month low due to fragile demand and plentiful supply. OPEC nations will not proceed with the scheduled hike of 180,000 barrels per day (bpd) in October.
-Commodity analysts said crude oil prices are weaker because of the current oil market conditions. They added that OPEC is ‘artificially’ curtailing oil production and losing its market share to maintain Brent above $80 per barrel.
-”US is producing more crude oil than any nation at any time for the past six years in a row, according to EIA. US output was 13.1 mbpd in 2023, which is expected to further jump to 13.19 mbpd in 2024 and 13.65 mbpd by 2025 and this record is unlikely to be broken by any nation in the near term,” Mohammed Imran, Research Analyst at Sharekhan Commodities by BNP Paribas told LiveMint.
-According to experts, benchmark Brent crude futures is unlikely to touch the $100 mark until and unless there is an escalation of the Middle Eastern war turning into a full-blown war involving major producers in the region.
-OPEC is likely to extend the curbs through the second half of this year and might start unwinding from early 2025. Crude is expected to trade in a range of $70 – $90 per bbl this year, with OPEC keeping a floor under prices,” Kaynat Chainwala, AVP-Commodity Research of Kotak Securities told LiveMint.
-US government data showed employment increased less than expected in August. Still, a drop in the jobless rate to 4.2 per cent suggested an orderly labor market slowdown that may not warrant a big interest rate cut from the Federal Reserve this month. Concerns around Chinese demand also kept pressuring oil prices.
Also Read: Oil & gas reserve found in Pakistani waters; likely to be fourth-largest in world: Report
-Last Thursday, Brent settled at its lowest since June 2023 despite withdrawing from US oil inventories and OPEC+’s decision to delay planned oil output increases. US crude stockpiles fell by 6.9 million barrels to 418.3 million barrels last week, with a projected decline of 993,000.
-Signals that Libya’s rival factions could be closer to an agreement to end the dispute that has halted the country’s crude exports also pressured oil prices this week. Exports remained mostly shut in, but some loadings were permitted from storage.
-Bank of America lowered its Brent price forecast for the second half of 2024 to $75 a barrel from almost $90 previously, it said in a note on Friday, citing building global inventories, weaker demand growth and OPEC+ spare production capacity. The US active oil rig count, an early indicator of future output, remained unchanged at 483 this week, said energy services firm Baker Hughes.
Crude oil prices settled two per cent lower in the previous session, with a big weekly loss after data US jobs data was weaker than expected in August, which outweighed price support from a delay to supply increases by OPEC+ producers.
Brent crude futures were down $1.63, or 2.24 per cent, to $71.06 a barrel, their lowest level since Dec. 2021. US West Texas Intermediate crude futures fell $1.48, or 2.14 per cent, to $67.67, their lowest since June 2023. For the week, Brent declined 10 per cent, while WTI dropped around eight per cent. Back home, crude oil futures last settled 0.07 per cent lower at ₹5,700 per barrel on the multi commodity exchange (MCX).
OPEC says its member states’ exports account for about 49 per cent of global crude exports. OPEC estimates that its member countries hold about 80 per cent of the world’s proven oil reserves. Because of its large market share, OPEC’s decisions can affect global oil prices. OPEC+ members meet regularly to decide how much oil to sell on global markets.
Commodity analysts say oil prices continue to see high volatility but have remained under selling pressure overall amid further signs of a deteriorating global economic outlook, leading to sluggish demand (especially from China).
“Downside looks limited amid support from bigger than expected drawdown in oil inventories and OPEC+ member’s decision to continue with their additional output cuts. On charts… prices hold support at 5,800/ 5,720, while on the upside resistance is seen at 6,030/ 6,150,” said Pranav Mer, Vice President, EBG – Commodity & Currency Research, JM Financial Services Ltd.
Disclaimer: The views and recommendations made above are those of individual analysts or broking companies, and not of Mint. We advise investors to check with certified experts before taking any investment decisions.
Catch all the Business News , Market News , Breaking News Events and Latest News Updates on Live Mint. Download The Mint News App to get Daily Market Updates.
MoreLess
Oil prices stabilized on Wednesday as the Organization of the Petroleum Exporting Countries (OPEC) maintained its growth forecast for oil demand for this year and next, while U.S. crude and gasoline inventories likely decreased last week.
At 1312 GMT, Brent futures rose by 1 cent, or 0.01%, to $84.67 a barrel, following a 1.3% decline in the previous session. Meanwhile, U.S. West Texas Intermediate (WTI) crude increased by 11 cents, or 0.11%, to $81.52 a barrel, after falling 1.1% in the prior session.
“Crude oil prices traded lower on firm dollar and as hurricane that hit Texas caused less damage than expected. Reduced supply concerns has weighed on the oil prices. Furthermore, weakness in crude demand from China also weighed on oil prices to slip below the $82 mark. Meanwhile, tension in the Middle East and lower supplies from Russia provided support to oil price,” said brokerage firm ICICI Direct in a report.
In its monthly report released on Wednesday, OPEC reaffirmed its global oil demand growth forecasts, projecting an increase of 2.25 million barrels per day (bpd) in 2024 and 1.85 million bpd in 2025.
“Expected strong mobility and air travel in the Northern Hemisphere during the summer driving/holiday season is anticipated to bolster demand for transportation fuels and drive growth in the United States,” OPEC was quoted as saying by Reuters.
According to market sources citing American Petroleum Institute figures on Tuesday, U.S. crude oil inventories decreased by 1.923 million barrels, while gasoline inventories dropped by 2.954 million barrels. Official data from the U.S. Energy Information Administration is scheduled for release at 14:30 GMT.
Both contracts ended the past three sessions lower, as the Texas energy industry appeared largely unaffected by Hurricane Beryl.
Oil and gas companies restarted some operations on Tuesday. Some ports have reopened, and most producers are ramping up output, though some facilities sustained damage and are waiting for full power restoration.
In the Middle East, ceasefire negotiations for the Gaza conflict are set to resume in Doha, with intelligence chiefs from Egypt, the United States, and Israel attending.
Concerns over demand in China also pressured prices. Consumer prices in the world’s second-largest economy grew for the fifth consecutive month in June but missed expectations, while producer price deflation continued.
In its annual Energy Outlook report released on Wednesday, BP stated that it expects oil demand to peak next year, with rapid growth in wind and solar capacity in both of its main scenarios.
Gold price (XAU/USD) trades with a positive bias for the third straight day and is placed around the $2,520 area, or the top end of the weekly range during the early European session on Friday. The upside, however, seems limited as traders remain cautious ahead of the crucial US Nonfarm Payrolls (NFP) report, which might influence market expectations about the possibility of a larger interest rate cut by the Federal Reserve (Fed) in September. This, in turn, will play a key role in driving the US Dollar (USD) demand and provide a fresh directional impetus to the non-yielding yellow metal.
Meanwhile, the markets are pricing in a 40% chance that the Fed will lower borrowing costs by 50 basis points (bps) at the end of the September 17-18 policy meeting. The bets were lifted by a mixed bag of US employment data released this week, which provided evidence of a deteriorating labor market. In fact, a report on Wednesday showed that US job openings dropped to a three-and-a-half-year low of 7.673 million in July. Adding to this, Automatic Data Processing (ADP) reported on Thursday that private-sector employment registered the smallest rise since January 2021 and increased by 99K in August.
Furthermore, Chicago Fed President Austan Goolsbee said on Friday that the longer-run trend of labor market and inflation data justify easing interest-rate policy soon and then steadily over the next year. This keeps the US Treasury bond yields depressed at their lowest levels in more than a year and drags the USD away from a two-week high touched on Tuesday, which, in turn, is seen offering some support to the Gold price. Hence, even a slight disappointment from the closely-watched US monthly jobs data could prove negative for the Greenback and pave the way for some meaningful upside for the commodity.
In contrast, the immediate market reaction to the better-than-expected report is more likely to be limited amid the prospects for an imminent start of the Fed’s rate-cutting cycle. Nevertheless, the Gold price remains on track to register modest weekly gains and the fundamental backdrop seems tilted firmly in favor of bullish traders.
From a technical perspective, a sustained strength beyond the $2,524-$2,525 hurdle will reaffirm the near-term positive outlook. Given that oscillators on the daily chart are holding in positive territory and are still away from being in the overbought zone, the Gold price might then aim to surpass the all-time peak, around the $2,531-$2,532 region touched in August. The subsequent move-up should pave the way for the resumption of a well-established uptrend witnessed over the past two months or so.
On the flip side, the $2,500 psychological mark now seems to protect the immediate downside, below which the Gold price could slide to the $2,471-$2,470 horizontal support. A convincing break below the latter will set the stage for deeper losses towards the 50-day Simple Moving Average (SMA), currently pegged near the $2,440 region, en route to the $2,400 mark and the 100-day SMA, around the $2,388 zone.
Even though natural gas will show strength with today’s close relative to the 200-Day MA, it has not been able to breakout above the 2.30 resistance level. Therefore, it may need a little time with a quick pullback or consolidation before it tries. The narrow range day shows momentum diminishing at a likely resistance level.
A decisive breakout above the 50-Day MA occurred yesterday, so support may be seen there if it is reached. It would be a stronger indication of demand if support is found above or at the 50-Day MA rather than below it. Yesterday was the first daily close above the 50-Day line since July 2 and along with a rise above the 200-Day line today shows constructive development of the advance.
A decisive breakout above 2.30 will trigger a breakout of a double bottom pattern. The formation points to a potential minimum target of 2.72. That would put it close to the 61.8% Fibonacci retracement level at 2.67. Close enough to consider a potential resistance range from 2.67 to 2.72. However, the first higher target zone is around the 50% retracement at 2.52.
The weekly time frame shows an improvement in the strength of natural gas as well. This week’s closing price will be near the high of the week’s range and the highest weekly closing price in eight weeks. Trading has occurred largely below the 20-Week MA during that time, and it will challenge the 20-Week line at 2.33. It is possible that an advance will see resistance there, but it is also possible that natural gas rises right past it.
For a look at all of today’s economic events, check out our economic calendar.
Goldman Sachs (NYSE:GS) has revised its copper price forecast, significantly lowering its 2025 estimate due to weakening demand from China, a major consumer of the metal.
The American investment bank now anticipates that copper prices will average US$10,100 per metric ton next year, a sharp reduction from its previous forecast of US$15,000.
According to Bloomberg, the US$15,000 prediction came from former analysts Jeffrey Currie and Nicholas Snowdon, while the new outlook was outlined in a note by analysts including Samantha Dart and Daan Struyven.
Explaining their thoughts on China, Dart and Struyven point to its ongoing economic challenges, including a persistent downturn in the property sector and slower-than-expected recovery in manufacturing and exports.
As copper demand from the Asian nation has slowed, inventories of the red metal have risen.
Goldman Sachs has also adjusted its price forecasts for other commodities.
It is now estimating an aluminum price of US$2,540 per metric ton, down from US$2,850. The bank is holding to its bearish outlook on iron ore and nickel, reflecting the broader trend of weaker demand in key markets.
“Softer-than-expected China commodity demand, as well as downside risks to China’s forward economic outlook, lead us to a more selective, less constructive tactical view of commodities,” the analysts said.
China’s economic growth is struggling to meet the government’s 5 percent annual target, primarily due to a surplus of raw material inventories that is unlikely to clear soon due to softening demand.
Goldman Sachs remains optimistic about gold, maintaining a target price of US$2,700 per ounce for early 2025. The bank cites increased interest from managed money players in the west and continued demand from central banks as key factors supporting its positive outlook. Interest rate cuts from the US Federal Reserve are also seen helping gold.
Major miners involved in copper and aluminum production saw share price declines on the news, including Freeport-McMoRan (NYSE:FCX), BHP (LSE:BHP,ASX:BHP,NYSE:BHP) and Rio Tinto (ASX:RIO,NYSE:RIO,LSE:RIO).
Don’t forget to follow us @INN_Resource for real-time updates!
Securities Disclosure: I, Giann Liguid, hold no direct investment interest in any company mentioned in this article.
The views and opinions expressed herein are the views and opinions of the author and do not necessarily reflect those of Nasdaq, Inc.
With a market cap of more than $3.53 trillion, Apple is among the world’s most valuable companies. Its advantages ensure it will be a powerful force for years to come.
Apple has been on the market far longer than many other tech companies. It went public at an initial public offering price of $22 in 1980. Since then, AAPL has been one of the most rewarding tech stocks for long-term investors.
But AAPL didn’t begin to rise rapidly until years after its IPO. The company released the Lisa, a precursor to the Macintosh computer, in January 1983. At this point, Apple stock was around 15 cents, adjusted for future splits. It wouldn’t reach a split-adjusted $1 until the dot-com era. AAPL reached $1 for the first time on Dec. 3, 1999. It dropped again once the bubble burst, falling to under 25 cents in October 2002.
The stock price slowly increased in the ensuing years, reaching a split-adjusted $1 in 2004. It continued growing, crossing the $6 mark in 2007. But it fell back to $3 during the Great Recession in 2008 and 2009.
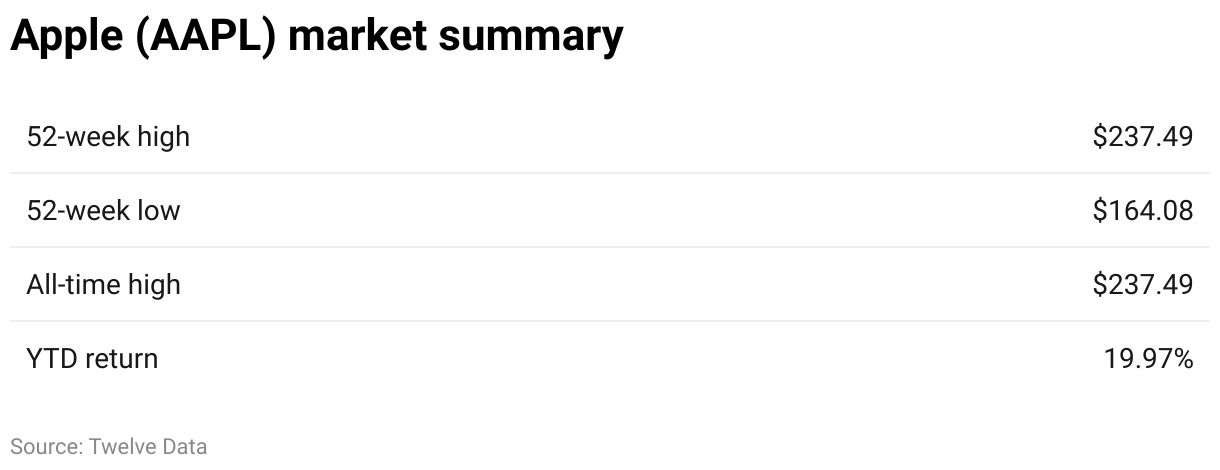
AAPL has been on the rise since then. On July 15, 2024, it reached an all-time intraday high of $237.23. The stock surged after the company announced a new artificial intelligence platform called Apple Intelligence.
AAPL has been an exceptional investment. Since its IPO over 40 years ago, it has generated extraordinary returns. In the past five years alone, AAPL has increased by more than 340%.
The iPhone is at the heart of Apple’s sales. But the company’s outperformance has continued even as iPhone sales growth began to stagnate in the mid-2010s.
In fiscal 2023, Apple’s net sales decreased slightly to $383.3 billion, compared to $394.3 billion in 2022. Gross margin decreased slightly to $169.1 billion, compared to $170.8 billion the year before.
Apple generated most of its sales from the iPhone, totaling $200.6 billion in 2023. Services were a distant second, with $85.2 billion in net sales.
The company increased its cash reserves considerably in 2023 to nearly $30 billion. That was up from $23.6 billion the year before.
Earnings per share were nearly the same at $6.16 in 2023 and $6.15 in 2022. EPS is expected to be $6.70 this year, with an uptick in 2025 to $7.48.
Apple is a leading consumer electronics maker. Over half of its fiscal 2023 revenue came from the iPhone.
The company also sells MacBook laptops, iMac desktop computers, iPad tablets and Apple Watches. It generally competes at the medium-to-high end of its product markets and charges premium prices.
The services segment includes sales from the app store, iCloud storage, and advertising businesses. It also includes the Apple Pay mobile payment system and Apple Music. Services segment revenue comprised about 20% of the company’s total sales in fiscal 2023. The services segment also includes subscription revenue from Apple Fitness+, Apple TV+ and Apple One plans.
Many people love Apple products. But the company isn’t immune to controversy.
One recent controversy involved the company’s proprietary Lightning port. Only Apple devices had this port, requiring specific charging cables. USB-C connectors, compatible with various devices, have become standard in the tech industry.
The European Commission passed a law in 2022 that required all mobile phones sold in the European Union to have USB-C ports by the end of 2024. Apple had little choice but to abandon the Lightning port. At the iPhone 15 announcement in 2023, the company said future generations would have USB-C connectors.
Apple also faced backlash in 2024 over its “Crush!” ad. The ad featured objects like a record player, books and a guitar being crushed into the new iPad Pro. It received widespread criticism for symbolizing tech’s destructive impact on creativity and humanity. Apple later apologized.
Warren Buffett’s holding company, Berkshire Hathaway, has long been a large holder of Apple stock. That is still true today, as Apple is Berkshire’s single largest portfolio holding. In addition, Berkshire is still one of the largest corporate holders of Apple stock.
However, the company has sold over 500 million shares of Apple stock in 2024 alone. That reduced the company’s Apple holdings by more than half. During Berkshire’s meeting in May, Buffett said he expects capital gains rates to increase. Analysts also believe Berkshire may be looking to increase its cash position.
Apple went public on Dec. 12, 1980, at $22 per share. The stock has split five times, putting the split-adjusted IPO price at 10 cents per share.
The company raised $100 million with its IPO. Those who made a small investment in Apple’s IPO have greatly benefited. For example, if you invested $1,000 during the IPO, your investment would be seven figures today.
Apple’s most recent stock split was 4-for-1 in August 2020. If you crunch the numbers on all five stock splits, a single share of the company’s IPO stock would represent 224 shares of AAPL today.
On a split-adjusted basis, AAPL climbed as high as $1.34 in March 2000 during the tech bubble. But it dropped to under 24 cents in October 2002 after the dot-com bubble burst.
AAPL hit a split-adjusted intraday high of $237.23 on July 15, 2024.
Apple is well-positioned to continue outperforming. But it faces several potential stumbling blocks.
The company is notoriously secretive about its internal product development. Still, it shows no signs of slowing down on innovation. In June 2024, Apple introduced Apple Intelligence, a new AI technology for iPhone, iPad, and Mac. A year prior, the company unveiled its Apple Vision Pro wearable headset and spatial computer.
Apple’s focus on its high-margin services segment has also created new growth sources for the company. In the third quarter of 2024, it posted an all-time revenue record in services. Product revenue increased year over year as well. But Apple’s stock buyback of more than $110 billion will continue to support its share price.
The company could face regulatory risks regarding AI innovations. But CEO Tim Cook said Apple plans to take a “deliberate and thoughtful” approach. Estimates of iPhone unit sales suggest no meaningful growth since 2015. But by adding AI features to devices, Apple could get customers excited again. That said, iPhone sales decreased slightly year overyear in the third quarter of 2024.
AAPL is one of the top stocks in the Nasdaq composite index, with a weight of 11.25%, as of June 28, 2024.
The table below lists the 10 stocks with the greatest weighting in the Nasdaq by market cap. It’s reordered daily at market close.
Analysts expect slightly higher revenue for Apple in 2024, with an average estimate of $390.3 billion versus $383.3 billion in 2023. Both numbers are lower than 2022’s revenue of $394.3 billion.
Of the 47 analysts surveyed, 23 recommend buying, nine rate it as “overweight,” 13 recommend holding, one rates it as “underweight,” and one recommends selling. At the time of this writing, the average price target is $244.31.
Analysts project increases in Apple’s revenue in 2025, with an average estimate of $421.4 billion. EPS is expected to increase to $7.48.
AAPL soared after the announcement of the AI platform in mid-2024. The stock is up more than 20% in 2024. But given the $244.31 one-year price target, analysts don’t expect eye-popping returns, at least not immediately.
Making long-term predictions for an individual stock price is extremely difficult. Past performance doesn’t guarantee future results. Whether a stock has done well or fared poorly of late, the tide can shift overnight.
Apple’s bullish performance could continue if it maintains growth in the services segment. The company will likely need to continue growing revenue in various segments to offset slumping iPhone sales in the coming quarters. These include video, AppleCare, cloud services and payments.
Apple must continue to uphold its innovative reputation and keep iPhone users.
Daniel Newman, CEO and analyst at The Futurum Group, said Apple was late to the AI party. But the company is meeting consumers where they are rather than trying to anticipate demand.
“Creating multimodal interactions that can traverse device types and create continuity has been part of Apple’s secret sauce and will continue to be in the AI era,”
Newman said.
The average target among the Wall Street analysts covering Apple stock is $210. Among 47 analysts, 23 recommend buying, nine rate it as “overweight,” 13 recommend holding, one rate it as “underweight” and one recommends selling.
At the time of this writing, AAPL hit an all-time intraday high of $237.23. It reached that price on July 15, 2024.
Apple’s stock has split five times since the company went public. On Aug. 28, 2020, it split 4-for-1. On June 9, 2014, it split 7-for-1. It split 2-for-1 on Feb.28, 2005, June 21, 2000, and June 16, 1987.
AAPL pays a quarterly dividend. Its yield is 0.44%. It pays dividends in February, May, August and November.