The main tag of Gold Price Articles.
You can use the search box below to find what you need.
[wd_asp id=1]
The main tag of Gold Price Articles.
You can use the search box below to find what you need.
[wd_asp id=1]
From next week, fines for unauthorised absences will go up by as much as £40.
Under the new system, the cost of a penalty charge notice will rise from £60 to £80 if paid within 21 days, and from £120 to £160 if paid within 28 days.
This marks the first increases since the system was introduced in 2013.
Children are only allowed to miss school if they are unwell, or they have been given permission from the school in advance.
Parents can make an absence request to take their children out of school, but there needs to be “exceptional circumstances” and the headteacher needs to authorise it.
Currently, it’s the responsibility of the local authority to decide when to issue fines, meaning the process varies from council to council.
But, under the new rules which were created by the Conservative government, all schools will be required to consider a fine when a child has missed at least five days of school for unauthorised reasons.
What happens if you keep getting fined?
If a parent receives a second fine for the same child within any three-year period, this will be charged at the higher rate of £160.
A parent can only receive two fines within any three-year period, and once this has been met, other actions can be considered.
This includes a parenting order or prosecution.
Parents who are prosecuted and attend court because their child hasn’t been attending school, can be fined up to £2,500.
Where is the money spent?
Government guidance states any money collected from fines should be used by the local authority to cover the costs of administering the system.
Any surplus after that should be spent on “attendance support”.
Any cash remaining at the end of the year must be paid to the education secretary.
A Department for Education spokesperson said: “High and rising school standards are at the heart of our mission to break down barriers to opportunity and give every child the best start in life. Strong foundations of learning are grounded in attendance in the classroom.
“Tackling the root causes of absence is a major priority for the government.
“Our support-first approach outlined in our guidance is designed to help parents to meet their responsibility to ensure their child attends school.
“However, in some cases, including term-time holidays, it may be necessary to issue penalty notices.”
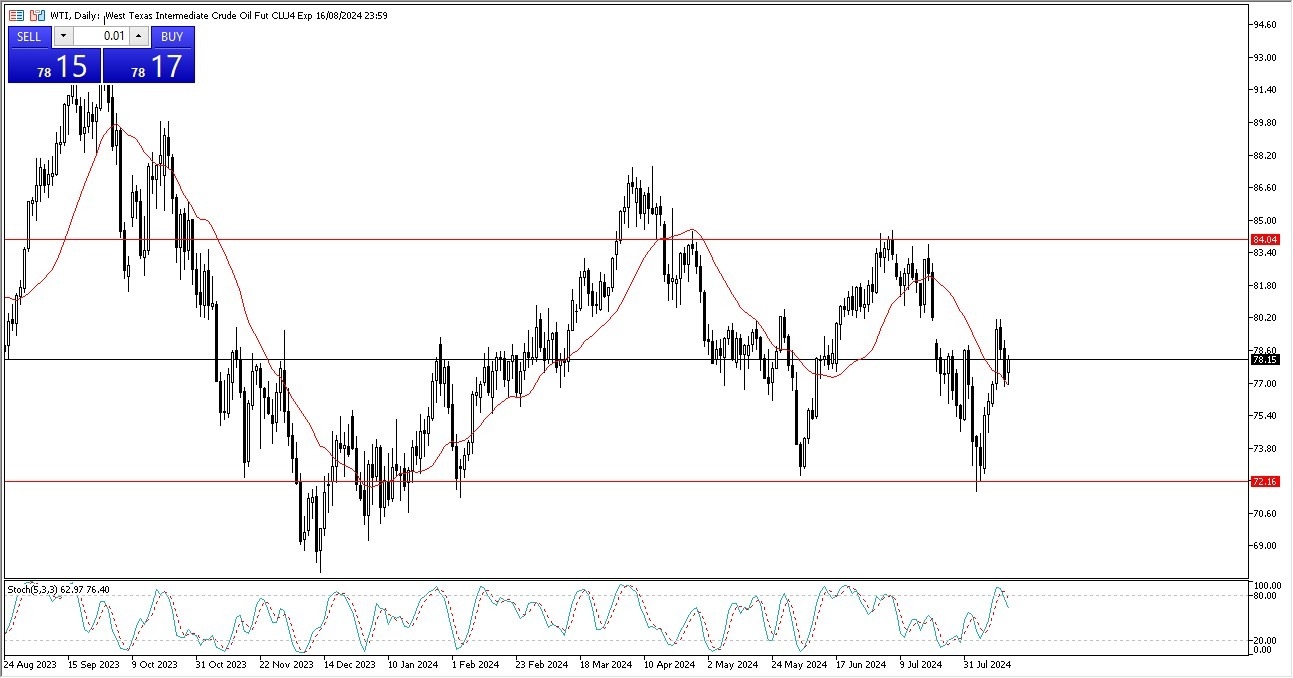
It’ll be a difficult market to trade in because I think at this point in time, you have a lot of external factors going on as well. For example, the tension in the Middle East will of course continue to work to support the price of crude oil, but at the same time, you also have to worry about the economy slowing down and therefore driving down demand.

We are getting towards the end of summer, which is the high season for crude oil demand. So really at this point in time, you would have to say that this has been a less than stellar summer. It hasn’t exactly been horrible. It just hasn’t been overly exciting for those bullish on crude oil. At this point in time, I think if you could break above the $80 level, then we could see the market go looking to the $84 level.
If we break down below the $77 level, the $75 level will be targeted. And then again, we could test the $72 level underneath there. The stochastic oscillator is overbought and crossing over to show signs of weakness. So, while I don’t necessarily place a trade based on that alone, it does suggest that perhaps it is going to be a little bit sluggish. In general, we have a handful of levels that we need to be watching and those will tell us where the market is more likely than not going to go.
Ready to trade crude oil Forex analysis? We’ve shortlisted the best Forex Oil trading brokers in the industry for you.
Gold price (XAU/USD) flat lines near $2,455 during the early Asian session on Friday. The yellow metal seesaws between gains and losses amid the consolidation of the US Dollar (USD). Traders will focus on the preliminary of the US Michigan Consumer Sentiment Index for August, along with the Building Permits and Housing Starts.
Following the release of encouraging employment-related data and strong retail sales, speculative interest in the world’s biggest economy decreased, easing fears about a potential recession. However, traders still see the US Federal Reserve (Fed) start easing the policy in September. According to the CME FedWatch Tool, the markets are now pricing in a nearly 80% chance of a September rate cut and expect 200 basis points (bps) of reduction in the next 12 months, though that will depend on incoming data.
Data released by the US Census Bureau on Thursday showed that Retail Sales in the United States rose by 1.0% MoM in July, compared to a decline of 0.2% in June. This figure surpassed the estimation of a 0.3 increase. Meanwhile, the Initial Jobless Claims for the week ending August 10 arrived at 227K, better than the expectation of 235K and down from the previous week of 234K. The recent stronger job data and upbeat Retail Sales have strengthened the USD broadly and weighed on the precious metal.
Nonetheless, the elevated geopolitical risks in the Middle East might provide some support to Gold price, a traditional safe-haven asset. Gaza’s Health Ministry says more than 40,000 Palestinians have been killed in Israeli attacks since October 7, with many more buried under rubble and threatened by illness, according to local news source Aljazeera.
Gold has played a key role in human’s history as it has been widely used as a store of value and medium of exchange. Currently, apart from its shine and usage for jewelry, the precious metal is widely seen as a safe-haven asset, meaning that it is considered a good investment during turbulent times. Gold is also widely seen as a hedge against inflation and against depreciating currencies as it doesn’t rely on any specific issuer or government.
Central banks are the biggest Gold holders. In their aim to support their currencies in turbulent times, central banks tend to diversify their reserves and buy Gold to improve the perceived strength of the economy and the currency. High Gold reserves can be a source of trust for a country’s solvency. Central banks added 1,136 tonnes of Gold worth around $70 billion to their reserves in 2022, according to data from the World Gold Council. This is the highest yearly purchase since records began. Central banks from emerging economies such as China, India and Turkey are quickly increasing their Gold reserves.
Gold has an inverse correlation with the US Dollar and US Treasuries, which are both major reserve and safe-haven assets. When the Dollar depreciates, Gold tends to rise, enabling investors and central banks to diversify their assets in turbulent times. Gold is also inversely correlated with risk assets. A rally in the stock market tends to weaken Gold price, while sell-offs in riskier markets tend to favor the precious metal.
The price can move due to a wide range of factors. Geopolitical instability or fears of a deep recession can quickly make Gold price escalate due to its safe-haven status. As a yield-less asset, Gold tends to rise with lower interest rates, while higher cost of money usually weighs down on the yellow metal. Still, most moves depend on how the US Dollar (USD) behaves as the asset is priced in dollars (XAU/USD). A strong Dollar tends to keep the price of Gold controlled, whereas a weaker Dollar is likely to push Gold prices up.
Silver price (XAG/USD) gives up some of its intraday gains in Thursday’s New York session after the release of the resilient United States (US) Retail Sales data for July and lower-than-expected number of individuals claiming jobless benefits for the first time in the week ending August 9.
The white metal struggles to hold the crucial support of $28.00 as upbeat US data has boosted the US Dollar (USD) and bond yields. The US Dollar Index (DXY), which tracks the Greenback’s value against six major currencies, bounces back above 103.00. 10-year US Treasury yields soar to near 3.96%. Higher yields on interest-bearing assets weigh on non-yielding assets, such as Silver, by increasing the opportunity cost of holding investment in them.
The Retail Sales, a key measure of consumer spending, returned to expansion and rose at a robust pace of 1% from the estimates of 0.3%. Meanwhile, Initial Jobless Claims came in in lower at 227K than estimates of 235K and the prior release of 234K, upwardly revised from 233K. This is the second consecutive time when number of jobless claims have come in lower than expectations, suggesting that labor market conditions are not as bad as they were indicated by the Nonfarm Payrolls (NFP) data for July.
Meanwhile, the near-term outlook of the Silver price remains firm as investors remain confident that the Federal Reserve (Fed) will begin reducing interest rates from the September meeting. However, upbeat data have dashed hopes the Fed will adopt an aggressive policy-easing stance.
Silver price bounced back after a negative divergence formation on a four-hour timeframe, which shapes when the momentum oscillator refuses to make lower lows, while the asset continues that formation. The 14-period Relative Strength Index (RSI) rebounded from 24.00 without hitting downside below previous low of 20.00.
However, the above-mentioned formation would trigger if the white metal breaks above the immediate swing high plotted from the August 2 high of $29.23.
The asset stays above the 20-period Exponential Moving Average (EMA) near $27.80, suggesting that the near-term trend has leaned on the upside.
The 14-period RSI has bounced back to near 60.00 and a decisive break above the same will trigger the upside momentum.
Silver is a precious metal highly traded among investors. It has been historically used as a store of value and a medium of exchange. Although less popular than Gold, traders may turn to Silver to diversify their investment portfolio, for its intrinsic value or as a potential hedge during high-inflation periods. Investors can buy physical Silver, in coins or in bars, or trade it through vehicles such as Exchange Traded Funds, which track its price on international markets.
Silver prices can move due to a wide range of factors. Geopolitical instability or fears of a deep recession can make Silver price escalate due to its safe-haven status, although to a lesser extent than Gold’s. As a yieldless asset, Silver tends to rise with lower interest rates. Its moves also depend on how the US Dollar (USD) behaves as the asset is priced in dollars (XAG/USD). A strong Dollar tends to keep the price of Silver at bay, whereas a weaker Dollar is likely to propel prices up. Other factors such as investment demand, mining supply – Silver is much more abundant than Gold – and recycling rates can also affect prices.
Silver is widely used in industry, particularly in sectors such as electronics or solar energy, as it has one of the highest electric conductivity of all metals – more than Copper and Gold. A surge in demand can increase prices, while a decline tends to lower them. Dynamics in the US, Chinese and Indian economies can also contribute to price swings: for the US and particularly China, their big industrial sectors use Silver in various processes; in India, consumers’ demand for the precious metal for jewellery also plays a key role in setting prices.
Silver prices tend to follow Gold’s moves. When Gold prices rise, Silver typically follows suit, as their status as safe-haven assets is similar. The Gold/Silver ratio, which shows the number of ounces of Silver needed to equal the value of one ounce of Gold, may help to determine the relative valuation between both metals. Some investors may consider a high ratio as an indicator that Silver is undervalued, or Gold is overvalued. On the contrary, a low ratio might suggest that Gold is undervalued relative to Silver.
With the Israel Hamas conflict continuing to mount and even reports of the United States preparing to ship $750 million worth of bombs to Saudi Arabia, oil prices are trending lower due to Tuesday’s IEA report that forecast lower oil demand growth in 2025 than it was previously predicting.
The IEA didn’t change its 2024 forecast, but the oil markets recoiled at the prospect of smaller oil demand growth next year, rising only 950,000 bpd—just a 30,000 bpd reduction from its previous forecast.
At 11:46 pm CST, Brent crude was trading down 1.68% at $80.91 per barrel—a drop of $1.38 per barrel on the day. WTI crude was trading down 2 on the day at $78.62 per barrel. For Brent, the price is still $4 above where it was trading this same time last week.

Find more oil prices from around the world here
The demand growth outlook’s effect on oil prices was undaunted by reports of the United States lifting 2021 restrictions on the sale of bombs to Saudi Arabia and its subsequent shipment of more than $750 million worth of bombs to Saudi Arabia—a move that may improve relations between the United States and Saudi Arabia, but could heat up tensions in the Middle East, particularly the war Saudi Arabia against the Houthi rebels in Yemen. The Biden Administration has enjoyed a strained relationship with Saudi Arabia after The U.S. president shunned the Saudi royals due to its assassination of journalist and dissident Jamal Khashoggi.
Those deliveries of the bombs are likely to start in several months. Saudi Arabia’s military renewed its strikes on Houthi targets just yesterday, pro-Iranian media reported on Monday, with Saudi drones striking the Al-Ghor area and Kamaran Island near the port of Hodeida.
By Julianne Geiger
More Top Reads From Oilprice.com
Spot Gold trades with modest gains in the American afternoon, having experienced some early volatility. XAU/USD fell to $2,432.04 ahead of Wall Street’s opening as a batch of United States (US) data pushed speculative interest away from the safe-haven metal. Financial markets welcomed news that US Retail Sales rose by 1% in July, far better than the 0.3% advance anticipated. Furthermore, Initial Jobless Claims rose by less than anticipated in the week ending August 9, up 227K vs the 235K forecast.
The US Dollar surged with the news against all major rivals, while US indexes also advanced, as the numbers spooked fears of a recession while maintaining unchanged the odds for an upcoming Federal Reserve (Fed) interest rate cut. Stock markets remained optimistic after the opening, extending gains to fresh weekly highs, but the USD retreated. The second batch of US data was less encouraging, as Capacity Utilization hit 77.8% in July while Industrial Production in the same month was down 0.6%, both worse than expected and below June figures.
The daily chart for the XAU/USD pair shows it remains within familiar levels, and while trading in the green, it posted a lower high and a lower low, usually seen as a bearish sign. Technical indicators have turned marginally lower but remain within positive levels, limiting the odds of a steeper decline. Finally, the pair keeps developing above all its moving averages, with the 20 Simple Moving Average (SMA) flat above bullish 100 and 200 SMAs. Overall, the case of a steeper leg lower seems unlikely.
In the near term, and according to the 4-hour chart, the pair is neutral-to-bullish. Technical indicators turned higher, but remain at around their midlines. Meanwhile, a mildly bullish 20 SMA provides dynamic resistance a few $ above the current level, while the longer moving averages extended their modest upward slopes below the current level. More relevantly, buyers defend the downside at around the 23.6% Fibonacci retracement of the June/July rally at $2,438.80.
Support levels: 2,438.80 2,4260.90 2,438.80
Resistance levels: 2,471.10 2,483.70 2,495.00
A one-day pullback was reversed yesterday leading to trend continuation signal. It was further confirmed with today’s advance to a high of 2.30. Resistance was seen off that high and was followed by a pullback to below the 2.27 pivot. At the time of this writing natural gas is poised to end Thursday’s trading session below the 2.27 level as it is trading within the lower half of the day’s range. Yet, a new higher daily higher and higher low should complete today.
Given the quick recovery of the bull trend following a one-day decline, it looks likely that natural gas may continue higher before a deeper pullback. Nonetheless, there are a couple potential support zones to be aware of. First, there is the pullback low of 2.13 from Tuesday. It is quickly followed by the 20-Day MA at 2.10. There is also the 50% retracement level at 2.07.
On the upside, natural gas has been rising following a -40.2% drop from the June 11 swing high of 3.16. That peak was a failed bullish breakout attempt above a prior trend line (blue dots). It remains on the chart only as an additional guide. The current advance has the potential to again attempt a breakout of the top trendline, which has been redrawn to account for the June 11 lower swing high. Therefore, the outlook for natural gas remains bullish.
Initial upside targets start with the 31.8% Fibonacci retracement at 2.37. Given the potential upside momentum it seems likely that this price level would be exceeded. The 50-Day MA is then at 2.40. Since the 20-Day MA was exceeded, the 50-Day line at 2.52 becomes the next moving average target, along with a previous pullback low at 2.475.
For a look at all of today’s economic events, check out our economic calendar.
* For commercial use only
Based on your interests
25% off until Sep 30th
Overview
7
Production
7
Countries
5
Trade
2
Companies
7
Consumption
5
Price
5
Further related statistics
17
* For commercial use only
Based on your interests
25% off until Sep 30th
World Bank. (April 25, 2024). Average prices for copper worldwide from 2014 to 2025 (in nominal U.S. dollars per metric ton) [Graph]. In Statista. Retrieved August 15, 2024, from https://www.statista.com/statistics/675854/average-prices-copper-worldwide/
World Bank. “Average prices for copper worldwide from 2014 to 2025 (in nominal U.S. dollars per metric ton).” Chart. April 25, 2024. Statista. Accessed August 15, 2024. https://www.statista.com/statistics/675854/average-prices-copper-worldwide/
World Bank. (2024). Average prices for copper worldwide from 2014 to 2025 (in nominal U.S. dollars per metric ton). Statista. Statista Inc.. Accessed: August 15, 2024. https://www.statista.com/statistics/675854/average-prices-copper-worldwide/
World Bank. “Average Prices for Copper Worldwide from 2014 to 2025 (in Nominal U.S. Dollars per Metric Ton).” Statista, Statista Inc., 25 Apr 2024, https://www.statista.com/statistics/675854/average-prices-copper-worldwide/
World Bank, Average prices for copper worldwide from 2014 to 2025 (in nominal U.S. dollars per metric ton) Statista, https://www.statista.com/statistics/675854/average-prices-copper-worldwide/ (last visited August 15, 2024)
Average prices for copper worldwide from 2014 to 2025 (in nominal U.S. dollars per metric ton) [Graph], World Bank, April 25, 2024. [Online]. Available: https://www.statista.com/statistics/675854/average-prices-copper-worldwide/
Important DisclaimersThe content provided on the website includes general news and publications, our personal analysis and opinions, and contents provided by third parties, which are intended for educational and research purposes only. It does not constitute, and should not be read as, any recommendation or advice to take any action whatsoever, including to make any investment or buy any product. When making any financial decision, you should perform your own due diligence checks, apply your own discretion and consult your competent advisors. The content of the website is not personally directed to you, and we does not take into account your financial situation or needs.The information contained in this website is not necessarily provided in real-time nor is it necessarily accurate. Prices provided herein may be provided by market makers and not by exchanges.Any trading or other financial decision you make shall be at your full responsibility, and you must not rely on any information provided through the website. FX Empire does not provide any warranty regarding any of the information contained in the website, and shall bear no responsibility for any trading losses you might incur as a result of using any information contained in the website.The website may include advertisements and other promotional contents, and FX Empire may receive compensation from third parties in connection with the content. FX Empire does not endorse any third party or recommends using any third party’s services, and does not assume responsibility for your use of any such third party’s website or services.FX Empire and its employees, officers, subsidiaries and associates, are not liable nor shall they be held liable for any loss or damage resulting from your use of the website or reliance on the information provided on this website.Risk DisclaimersThis website includes information about cryptocurrencies, contracts for difference (CFDs) and other financial instruments, and about brokers, exchanges and other entities trading in such instruments. Both cryptocurrencies and CFDs are complex instruments and come with a high risk of losing money. You should carefully consider whether you understand how these instruments work and whether you can afford to take the high risk of losing your money.FX Empire encourages you to perform your own research before making any investment decision, and to avoid investing in any financial instrument which you do not fully understand how it works and what are the risks involved.
Investors are closely monitoring the CPI figures for insights into future Federal Reserve policy. The Core CPI, which excludes volatile food and energy prices, is projected to rise by 0.2% month-over-month and 3.2% year-over-year. Concerns about the U.S. economy’s health have grown recently, with some market participants questioning whether the Fed should have already initiated rate cuts. As of Wednesday, traders were fully pricing in a rate cut in September, though opinions varied on its size.
The Federal Reserve, after its July meeting, left rates unchanged but hinted that a cut could be on the table depending on incoming economic data. The market’s current pricing reflects a 52.5% chance of a 50 basis point cut in September, according to the CME FedWatch Tool. U.S. Treasury yields, which tend to move inversely with gold prices, fell slightly on Wednesday as investors digested the implications of the upcoming CPI release.
Gold’s appeal as a safe-haven asset has been bolstered by ongoing tensions in the Middle East. Iran’s threat of retaliation following the death of a Hamas leader has heightened fears of a broader conflict, driving demand for gold. Any escalation in the region could push prices higher, with the potential for gold to reach new records if combined with dovish signals from the Federal Reserve.
Given the current market environment—characterized by expectations of a rate cut, moderating U.S. inflation, and persistent geopolitical risks—gold prices are likely to continue their upward trend. Traders should watch for a possible all-time high in the near term, particularly if the CPI data supports the case for a significant reduction in U.S. interest rates.