The main tag of Gold Price Articles.
You can use the search box below to find what you need.
[wd_asp id=1]
The main tag of Gold Price Articles.
You can use the search box below to find what you need.
[wd_asp id=1]
But you need a pullback at this point to find any value. Yes, short term momentum players may push this market higher. And yes, temperatures in America have been hotter than expected. But really, at the end of the day, natural gas is a completely abundant resource that is not hard to find. I actually live in an area that is flooded with natural gas.
So I know of what I speak, and therefore I never really trust these moves for anything more than a short term trade. Whether or not we can sustain the upward pressure remains to be seen, but right now I would not bet on it. What I am looking for is a pullback to take advantage of, and I’ll add my ETF position because as you know leverage in this market is very dangerous.
For a look at all of today’s economic events, check out our economic calendar.
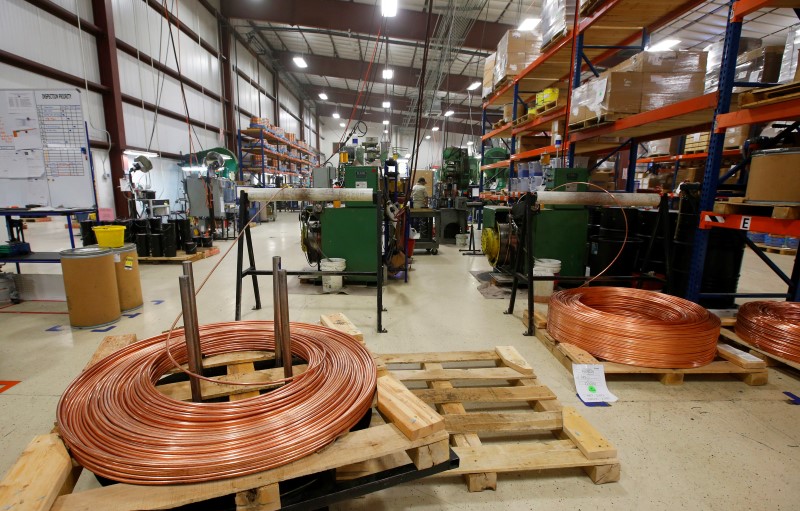
Following the recent rally, the spotlight is on , and analysts have been busy assessing their forecasts for copper prices, reflecting a complex set of factors from supply constraints and geopolitical factors to evolving demand trends in various sectors.
While copper prices slumped on Wednesday, the metal has experienced a significant rally over the past couple of months, with prices hitting record highs on Monday this week.
Copper, which is a vital industrial metal whose price movements have significant implications for global markets and industries, hit an intraday record of $5.1990 a pound or $11,460 a tonne. This year, copper is up 27%.
The rally was fueled in part by traders betting on a soft supply of the metal in the coming months as miners’ production cuts began to take effect.
Despite the rally, analysts at Citi believe the price of copper is set to consolidate over the next three to six months.
The bank’s forecast for a stabilisation in prices comes with LME prices currently trading close to their zero to three-month point price target of $10,500 a ton after reaching their six to 12-month target of $11k a ton last week.
Citi believes “investors have been right to push copper up from $8-8.5k/t to $10.5k/t over the past 3-4 months.”
However, they explained they think machines are likely a large share of the ~$30bn of copper fund length additions this year.
“In the coming months, some of this length is likely to turn over to consumer hedgers, along with macro and commodity-specific hedge funds, for whom we consider sub-$10k/t as inexpensive,” said Citi.”Indeed, physical indicators (such as visible inventories, spreads and premiums) aren’t going to look great for some time as China semi-fabricators de-stock refined metal and as global scrap dealers de-stock scrap.”
The current price levels are seen as sufficient to avoid huge deficits in the copper market this year as the scrap market responds.
Meanwhile, JPMorgan analysts believe pricing expectations are overshooting the fundamentals while copper stocks are currently trading at fair value.
“Copper has been on a tear thus far this year, rising 27% YTD amid what we view as relatively overdone refined supply-side concerns,” said JPMorgan. “This has translated into strong re-rating for copper-levered stocks FCX (+20% YTD) and TECK (+24%) with near-term investor sentiment now seemingly more bearish relative to the start of the year.”
“Pricing sentiment appears to have overshot underlying fundamentals, which are more sound than recent pricing momentum infers, largely driven by resilient China refined supply and seemingly elastic demand,” they add.
The bank also notes that the latest copper forward curve now exceeds both their base case and JPM’s Commodities team’s copper price forecast through the remainder of the year and into next year, suggesting further upside potential should bullish expectations materialize.
The minutes from the Federal Open Market Committee (FOMC) meeting on April 30-May 1 revealed heightened concerns about persistent inflation. Policymakers expressed uncertainty about when to start reducing interest rates, citing recent data showing inflation running well above the Fed’s 2% target. The minutes noted that while inflation had eased over the past year, there had been no further progress in recent months.
The FOMC’s minutes highlighted the possibility of additional tightening if inflation risks escalate. Some officials indicated a readiness to increase rates should inflationary pressures intensify. Despite this, key figures like Fed Chair Jerome Powell and Governor Christopher Waller suggested that further rate hikes are unlikely in the near term.
The committee unanimously voted to maintain the benchmark short-term borrowing rate at 5.25%-5.5%, the highest level since July 2023. Recent data shows incremental progress on inflation, with the April consumer price index at 3.4% annually, down slightly from March. Core CPI, excluding food and energy, was at 3.6%, the lowest since April 2021. Despite these improvements, consumer sentiment surveys, such as those from the University of Michigan and the New York Fed, reflect growing concern over economic conditions.
Fed officials acknowledged several upside risks to inflation, particularly from geopolitical factors. They also noted the financial strain on lower-income households, who are increasingly relying on credit cards and buy-now-pay-later services, leading to higher delinquency rates. The minutes underscored the importance of maintaining economic growth while managing inflation expectations.
Public statements from Fed officials since the meeting have been cautious. Governor Waller emphasized the need for consistent positive data before considering rate cuts. Chair Powell echoed the sentiment, stressing patience in letting restrictive policies take effect. Market expectations for rate cuts have adjusted, with futures pricing indicating a 60% chance of a rate cut in September, though the likelihood of a second cut in December has decreased to just over 50%.
Given the Fed’s stance on maintaining higher interest rates and ongoing inflation concerns, silver prices are likely to face continued downward pressure in the short term. Traders should monitor upcoming economic data and Fed communications for further insights into rate policy and its impact on silver markets.
The Federal Reserve’s minutes revealed that officials are not in a hurry to reduce rates. Several members even questioned if the current high rates were sufficient to curb inflation. The minutes noted that net long positions held by investors in gold were near their highest level in over three years, reflecting a lack of confidence that the Fed will cut rates more than once in 2024.
Despite acknowledging some uncertainty, Fed officials maintained their expectation that inflation would eventually return to the 2% target. They emphasized that disinflation could take longer than previously anticipated. The policy response, for now, involves keeping the Fed’s benchmark rate within the 5.25%-5.50% range, though officials expressed a willingness to tighten further if inflation risks materialize.
Following the minutes’ release, U.S. Treasury yields edged up, and traders reduced their bets on significant Fed rate cuts this year. The minutes indicated an emerging debate on the actual tightness of the current monetary policy, a crucial factor in determining how quickly inflation can be reduced to the 2% target. Some Fed officials have since downplayed the likelihood of imminent rate cuts, projecting a stable rate environment until at least September.
Physical demand for gold has remained strong since 2021. However, high prices may deter discretionary buying. Gold prices have increased by 14.5% this year, driven by a rally from March to May. In India, the world’s second-largest gold consumer, high prices could lead to a nearly 20% decline in imports in 2024, as consumers opt to exchange old jewelry instead of purchasing new items.
Given the Fed’s stance on maintaining higher interest rates for a prolonged period and the resulting profit-taking in the gold market, the short-term outlook for gold prices appears bearish. Traders should prepare for potential further declines as the market adjusts to the Fed’s policy signals and the ongoing uncertainty regarding inflation control.
Below, Fastmarkets senior analyst Andy Farida looks at London Metal Exchange copper price movements on May 17 and discussed in his report to subscribers if the bullish momentum will continue in the coming months or not.
Interested in a forward-looking view of the base metals market to boost your business strategy? Get a free sample of our base metals price forecast today.
A new all-time high for London Metal Exchange (LME) copper was well within reach on Friday, May 17, which confirms our overall bullish bias on the red metal. While we maintain this bullish view, we’re also mindful that the momentum is getting a tad frothy and this is a gentle reminder that nothing will move in a straight vertical line without some technical consolidation along the way.
To use a running analogy, when training for a marathon, stamina management and knowing when to let your body regulate are the key differences between an individual completing the marathon or struggling to reach the finish line.
As outlined in the LME copper weekly chart (see below), we are focusing on the price structure last seen in November 2010. This was when the copper price moved above the 2008 all-time high and then produced a sharp weekly pullback before resuming its upward tack to reach much higher prices.
We now think the copper space is overdue such a scenario, where profit taking and a mini shake out of weak longs will emerge. This could potentially last for the next two to four trading weeks and the dip at the end of the correction should attract dip-buying to enter the copper space again.

The bulls are in charge in LME copper and that supports the mainstream theory that a new all-time high is more a matter if when and not if.
If this bullish play continues – and assuming that copper’s price action resembles that of November 2010 – we can deduce that LME copper may not produce a sizeable pullback at all in May. Rather, it could a sharp, but very mild, correction as discussed above.
Instead, there is likely to be a run toward the 2022 all-time high first, with perhaps just the chance of a shallow pullback in May, but with a firm monthly close above $10,000 per tonne.
Going into June, the bullish momentum will continue from the latter half of the trading month, taking copper to another all-time high by August and/or tagging the upper blue channel at around $12,000 per tonne.
We now expect the bullish momentum in copper prices to be sustained over the coming months and view any technical pullback in May to June to be a temporary, but necessary, move for the bulls to regroup. We envisage that while the LME copper price will trade toward the record high seen in 2022, it will subsequently produce a technical pullback that could see the price of the red metal dip below $10,000 per tonne again. But it will be vital that the LME copper price does not produce a bearish monthly close of below $9,500 per tonne because that would negate the bullish narrative.
According to the latest data from the US Commodity Futures Trading Commission (CFTC), non-commercial traders raised their net long positions in CME copper by 4,720 contracts in the week ending May 7 to 62,176 contracts, representing 16% of the open interest. This was the fifth consecutive week of net buying.
The speculative community is not at +74% of its historical max net long position, compared to -4% of its historical max net short position at the start of the year, showing the clear reversal in the market sentiment/positioning.
Speculators are usually trend followers, suggesting that they will continue to add to their long positions as prices continue to rise. Conversely, if prices start to weaken, speculators would exit their positions, potentially intensifying the sell-off. We remain of the view that this scenario is plausible in May-June, especially after the remarkable rally in April.
LME fund managers were bullish on copper in the week to May 10 with the fresh buying of 4,207 lots. That was the sixth consecutive week of buying and brought LME copper’s net long fund position (NLFP) to a new all-time high of 63,589 lots. The bullish sentiment among funds corroborates this bullish price action and LME copper produced a positive weekly close above the key psychological price level of $10,000 per tonne in the week to May 17.
We remain firmly bullish on the red metal, but we are also mindful that the current rally is a tad overbought. We therefore envisage that the copper space could well do with a short-term mini shake out – a sharp correction for the next two to four trading weeks – and the dips buying will then resume again. We expect any pullback to be short-lived and that a resumption to the upside will be seen in the latter half of June, with a new all-time high of around $12,000 per tonne possibly logged by August this year.
All trades or trading strategies mentioned in the report are hypothetical and for illustration only and do not constitute trading recommendations.
Inform your base metals strategy with metals price forecasts and analysis for the global base metals industry. Get a free sample of our base metals price forecast today.
Technical indicators reveal that the candles have crossed below both the 50 EMA at $2,399.47 and the 200 EMA at $2,367.33, forming a bearish engulfing pattern, suggesting a bearish trend.
According to NatGasWeather, the southern third of the U.S. will remain very warm to hot over the next five days, with temperatures in the upper 80s and 90s, and even reaching 100s locally. The East will also experience warmth today, with highs in the mid-80s to lower 90s, contributing to strong national demand. However, the 6-15 day forecast period indicates cooler weather systems impacting much of the eastern U.S., including Texas, which could moderate demand.
The lead contractor for the Golden Pass LNG project, Zachry Holdings, filed for Chapter 11 bankruptcy protection on Tuesday. This $10 billion project, developed for QatarEnergy and Exxon Mobil, has faced cost challenges and disputes over funding. Exxon Mobil, holding a 30% stake in the project, stated it would review construction timing and provide updates in the future. The project is expected to significantly expand U.S. LNG exports once operational, but the bankruptcy filing has introduced uncertainty regarding its completion timeline.
The forecast for a particularly intense Atlantic hurricane season this year poses additional risks to the U.S. oil and natural gas industry. Meteorologists expect 20-25 named storms, with the possibility of over 30. These storms can disrupt crude oil production and refinery operations, especially in the Gulf of Mexico and along the Texas and Louisiana Gulf Coasts, which house almost half of U.S. refining capacity.
While hurricanes could reduce natural gas production in the Gulf of Mexico, the impact on the overall U.S. supply is expected to be minimal due to the region’s declining production share. However, LNG export operations could face interruptions, as seen with Hurricane Laura in 2020. The United States has substantial LNG export capacity located on the Gulf Coast, making it vulnerable to weather-related disruptions.
Given the current selling pressure, cooler weather forecasts, and potential delays in LNG project completions, natural gas prices are expected to remain under pressure in the short term. The upcoming hurricane season further adds to the bearish outlook, with potential production and export disruptions likely to weigh on market sentiment. Traders should remain cautious and monitor weather developments and project updates closely.
Gold is currently consolidating after a significant rally. Short-term potential for higher prices seems limited without additional support from the dollar. The market remains robust, with a buy-on-dip mentality prevailing among investors.
Minutes from the Fed’s May policy meeting are due at 18:00 GMT. Recent economic data indicates a downtrend in inflation, but Federal Reserve officials recommend waiting several more months before cutting rates. Higher interest rates increase the opportunity cost of holding gold, an asset traditionally viewed as an inflation hedge.
U.S. Treasury yields rose on Wednesday following comments from several Federal Reserve speakers. These officials emphasized patience, noting that inflation remains above the Fed’s 2% target. Fed Governor Christopher Waller stated the need for more data showing easing inflation and economic conditions before supporting rate cuts.
Investors are currently adjusting their rate cut expectations, with markets pricing in about 43 basis points of easing compared to last week’s 52 basis points. The PCE data due on May 31 will be crucial for confirming inflation trends. As traders await further Fed guidance, the market outlook for gold remains constructive, supported by ongoing central bank buying and cautious optimism for continued economic stability.
In the short term, gold prices are likely to remain under pressure as traders digest Fed minutes and economic data. However, the underlying demand from central banks and a potential easing of inflation could support a bullish outlook in the medium term. Traders should watch upcoming economic indicators and Fed comments closely for signs of policy shifts that could impact gold prices.
Silver price (XAG/USD) refreshes multi-year high at $30.50 in Friday’s New York session. The white metal strengthens on firm speculation that the Federal Reserve (Fed) will start reducing interest rates from the September meeting.
The confidence of investors for the Fed to begin lowering interest rates from September has strengthened as the United States Consumer Price Index (CPI) report for April has indicated that progress in the disinflation process has resumed after stalling in the January-March period. The scenario is favorable for non-yielding assets such as Silver but weighs on bond yields and the US Dollar.
The US Dollar Index (DXY), which tracks the Greenback’s value against six major currencies, retreats from the intraday high of 104.80.
In spite of an expected decline in the US inflation, Fed officials have maintained a hawkish guidance on interest rates. St. Louis Fed Bank President Loretta Mester said on Thursday inflation will take longer to reach the 2% target than what she previously thought.” She emphasized the need to accumulate more data to have a clearer picture of the inflation outlook.
Silver price has posted a fresh multi-year high at $30.55. Earlier, Silver price recovers sharply after discovering buying interest near the horizontal support plotted from 14 April 2023 high around $26.09 on a daily timeframe. The above-mentioned support was earlier a major resistance for the Silver price bulls. The white metal is approaching the multi-year high at $29.80.
The near-term outlook of Silver has improved as it returns above the 20-period Exponential Moving Average (EMA), which trades around $28.10.
The 14-period Relative Strength Index (RSI) shifts into the bullish range of 60.00-80.00, suggesting that a bullish momentum has been triggered.
You have reached your limit of 5 free articles for this month.
Access all our articles, insights, and analysts.
Your coupon code
Gold price is trading back and forth in a tight range above $2,400 early Wednesday, consolidating the previous losses. Gold traders await the Minutes of the US Federal Reserve (Fed) May policy meeting for fresh trading impetus.
Having kicked off the week on a positive, Gold price retreated from record highs of $2,450, now entering a phase of downside consolidation. Investors assess the implications of the recent cautious stance on inflation and interest rate outlooks, adopted by several Fed officials after April Consumer Price Index (CPI) data from the US fuelled rate cut expectations.
However, bets for aggressive Fed rate cuts this year trimmed significantly after several Fed policymakers this week, raised concerns about the sustainability of the disinflation trend, implying that rates are likely to remain higher for longer.
On Tuesday, Atlanta Federal Reserve President Raphael Bostic said that he is “expecting inflation to decline but relatively slowly, would not expect a rate cut before the fourth quarter.” Fed Governor Christopher Waller noted that he needs to see several more months of good inflation data before being comfortable to support an easing in policy.
In early Asia on Wednesday, Cleveland Fed President Mester said that keeping rates restrictive is not that concerning right now, given the strength of the jobs market. Meanwhile, Boston President Susan Collins said that “patience is the right policy for the Fed.”
The Fedspeak leaning in favor of maintaining a restrictive bias continues to keep Gold buyers on the back foot even though the US Dollar trades broadly subdued, tracking the directionless US Treasury bond yields.
Markets refrain from placing fresh directional bets on the US Dollar and the Gold price, anticipating a potential hawkish surprise from the upcoming Fed Minutes. In the lead-up to the FOMC Minutes, more Fedspeak and the mid-tier US Existing Home Sales data will entertain traders.
As observed on the daily chart, Gold price is traversing in a potential five-week-long rising wedge formation.
Meanwhile, the 14-day Relative Strength Index (RSI) has turned south but holds in the positive territory, currently near 64.50, suggesting that there is a good chance of a ‘dip-buying’ trade in Gold price.
However, Gold price needs to yield a daily closing above the upside barrier of the wedge at $2,450 to iniate a sustained uptrend. That level is the lifetime high for Gold price.
Recapturing the latter could expose the upside toward the $2,500 level.
However, if Gold buyers fail to regain lost momentum, a fresh drop toward the May 17 low of $2,374.
The next downside target is seen at $2,350, the confluence of the 21-day Simple Moving Average (SMA) and lower boundary of the potential rising wedge pattern.
The last line of defense of Gold buyers is seen at the 50-day SMA at $2,304.
Gold has played a key role in human’s history as it has been widely used as a store of value and medium of exchange. Currently, apart from its shine and usage for jewelry, the precious metal is widely seen as a safe-haven asset, meaning that it is considered a good investment during turbulent times. Gold is also widely seen as a hedge against inflation and against depreciating currencies as it doesn’t rely on any specific issuer or government.
Central banks are the biggest Gold holders. In their aim to support their currencies in turbulent times, central banks tend to diversify their reserves and buy Gold to improve the perceived strength of the economy and the currency. High Gold reserves can be a source of trust for a country’s solvency. Central banks added 1,136 tonnes of Gold worth around $70 billion to their reserves in 2022, according to data from the World Gold Council. This is the highest yearly purchase since records began. Central banks from emerging economies such as China, India and Turkey are quickly increasing their Gold reserves.
Gold has an inverse correlation with the US Dollar and US Treasuries, which are both major reserve and safe-haven assets. When the Dollar depreciates, Gold tends to rise, enabling investors and central banks to diversify their assets in turbulent times. Gold is also inversely correlated with risk assets. A rally in the stock market tends to weaken Gold price, while sell-offs in riskier markets tend to favor the precious metal.
The price can move due to a wide range of factors. Geopolitical instability or fears of a deep recession can quickly make Gold price escalate due to its safe-haven status. As a yield-less asset, Gold tends to rise with lower interest rates, while higher cost of money usually weighs down on the yellow metal. Still, most moves depend on how the US Dollar (USD) behaves as the asset is priced in dollars (XAU/USD). A strong Dollar tends to keep the price of Gold controlled, whereas a weaker Dollar is likely to push Gold prices up.
Gold price is trading back and forth in a tight range above $2,400 early Wednesday, consolidating the previous losses. Gold traders await the Minutes of the US Federal Reserve (Fed) May policy meeting for fresh trading impetus.
Having kicked off the week on a positive, Gold price retreated from record highs of $2,450, now entering a phase of downside consolidation. Investors assess the implications of the recent cautious stance on inflation and interest rate outlooks, adopted by several Fed officials after April Consumer Price Index (CPI) data from the US fuelled rate cut expectations.
However, bets for aggressive Fed rate cuts this year trimmed significantly after several Fed policymakers this week, raised concerns about the sustainability of the disinflation trend, implying that rates are likely to remain higher for longer.
On Tuesday, Atlanta Federal Reserve President Raphael Bostic said that he is “expecting inflation to decline but relatively slowly, would not expect a rate cut before the fourth quarter.” Fed Governor Christopher Waller noted that he needs to see several more months of good inflation data before being comfortable to support an easing in policy.
In early Asia on Wednesday, Cleveland Fed President Mester said that keeping rates restrictive is not that concerning right now, given the strength of the jobs market. Meanwhile, Boston President Susan Collins said that “patience is the right policy for the Fed.”
The Fedspeak leaning in favor of maintaining a restrictive bias continues to keep Gold buyers on the back foot even though the US Dollar trades broadly subdued, tracking the directionless US Treasury bond yields.
Markets refrain from placing fresh directional bets on the US Dollar and the Gold price, anticipating a potential hawkish surprise from the upcoming Fed Minutes. In the lead-up to the FOMC Minutes, more Fedspeak and the mid-tier US Existing Home Sales data will entertain traders.
As observed on the daily chart, Gold price is traversing in a potential five-week-long rising wedge formation.
Meanwhile, the 14-day Relative Strength Index (RSI) has turned south but holds in the positive territory, currently near 64.50, suggesting that there is a good chance of a ‘dip-buying’ trade in Gold price.
However, Gold price needs to yield a daily closing above the upside barrier of the wedge at $2,450 to iniate a sustained uptrend. That level is the lifetime high for Gold price.
Recapturing the latter could expose the upside toward the $2,500 level.
However, if Gold buyers fail to regain lost momentum, a fresh drop toward the May 17 low of $2,374.
The next downside target is seen at $2,350, the confluence of the 21-day Simple Moving Average (SMA) and lower boundary of the potential rising wedge pattern.
The last line of defense of Gold buyers is seen at the 50-day SMA at $2,304.
Gold has played a key role in human’s history as it has been widely used as a store of value and medium of exchange. Currently, apart from its shine and usage for jewelry, the precious metal is widely seen as a safe-haven asset, meaning that it is considered a good investment during turbulent times. Gold is also widely seen as a hedge against inflation and against depreciating currencies as it doesn’t rely on any specific issuer or government.
Central banks are the biggest Gold holders. In their aim to support their currencies in turbulent times, central banks tend to diversify their reserves and buy Gold to improve the perceived strength of the economy and the currency. High Gold reserves can be a source of trust for a country’s solvency. Central banks added 1,136 tonnes of Gold worth around $70 billion to their reserves in 2022, according to data from the World Gold Council. This is the highest yearly purchase since records began. Central banks from emerging economies such as China, India and Turkey are quickly increasing their Gold reserves.
Gold has an inverse correlation with the US Dollar and US Treasuries, which are both major reserve and safe-haven assets. When the Dollar depreciates, Gold tends to rise, enabling investors and central banks to diversify their assets in turbulent times. Gold is also inversely correlated with risk assets. A rally in the stock market tends to weaken Gold price, while sell-offs in riskier markets tend to favor the precious metal.
The price can move due to a wide range of factors. Geopolitical instability or fears of a deep recession can quickly make Gold price escalate due to its safe-haven status. As a yield-less asset, Gold tends to rise with lower interest rates, while higher cost of money usually weighs down on the yellow metal. Still, most moves depend on how the US Dollar (USD) behaves as the asset is priced in dollars (XAU/USD). A strong Dollar tends to keep the price of Gold controlled, whereas a weaker Dollar is likely to push Gold prices up.