The main tag of Gold Today Price Articles.
You can use the search box below to find what you need.
[wd_asp id=1]
The main tag of Gold Today Price Articles.
You can use the search box below to find what you need.
[wd_asp id=1]
Silver price ( XAG/USD) extends the decline to around $48.10 during the early Asian session on Wednesday. The white metal remains under pressure after facing its steepest sell-off in years in the previous session as traders locked in profits.
Silver tumbled more than 8% to mark its largest daily drop since 2021, amid concerns that the recent record high in the white metal left it overvalued. Additionally, easing trade tensions between the United States (US) and China lifts the US Dollar (USD) and undermines the USD-denominated commodity price.
US President Donald Trump last week threatened a new 100% tariff on China and suggested he would skip a meeting with Chinese President Xi Jinping to be held in South Korea later this month. Trump softened his stance over the weekend, saying that high tariffs on China are unsustainable, and expressed willingness for smoother relations with China. Trump late Tuesday noted that an upcoming meeting with his Chinese counterpart would yield a “good deal” on trade.
On the other hand, the ongoing US government shutdown, geopolitical risks and the expectation of the Federal Reserve (Fed) rate cuts could boost the safe-haven assets like Silver. The US federal government shutdown has entered its fourth week with no clear end in sight, marking the third-longest funding lapse in modern history. The GOP-backed bill failed to pass the Senate for the 11th time on Monday.
Traders are currently pricing in nearly a 99% possibility that the US central bank will cut interest rates again next week, followed by another reduction in December, according to the CME FedWatch tool. Lower interest rates could reduce the opportunity cost of holding Silver, supporting the non-yielding precious metal.
Silver is a precious metal highly traded among investors. It has been historically used as a store of value and a medium of exchange. Although less popular than Gold, traders may turn to Silver to diversify their investment portfolio, for its intrinsic value or as a potential hedge during high-inflation periods. Investors can buy physical Silver, in coins or in bars, or trade it through vehicles such as Exchange Traded Funds, which track its price on international markets.
Silver prices can move due to a wide range of factors. Geopolitical instability or fears of a deep recession can make Silver price escalate due to its safe-haven status, although to a lesser extent than Gold’s. As a yieldless asset, Silver tends to rise with lower interest rates. Its moves also depend on how the US Dollar (USD) behaves as the asset is priced in dollars (XAG/USD). A strong Dollar tends to keep the price of Silver at bay, whereas a weaker Dollar is likely to propel prices up. Other factors such as investment demand, mining supply – Silver is much more abundant than Gold – and recycling rates can also affect prices.
Silver is widely used in industry, particularly in sectors such as electronics or solar energy, as it has one of the highest electric conductivity of all metals – more than Copper and Gold. A surge in demand can increase prices, while a decline tends to lower them. Dynamics in the US, Chinese and Indian economies can also contribute to price swings: for the US and particularly China, their big industrial sectors use Silver in various processes; in India, consumers’ demand for the precious metal for jewellery also plays a key role in setting prices.
Silver prices tend to follow Gold’s moves. When Gold prices rise, Silver typically follows suit, as their status as safe-haven assets is similar. The Gold/Silver ratio, which shows the number of ounces of Silver needed to equal the value of one ounce of Gold, may help to determine the relative valuation between both metals. Some investors may consider a high ratio as an indicator that Silver is undervalued, or Gold is overvalued. On the contrary, a low ratio might suggest that Gold is undervalued relative to Silver.
Gold is attempting a recovery above the $4,100 mark early Wednesday, after having reversed a further sell-off to near the key $4,000 support. Gold buyers fight back control, awaiting fresh developments on the US-China trade front.
Gold is licking its wounds following the intense volatility witnessed so far this week.
Having lost over 5% on Tuesday, Gold gave away another $125 in the early Asian trading hours, but bargain hunters quickly jumped in at lower levels, driving the bright metal back to near $4,100 threshold.
Tuesday’s $230 correction was mainly due to profit-taking as the record-setting rally was overdone. Traders resorted to cashing in on their long positions amid easing US-China trade tensions as US President Donald Trump touted a fair deal with China when he meets his counterpart Xi Jinping in South Korea next week.
Meanwhile, markets also eagerly awaited the trade discussions between US Treasury Secretary Scott Bessent and Chinese Vice Premier He Lifeng in Malaysia to de-escalate the renewed trade tensions.
The sell-off in Gold was also sparked by an intense buying wave in the US Dollar (USD), courtesy of a sharp rally in the USD/JPY pair. The Japanese Yen (JPY) faced strong headwinds after Sanae Takaichi was elected as Japan’s Prime Minister. An expansionary era in Japan is likely to return, with Takaichi at the top, which weighed on the JPY while boosting USD/JPY.
Looking ahead, all eyes remain on fresh developments surrounding the US-China trade talks, with the US government shutdown still in place and a meeting between Trump and Russian President Vladimir Putin called off.
Gold tested the critical support in the area $4,007-$3,973, where the 21-day Simple Moving Average (SMA) and the 38.2% Fibonacci Retracement level of the parabolic rise from mid-August align.
Buyers need to recapture the 23.6% Fibo support-turned-resistance at $4,129 to sustain the rebound toward all-time highs of $4,382.
Ahead of that level, the $4,300 round figure needs to be taken out.
The 14-day Relative Strength Index (RSI) has paused its pullback from the extreme overbought zone to trade near 59, as of writing.
The leading indicator suggests that the longer-term bullish potential in Gold remains intact.
On the flip side, if the aforesaid confluence support zone at around $4,000 gives way, a steeper correction could unfold toward the 50% Fibo level at $3,847.
The line in the sand for Gold buyers is seen at the 61.8% Fibo, the Golden Ratio, at $3,722. The 50-day SMA coincides at that level, making it a powerful downside cap.
This marks the third test of the 200-day average this month, with prior attempts sparking a double top and bearish correction. Today’s high also stalled at the top parallel line of a small rising trend channel, extended 25% (dashed blue line). Resistance at this confluence isn’t surprising — momentum surged from the recent $2.89 swing low, but the lower high relative to October’s earlier peaks hints at potential fatigue. A brief pullback or consolidation would be healthy if buyers aim to hold the reins.
The 20-day moving average at $3.22 stands as key dynamic support if tested, but yesterday’s bullish conviction suggests buyers could avoid this level if they maintain control. Weakness would first show on a drop below today’s $3.36 low, challenging the rally’s staying power. The lower high at $3.50, paired with the significant resistance zone, leans bearish short-term unless momentum shifts.
A decisive rally and close above $3.50 would affirm the advance, but clearing the prior $3.55 swing low adds confidence. For a true bullish reversal, prices must surpass the $3.59 swing high, igniting a third upswing in the rising channel and signaling robust demand.
The $3.47-$3.50 zone is make-or-break—clear it for bullish confirmation, or falter for a pullback to $3.22. Watch today’s close: above $3.43 keeps buyers in play, but sub-$3.36 flags weakness. The channel and 200-day line hold the keys — sustained strength needs $3.59, or consolidation may cool this hot run.
For a look at all of today’s economic events, check out our economic calendar.
Front month copper traded at $4.94 and held up well in the rout in precious metals prices. Many copper miners (often because of associated gold production) were beaten up anyway.
Today, TD Cowen was out with a report highlighting a tightening market and they boosted their 2026 price to $5.25 from $4.40 previously. They also took up their long-term price to $4.50 from $4.25/lb.
The swing has been that trouble at several major mines has taken about 5% of global supply offline. The recent run-up in copper prices came after the mudslide at Grasberg.
On September 8th, Grasberg operations in Indonesia were subject to a
massive mudflow into the mine, causing a shutdown of operations and Freeport
declaring force majeure on its contracts. A subsequent announcement from Freeport
later in the month revealed preliminary impacts suggesting a production impact of
roughly 200kt and 270kt Cu in Q4/25 and 2026, respectively, from the world’s
second-largest copper mine (~3.4% total mined supply in 2024). Further disruptions
this year include the seismic event at Kamoa-Kakula (~200kt), ramp-up difficulties at
QB (~100kt), and El Teniente’s mine collapse (~48kt), which when combined represent
~2% of global supply.
Prices have been consolidating in the $4.90 to $5.20 range, which is near the top end of all-time highs.
Copper
Looking ahead, TD Cowen sees a 222kt deficit in 2026, which they warn could be conservative.
Longer term, lower production from mines entering mature stages of their mine life
along with the lack of greenfield investments imply that a larger copper price is
inevitable to incentivize development and support growing demand
So far this year, copper demand has been stronger than anticipated, with Wood Mackenzie now seeing 3.7% growth. The swing factor is often Chinese growth and that’s held up better than feared. In the years ahead, power generation/transmission, AI datacenters and greening the economy could be massive tailwinds.
Note that the US appears to be scrambling for copper supplies.
In terms of miners, TD’s top
picks include Lundin with buy ratings on Capstone, Ivanhoe and Teck along with top developer pick
Arizona Sonoran, where they are particularly bullish.
The value of gold dropped more than 5% on Tuesday, pacing what would be the largest single-day decline for the metal in more than a decade, leading a broader metal sell-off as investors appear to step back from a record-breaking buying frenzy.
Silver and platinum have joined gold with record-breaking rallies in recent months as investors seek out safer assets.
getty
Gold futures dropped 5.2% by Tuesday afternoon to around $4,130, paring back earlier losses after falling as much as 6.3%, marking the largest intraday drop for the metal since a 6.3% plunge in June 2013.
Futures for silver and platinum, which have risen 60% and 66% this year, respectively, outpacing gold (54%), have fallen 6.7% and 7.2%, respectively.
A sell-off for the metals is not unexpected as they have each surged this year, with investors now pulling back after earlier relying on them as safer assets, according to Standard Chartered analyst Suki Cooper, who said the market is experiencing a “technical correction” as the “universe of investors has expanded rapidly.”
Bart Melek, TD Securities’ global head of commodity strategy, told Bloomberg that precious metal dealers are “taking profits after a very robust rally,” noting recent rallies were historically unsustainable.
Gold prices also tend to fall as the U.S. dollar strengthens, making bullion expensive for investors overseas—the dollar index has risen 0.4% on Tuesday.
Bank of America analysts raised their price forecast for gold earlier this month, becoming the first major bank to give gold a $5,000 per ounce price target for 2026. HSBC, noting it remains bullish on the metal, gave a more conservative outlook last week after raising its average 2025 price target for gold to $3,950 from $3,125. Economists were previously bearish on gold’s value: JPMorgan in February set a $2,950 price target for the end of the year, while Citigroup and Goldman Sachs set $3,000 targets for year’s end and by the middle of 2026, respectively.
Bank of America similarly raised its price target for silver, lifting its outlook for the metal to $65 an ounce (it was trading at just under $48 on Tuesday afternoon). Analysts warned of possible risks for silver, however, indicating prices may become volatile as liquidity grows and demand falls, despite the metal remaining favored among investors. Goldman Sachs wrote last week it’s likely silver prices will continue to rise during a government shutdown and expectations of an interest rate cut from the Federal Reserve, which has signaled officials were divided over whether to lower rates two more times this year.
Metals have surged so far this year during periods of “elevated” economic and policy uncertainty, headlined by President Donald Trump’s widespread tariffs and growing inflation, according to Goldman Sachs analyst Lina Thompson. Hedge fund billionaire Ray Dalio has previously called on new investors to jump on gold and other precious metals while other assets, like equites, perform poorly during these periods, claiming metal is “the one asset that does very well.” Silver has climbed because inventory in the metal’s global trading hub, London, has disappeared this year, according to Greenland Investment Management’s Anant Jania, who told Bloomberg there is “no liquidity available currently.” Silver and gold are often tied together and are favored as safe-haven assets, but Goldman Sachs analysts said they expect “more volatility and downside risk” for silver than for gold, which is backed by demand from central banks. Platinum, while also viewed as a safer investment, has risen in value because of strong demand from jewelers and automakers, analysts said.
Silver (XAG/USD) is finally correcting lower. Market expectations that the US and China will de-escalate trade tensions are boosting the US Dollar’s recovery and hurting precious metals. Silver has extended its reversal from last week’s highs at the $55.00 area, to session lows near $49.00 so far.
US President Trump soothed markets on Monday, announcing that he was planning to meet his Chinese counterpart Xi Jinping next week, and that he expected to reach a “fair deal” which would lead to a good trade relationship between the two countries. These comments tackled fears of a trade war and have sent the US Dollar rallying across the board.
Silver has broken below the base of the ascending channel from mid-September lows and extended losses below the neckline of a bearish Head & Shoulders, a common figure in trend shifts, at the $50.71 area.
The pair is attempting to return above the $50.00 psychological level at the time of writing, and is likely to retest the mentioned H&S neckline, which might act as a resistance now, at the 50.80 area. Further up, the target would be the reverse trendline, near 52.10.
To the downside, intra-day lows are at $49.20 ahead of the October 9 low, at $48.45. The H&S pattern’s measured target is coincident with the 61.8% Fibonacci retracement of the September-October rally, at $46.15.
Silver is a precious metal highly traded among investors. It has been historically used as a store of value and a medium of exchange. Although less popular than Gold, traders may turn to Silver to diversify their investment portfolio, for its intrinsic value or as a potential hedge during high-inflation periods. Investors can buy physical Silver, in coins or in bars, or trade it through vehicles such as Exchange Traded Funds, which track its price on international markets.
Silver prices can move due to a wide range of factors. Geopolitical instability or fears of a deep recession can make Silver price escalate due to its safe-haven status, although to a lesser extent than Gold’s. As a yieldless asset, Silver tends to rise with lower interest rates. Its moves also depend on how the US Dollar (USD) behaves as the asset is priced in dollars (XAG/USD). A strong Dollar tends to keep the price of Silver at bay, whereas a weaker Dollar is likely to propel prices up. Other factors such as investment demand, mining supply – Silver is much more abundant than Gold – and recycling rates can also affect prices.
Silver is widely used in industry, particularly in sectors such as electronics or solar energy, as it has one of the highest electric conductivity of all metals – more than Copper and Gold. A surge in demand can increase prices, while a decline tends to lower them. Dynamics in the US, Chinese and Indian economies can also contribute to price swings: for the US and particularly China, their big industrial sectors use Silver in various processes; in India, consumers’ demand for the precious metal for jewellery also plays a key role in setting prices.
Silver prices tend to follow Gold’s moves. When Gold prices rise, Silver typically follows suit, as their status as safe-haven assets is similar. The Gold/Silver ratio, which shows the number of ounces of Silver needed to equal the value of one ounce of Gold, may help to determine the relative valuation between both metals. Some investors may consider a high ratio as an indicator that Silver is undervalued, or Gold is overvalued. On the contrary, a low ratio might suggest that Gold is undervalued relative to Silver.
Spot Gold plunged on Tuesday amid a better market mood and resurgent US Dollar (USD) demand. The XAU/USD pair fell towards $4,080 before bouncing to the current $4,110 level, holding on to substantial losses in the American afternoon.
The market sentiment improved after the United States (US) President Donald Trump made some optimistic comments about a potential trade deal with China, ahead of an economic conference in South Korea next week, when he will likely meet his Chinese counterpart, Xi Jinping. Global equities reflect the latest optimism, with most global indexes trading in the green.
On a negative note, the US government shutdown continues. The US Senate voted again on Monday on potential funding bills, rejecting both the Democratic and the Republican proposals, though market participants seem unconcerned.
The notorious absence of US macroeconomic data will be broken on Friday, when the Bureau of Labor Statistics will release September Consumer Price Index (CPI) data. The reading is critical ahead of the Federal Reserve (Fed) monetary policy meeting next week.
The daily chart for the XAU/USD pair shows that the sharp decline could be seen as a corrective move. Technical indicators head south almost vertically, but remain within positive levels and erased extreme overbought conditions. At the same time, the pair keeps developing far above all bullish moving averages, with the 20 Simple Moving Average (SMA) currently at $4,001.20.
The near-term technical picture suggests XAU/USD may not be done correcting lower. The pair is currently developing far below its 20 SMA, which turned lower. The 100 and 200 SMAs maintain their bullish slopes below the current level, with the shorter one currently at $4,043. Finally, technical indicators approach oversold readings without signs of giving up and retaining their strong downward momentum.
Support levels: 4,105.10 4,081.70 4,065.90
Resistance levels: 4,134.45 4,148.30 4,162.60
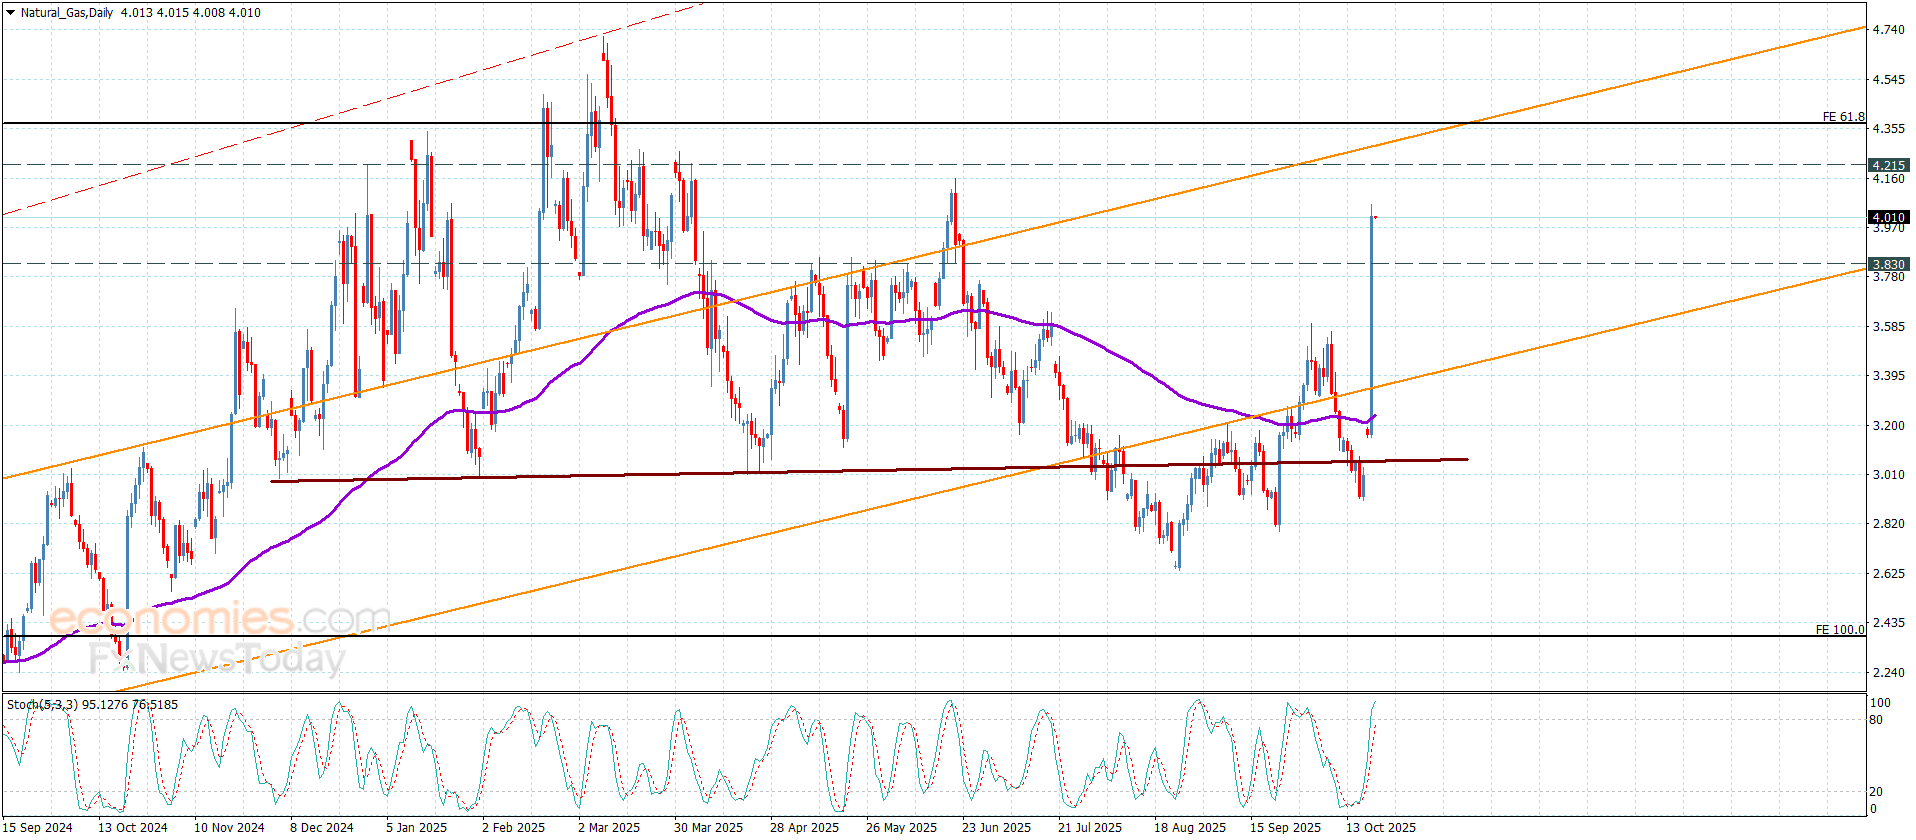
Natural gas price affected by the economic data, forming strong bullish rally yesterday, surpassing the resistance at $3.350 then recording big gains by reaching $4.060, to settle above $3.830 level, which forms a new support against the bullish trading.
Providing positive momentum by the main indicators will increase the strength of the bullish track, to expect resuming the bullish attack, to target $4.150 level reaching the next resistance near $4.280.
The expected trading range for today is between $3.900 and $4.150
Trend forecast: Bullish
Platinum price reached $1557.00 level in its last corrective decline, then rallies again to settle above the extra support level at $1605.00, but this will not confirm its readiness to activate the bullish track again, due to its fluctuation below the resistance at $1695.00.
The continuation of providing negative momentum by stochastic will increase the efficiency of the bearish corrective track, to expect reaching $1575.00 and facing extra pressure might force it to target $1525.00 level, which forms an extra support against the current trading.
The expected trading range for today is between $1575.00 and $1670.00
Trend forecast: Bearish
Silver has entered a tension-filled holding pattern — not weak, just waiting for ignition.
After rallying to $54/oz, its highest in more than a decade, the market is now consolidating just below that level, mirroring gold’s earlier pattern before its own explosive breakout.
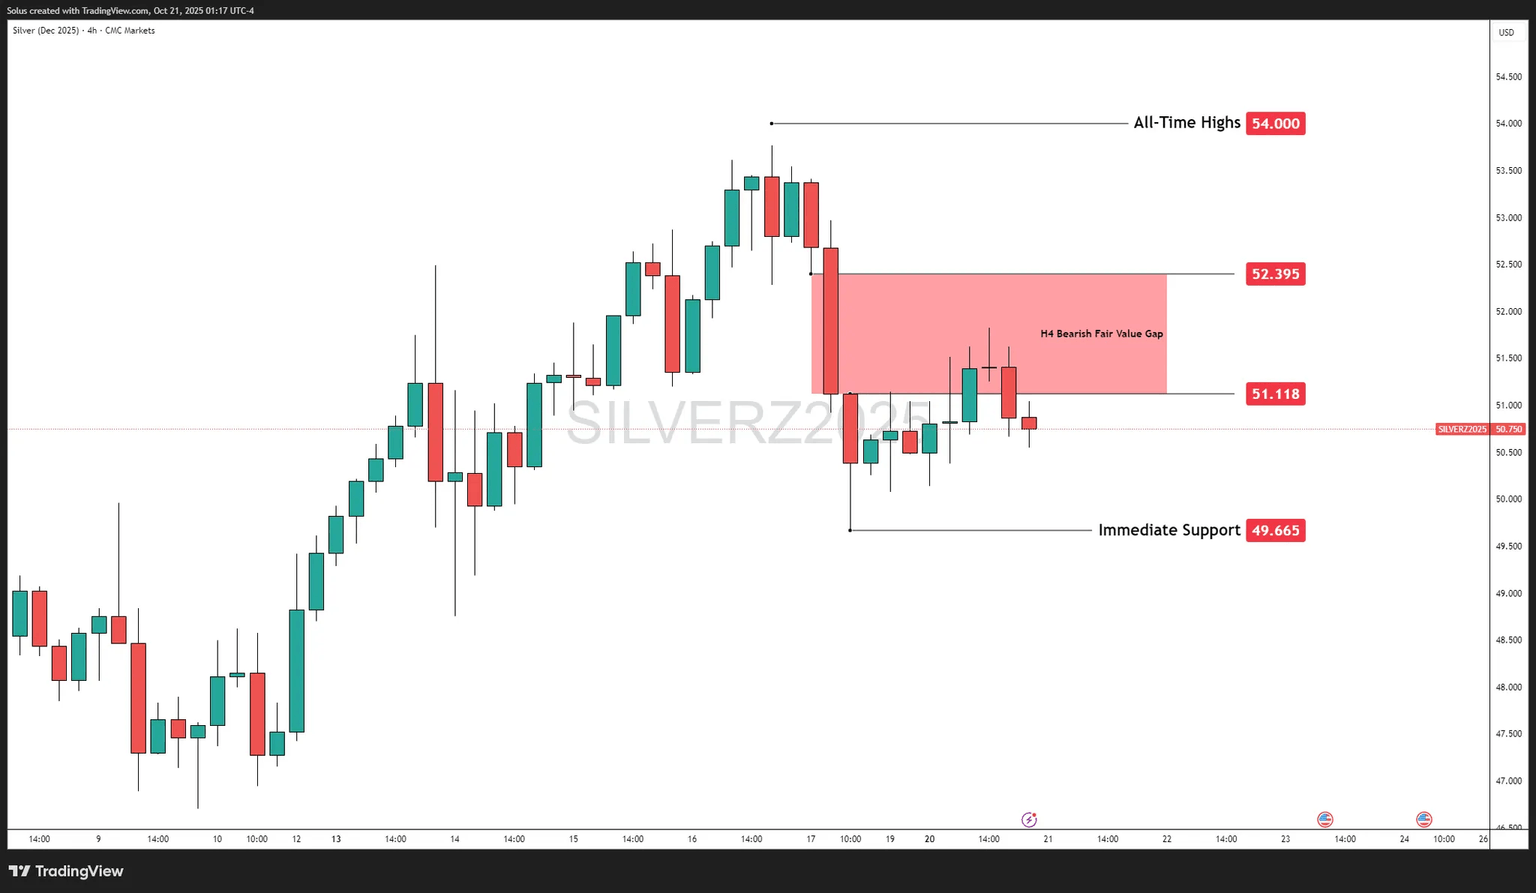
The reason? The metal is balancing order flow inside a critical 4-hour Fair Value Gap (FVG) between $51.118–$52.395 — a zone where prior selling created inefficiency.
Price currently sits at $50.75, testing buyers’ commitment as volume compresses and liquidity builds.
This “pause before propulsion” could define silver’s next major phase — and traders are watching whether it repeats gold’s parabolic move.
Silver’s dual role — industrial metal and monetary hedge — keeps it in demand. The solar and EV sectors continue to consume record levels of silver, straining mine output in Mexico, Peru, and China.
Physical silver inventories at London and COMEX remain near multi-year lows, forcing refiners to reroute supply from Asia. This supply squeeze underpins the spot premium and keeps futures backwardated.
With the U.S. shutdown dragging on and investors bracing for further Fed cuts, funds are once again rotating into metals. As gold flirts with $4,500, silver is attracting renewed speculative inflows aiming to catch “the next gold-style breakout.”
Silver’s structure remains constructively bullish, though tactically neutral within the current balance.
The 4-hour volume imbalance ($51.118–$52.395) acts as the pivot — a zone where supply met demand but delivery remains unfinished.
Price is compressing between this imbalance and immediate support at $49.665.
When that compression breaks, momentum should accelerate sharply.
|
Type |
Price Zone |
Technical Role |
|---|---|---|
|
All-Time High |
$54.000 |
Liquidity target |
|
H4 Volume Imbalance (FVG) |
$51.118 – $52.395 |
Control zone / re-pricing area |
|
Immediate Support |
$49.665 |
Short-term liquidity base |
|
Bullish Targets |
$53 → $54 → $55 |
Expansion levels |
|
Bearish Targets |
$49.00 → $47.80 |
Re-pricing zones |
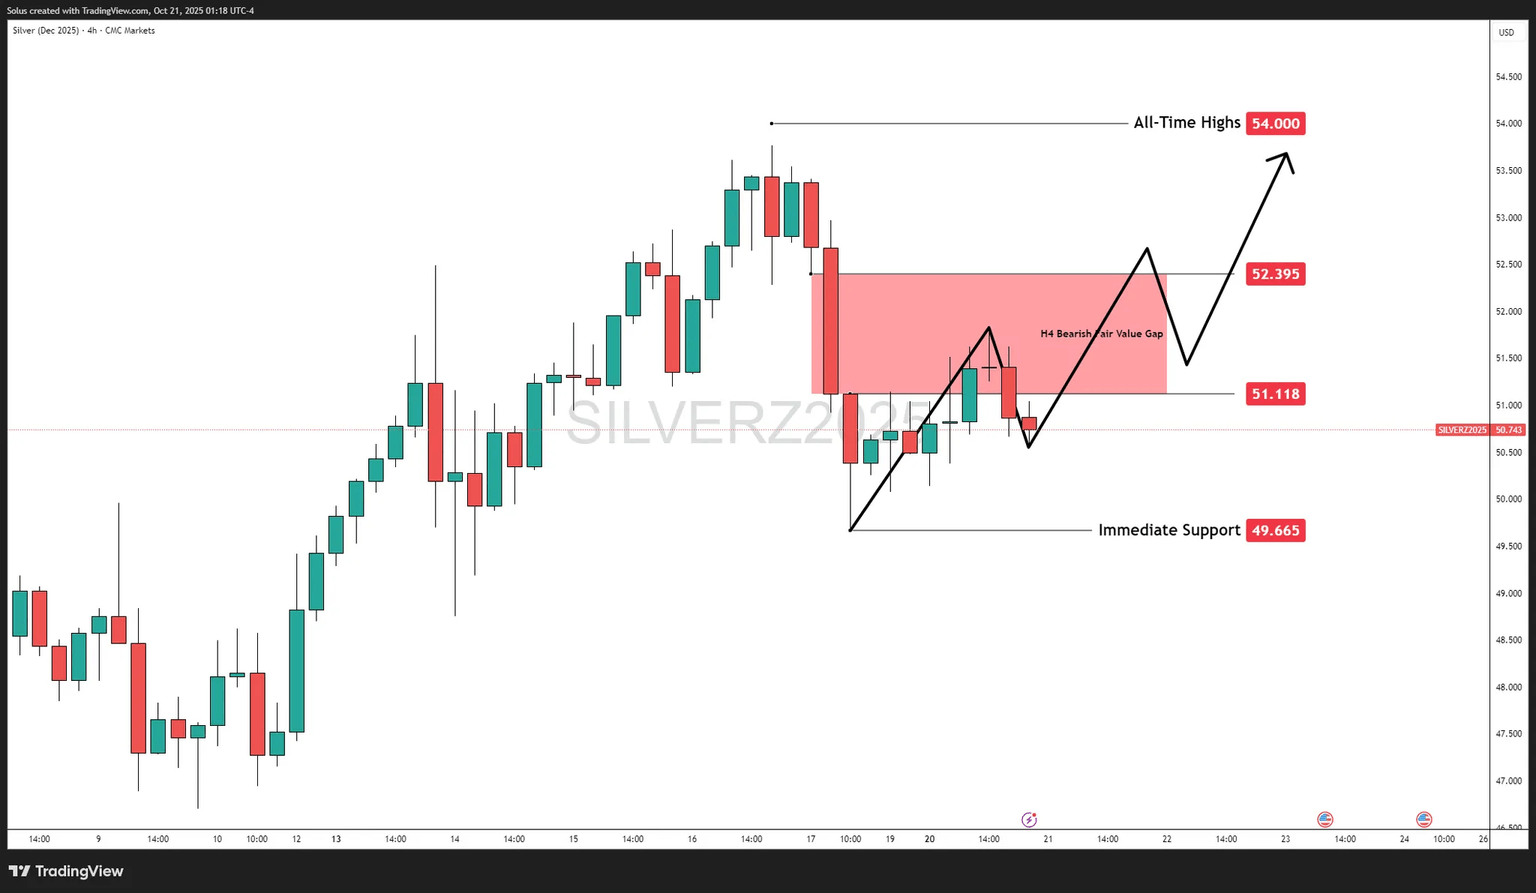
Silver’s repeated defense of $50–$50.70 shows buy-side absorption.
If price reclaims $51.118, it signals demand stepping back into imbalance territory.
Trigger:
A 4H close above $51.118 followed by a break through $52.395 confirms that sellers’ inefficiency has been filled and flipped to support.
Targets:
Narrative:
This would mark a bullish re-balancing of volume, restoring buy-side delivery similar to gold’s prior structure.
A successful FVG reclaim transforms the zone into demand — often the prelude to a sustained breakout.
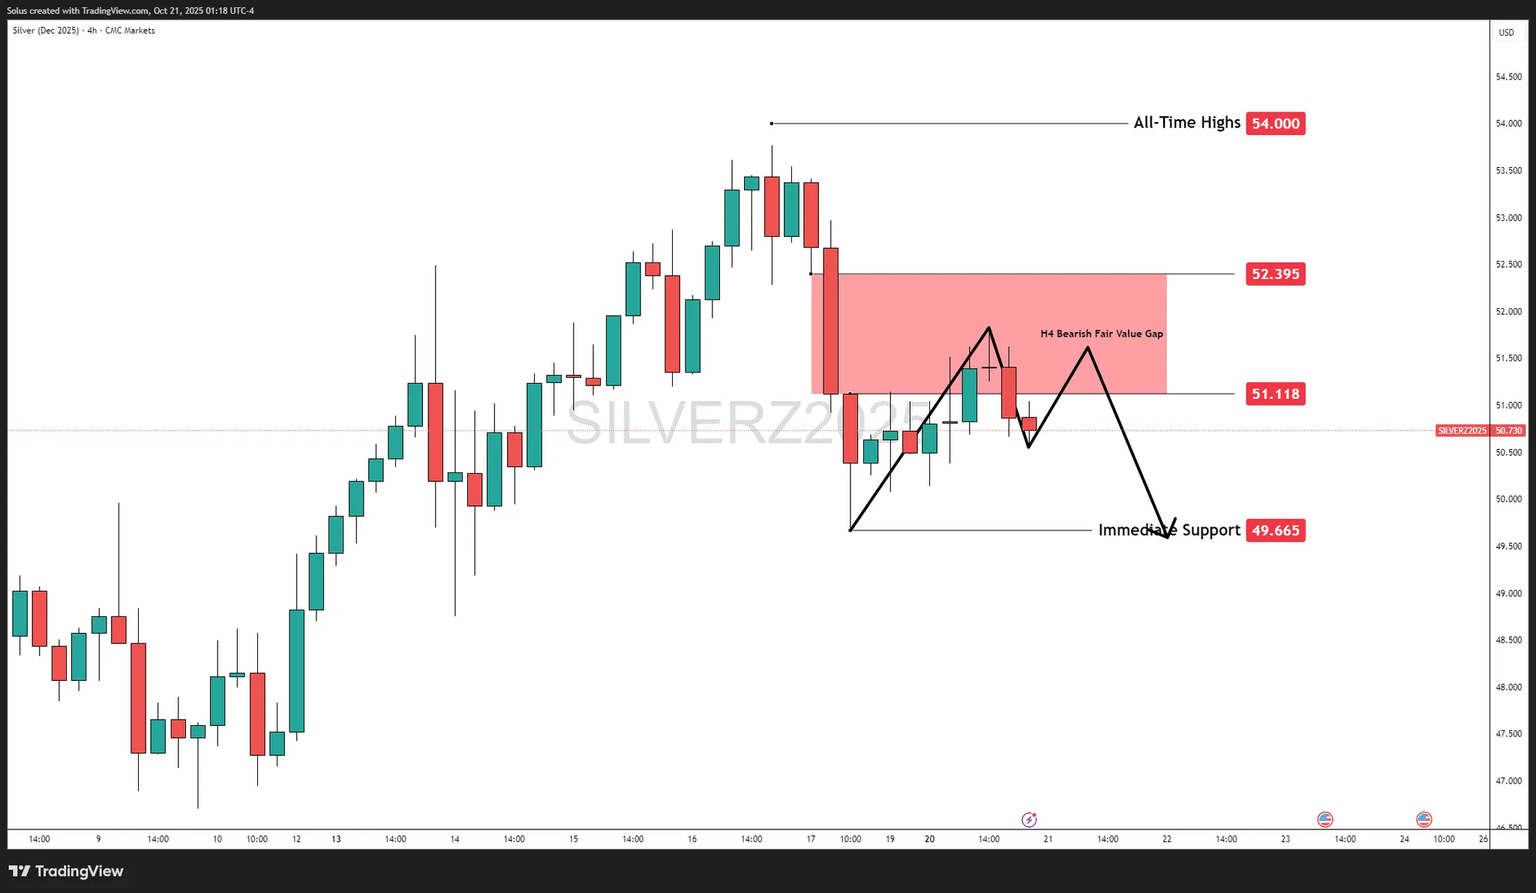
Failure to close above $52.395 or repeated rejections inside the FVG suggest sellers are still defending overhead liquidity.
Trigger:
A 4H close below $50.60 signals renewed sell-side control and continuation toward liquidity resting below $49.60.
Targets:
Narrative:
As long as $51.118 remains unclaimed, the imbalance stays bearish.
Price could slide into discount levels before rebuilding another leg higher.
The $51.118–$52.395 zone is the line in the sand.
Volume is evenly balanced — neither bulls nor bears hold control — but this balance is unstable.
This equilibrium reflects a coiled-spring structure: energy building beneath resistance, similar to gold’s pre-breakout profile earlier this quarter.
Silver is standing at a technical crossroads that echoes gold’s structure weeks ago — tight compression, rising demand, and a visible imbalance zone waiting to break.
Reclaiming $52.395 could unleash a fast leg toward $54–$55, validating the idea that silver is becoming “the next gold.”
Failing to do so simply extends the accumulation window around $50–$49, where long-term buyers likely reload for the next wave.