The main tag of Gold Today Price Articles.
You can use the search box below to find what you need.
[wd_asp id=1]
The main tag of Gold Today Price Articles.
You can use the search box below to find what you need.
[wd_asp id=1]
Traders pulled risk off the table following a cooler shift in U.S. weather models. While much of the southern two-thirds of the country remains hot, with highs in the 90s and low 100s, updated GFS and EC models showed a net reduction of five cooling degree days (CDDs) over the weekend.
Temperatures in the Northeast and Midwest are now expected to moderate from late July into early August, with Vaisala projecting an active storm track that could cap cooling demand during July 31–August 4.
Another pressure point for prices is the ongoing softness in LNG exports. U.S. LNG net flows on Monday totaled 14.9 bcf/day, down 4.9% week-on-week, according to BNEF. This drop coincides with signs of stronger supply. U.S. dry gas production reached 107.4 bcf/day to start the week—up 4.8% year-on-year—while rig activity hit a 17-month high of 117, per Baker Hughes.
Last week’s EIA storage report added to the bearish tone. Inventories rose by 46 bcf for the week ending July 11, slightly above consensus and the five-year average of +41 bcf. U.S. gas inventories now sit 6.2% above their five-year seasonal average, despite being 4.9% lower year-on-year.
Meanwhile, electricity demand offers limited support: U.S. power output rose just 1.1% y/y in the latest weekly report, a modest lift relative to expectations for peak summer cooling demand.
Natural gas price settled on slight gain in its last intraday trading, attempting to recover some of its previous losses, and it attempts to offload some of its clear oversold conditions on the (RSI), especially with the beginning of the emergence of the positive signals, amid the dominance of the main bearish trend on the short-term, and its affection by exiting bullish correctional channel’s range on the short-term basis, with the continuation of the negative pressure due to its trading below EMA50.
Therefore, our expectations suggest natural gas price decline in its upcoming intraday trading, if the resistance settles at $3.40, to target the initial support level at 43.25 preparing to break it.
The expected trading range for today is between $3.20 and $3.40
Trend forecast: Bearish
High-Accuracy Trading Signals – Provided by BestTradingSignal.com
Subscribe now to professional, carefully structured packages covering major global markets. Receive signals directly via Telegram from our expert team.
The longer your subscription, the bigger the discount and the better the rate.
See the full results here: Trading Signal Results by BestTradingSignal.com; Week of July 14–18, 2025
Silver (XAG/USD) starts the week on firmer ground after a mild pullback last week. As of now, the metal is trading near $38.50 during the early American trading hours on Monday, just shy of the multi-year high of $39.13 set on July 14. Although the recent rally has lost some momentum, technical indicators are turning bullish again across both short-term and longer-term charts.
The rebound is also supported by a softer US Dollar, which is trading under pressure on Monday amid easing Treasury yields and cautious risk sentiment.
On the hourly chart, Silver is showing signs of renewed strength after forming a local bottom near $37.50, following a break above a descending trendline. The spot price now holds above both the 50- and 21-period Exponential Moving Averages (EMAs). Both moving averages are sloping slightly upward and acting as dynamic intraday support, indicating fresh buying interest.
Momentum is also firming up. The Relative Strength Index (RSI) has climbed into the overbought zone near 70, reflecting strong bullish momentum. While slightly stretched, the setup remains constructive as long as the RSI holds above 60. Meanwhile, the Average Directional Index (ADX) is pointing north currently at 20, hinting at a possible strengthening in trend momentum. However, a confirmed breakout above the $38.80-$39.00 resistance band could quickly ignite a stronger directional push.
Key short-term levels:
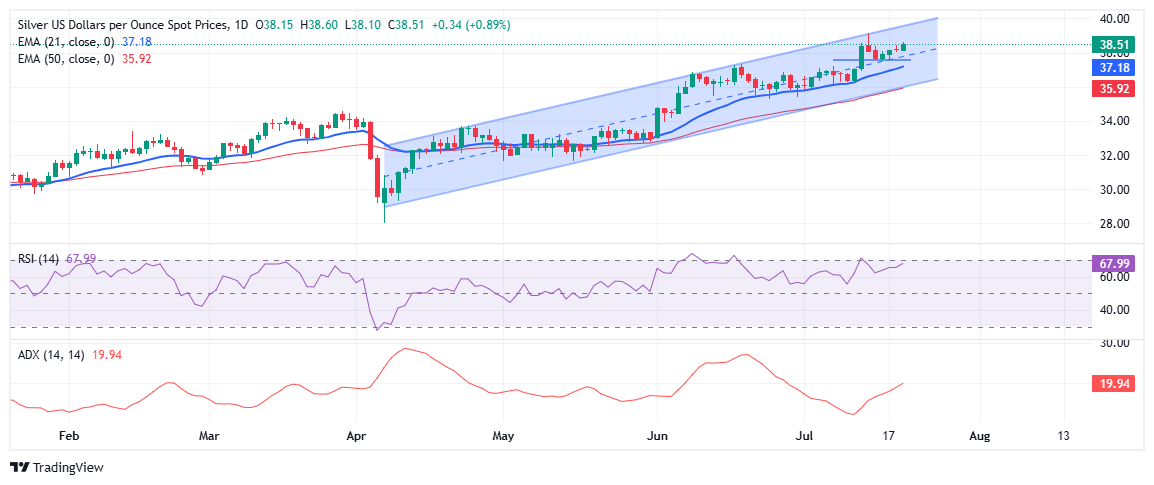
Zooming out to the daily chart, Silver remains firmly embedded in an uptrend, supported by a clearly defined ascending channel that has held since early April. The recent rally to $39.13 shows strong buying interest in Silver, supported by ongoing economic uncertainty and global tensions.
Despite last week’s modest pullback from multi-year highs, the broader structure remains intact. Silver continues to trade comfortably above the 21-day EMA at $37.18 and the 50-day EMA at $35.92—both serving as solid dynamic support and aligning with the lower boundary of the rising channel.
The RSI is nearing the overbought level, currently at 68, indicating buyers are gaining strength. Meanwhile, the ADX has increased to 20.00, showing that the trend is in its early stages. As long as Silver holds above the $37.00-$37.50 region, the broader bullish bias remains intact. A decisive breakout above $39.13 could pave the way for a run toward the key psychological barrier at $40.00.
Silver is a precious metal highly traded among investors. It has been historically used as a store of value and a medium of exchange. Although less popular than Gold, traders may turn to Silver to diversify their investment portfolio, for its intrinsic value or as a potential hedge during high-inflation periods. Investors can buy physical Silver, in coins or in bars, or trade it through vehicles such as Exchange Traded Funds, which track its price on international markets.
Silver prices can move due to a wide range of factors. Geopolitical instability or fears of a deep recession can make Silver price escalate due to its safe-haven status, although to a lesser extent than Gold’s. As a yieldless asset, Silver tends to rise with lower interest rates. Its moves also depend on how the US Dollar (USD) behaves as the asset is priced in dollars (XAG/USD). A strong Dollar tends to keep the price of Silver at bay, whereas a weaker Dollar is likely to propel prices up. Other factors such as investment demand, mining supply – Silver is much more abundant than Gold – and recycling rates can also affect prices.
Silver is widely used in industry, particularly in sectors such as electronics or solar energy, as it has one of the highest electric conductivity of all metals – more than Copper and Gold. A surge in demand can increase prices, while a decline tends to lower them. Dynamics in the US, Chinese and Indian economies can also contribute to price swings: for the US and particularly China, their big industrial sectors use Silver in various processes; in India, consumers’ demand for the precious metal for jewellery also plays a key role in setting prices.
Silver prices tend to follow Gold’s moves. When Gold prices rise, Silver typically follows suit, as their status as safe-haven assets is similar. The Gold/Silver ratio, which shows the number of ounces of Silver needed to equal the value of one ounce of Gold, may help to determine the relative valuation between both metals. Some investors may consider a high ratio as an indicator that Silver is undervalued, or Gold is overvalued. On the contrary, a low ratio might suggest that Gold is undervalued relative to Silver.
Spot Gold surged in the European session Monday, flirting with the $3,400 level after Wall Street’s opening. The strong momentum in the bright metal comes from the broad US Dollar’s (USD) weakness, as the American currency keeps suffering from fiscal and political woes.
Trade-related tensions took centre stage in the absence of relevant data, with the focus particularly in negotiations between the United States (US) and the European Union (EU). Undergoing negotiations between the two economies is not enough to pause threats and retaliatory measures announcements. On the one hand, the White House noted that the deadline, set for August 1, will not be changed, while a base tariffs could be set at 30%. The EU, in the meantime, announced it’s studying retaliatory levies, should the US moves forward.
Other than that, Republican House Anna Paulina Luna is referring Federal Reserve (Fed) Chairman Jerome Powell to the Department of Justice (DOJ) for criminal charges, accusing him of perjury on two occasions. Additionally, Treasury Secretary Scott Bessent proposed a review of the whole Fed. “What we need to do is examine the entire Federal Reserve institution and whether they have been successful,” Bessent said on Monday.
The daily chart for the XAU/USD pair shows it largely recovered above the 61.8% Fibonacci retracement of the $3,452.51 – $3,247.83 at around $3,374, opening the door for a recovery towards the top of the range. The same chart shows the pair is well above a now flat 20 Simple Moving Average (SMA), which consolidates at around $3,330, while the 100 SMA maintains its form bullish slope far below the shorter one, in line with the dominant bullish trend. Finally, technical indicators remain within positive levels with uneven upward strength, yet still suggesting higher highs ahead.
The near-term picture is supportive of another leg north, as technical indicators in the 4-hour chart reached overbought readings. The Momentum indicator maintains its almost vertical slope, while the Relative Strength Index (RSI) indicator decelerated, but keeps aiming north at around 71. At the same time, XAU/USD is far above all its moving averages, with the 100 and 200 SMA lacking directional strength, but the 20 SMA heading higher above the longer ones, skewing the risk to the upside.
Support levels: 3,390.10 3,374.50 3,350.00
Resistance levels: 3,403.20 3,417.90 3,430.35
The higher timeframe monthly chart has also turned bearish. Last week a bearish shooting star candlestick pattern triggered on the monthly chart. Given today’s bearish price action, it needs to be considered as the longer-term patterns influence the shorter. However, it is not just the one-month breakdown that is of concern. A bullish breakout of an inside month triggered the month before in June. Therefore, this month’s breakdown is also a failure of the bullish signal the month before. Failed breakouts can result in sharp moves in the opposite direction. Nonetheless, it indicates downside pressure on the price of natural gas.
For perspective, a bearish measured move (light blue) was added to the current downswing on the chart. It matches part of the prior bearish correction that began following the March trend high on a percentage basis. Moreover, the bearish correction prior to March completed after a 31.6% decline in the price of natural gas. Interestingly, the target from that measured move matches a 78.6% Fibonacci retracement level at $2.80. But for that level to be reached higher and potentially significant support would need to be broken.
If the interim May swing low at $3.10 is broken, the next lower target zone becomes more likely to be reached. That low is also a monthly low from May. There are two dynamic support lines of significance. A long-term rising trendline is in purple, and it connects to the August 2024 swing low. It represents the lower boundary area of a long-term rising trend channel.
Earlier this year resistance was seen on several occasions around the top channel line. Once there is a reversal from one side of a pattern, there is a possibility that price eventually reaches the other side. Given the second break below an internal uptrend line today, that lower line comes into focus. In addition, there is AVWAP line that is close to converging with the uptrend line.
For a look at all of today’s economic events, check out our economic calendar.
Dow Inc. (DOW) stock declined in its latest intraday trading, following a rebound from resistance at the 50-day SMA. The stock remains under the control of a prevailing downtrend, trading along a short-term descending trendline. However, a potential bullish crossover in the Relative Strength Index is beginning to emerge, which may help limit further losses.
Therefore we expect the stock to decline in upcoming sessions, as long as resistance at $31.00 holds, targeting the key support level at $25.00.
Today’s price forecast: Bearish.
Technically, the market is now testing the 50% retracement of its short-term range ($3.149 to $3.629) at $3.389. A sustained move below this key level would likely signal additional downside momentum and embolden bearish traders. For now, price action suggests a near-term correction rather than a structural breakdown, but much hinges on whether bulls defend this support area.
Supply remains robust, and with wind generation expected to remain light, gas-fired power demand is elevated. Still, the modest step back in heat intensity and the market’s inability to punch through long-term moving averages point to traders being wary of chasing higher prices, especially ahead of updated EIA storage data and further weather model revisions later in the week.
Given the inability to clear overhead resistance and the bearish revision in weekend weather forecasts, the near-term outlook for U.S. natural gas leans bearish. A decisive move below $3.389 would confirm downside momentum, potentially drawing prices back toward $3.30. Traders should watch for further updates to heat forecasts and monitor how the market reacts to the current support zone in the coming sessions.
More Information in our Economic Calendar.
Gold price is extending the turnaround from six-day lows of $3,310 early Monday, making another attempt above the $3,350 barrier.
Gold buyers keep the upper hand as the US Dollar (USD) pauses its late rebound on Friday, entering a consolidative mode, with attention turning to Tuesday’s speech by US Federal Reserve (Fed) Chairman Jerome Powell for further trading impetus.
Monday’s data-docket is a quiet one, and hence, tariff-related developments will continue to dominate the sentiment around the USD-denominated Gold price.
Traders remain expectant of encouraging earnings reports from American tech giants, including Alphabet Inc., due later this week.
Despite a mild optimism, investors remain wary about US President Donald Trump’s tariff plans against the European Union (EU) as the August 1 deadline approaches.
US Commerce Secretary Howard Lutnick said Friday that he is still confident a deal could be reached with the EU.
The Financial Times (FT) late Friday reported three people briefed on the talks as saying that Trump is eyeing at least a minimum tariff of 15% to 20% in a deal with the EU.
Meanwhile, the Wall Street Journal (WSJ) quoted some sources reporting on Monday that “US officials have informed the EU’s trade chief that President Trump is likely to demand further concessions in ongoing trade talks, including a higher baseline tariff of 15% or more on most European goods, a significant increase from the previously discussed 10%.”
In response, the bloc warned of strong retaliation if no deal is reached with the US by August 1, per the WSJ.
Lingering tariff tensions bode well for the traditional safe-haven Gold price as markets digest the Japanese political drama.
The Japanese ruling coalition, the Liberal Democratic Party (LDP) and its ally Komeito, lost control of the upper house in an election on Sunday, further weakening Prime Minister Shigeru Ishiba’s hold as a tariff deadline looms, Reuters reports.
The Japanese Yen (JPY) experienced ‘buy the fact’ trades on the expected election outcome, dragging USD/JPY lower. The renewed USD/JPY weakness capped the USD’s recovery, helping Gold price build on the previous upswing.
Furthermore, the ongoing criticism of Fed Chair Powell by Trump also prompts traders to temporarily forgo the USD in search of safety in the bright metal.
As observed on the daily chart, Gold price is holding comfortably above all major Simple Moving Averages (SMA) while the 14-day Relative Strength Index (RSI) points higher above the midline.
The technical setup, therefore, appears in favor of Gold buyers, with the immediate resistance located at the 23.6% Fibonacci Retracement (Fibo) level of the April record rally at $3377.
Further north, the $3,400 round level will challenge bearish commitments, with more upside opening toward the static resistance at around $3,440.
Alternatively, strong support is aligned at around $3,330, the confluence of the 21-day SMA and the 50-day SMA.
Sellers must find a strong foothold below that demand area to test the 38.2% Fibo level of the same rally at $3,297 before targeting the July low of $3,283.
Tariffs are customs duties levied on certain merchandise imports or a category of products. Tariffs are designed to help local producers and manufacturers be more competitive in the market by providing a price advantage over similar goods that can be imported. Tariffs are widely used as tools of protectionism, along with trade barriers and import quotas.
Although tariffs and taxes both generate government revenue to fund public goods and services, they have several distinctions. Tariffs are prepaid at the port of entry, while taxes are paid at the time of purchase. Taxes are imposed on individual taxpayers and businesses, while tariffs are paid by importers.
There are two schools of thought among economists regarding the usage of tariffs. While some argue that tariffs are necessary to protect domestic industries and address trade imbalances, others see them as a harmful tool that could potentially drive prices higher over the long term and lead to a damaging trade war by encouraging tit-for-tat tariffs.
During the run-up to the presidential election in November 2024, Donald Trump made it clear that he intends to use tariffs to support the US economy and American producers. In 2024, Mexico, China and Canada accounted for 42% of total US imports. In this period, Mexico stood out as the top exporter with $466.6 billion, according to the US Census Bureau. Hence, Trump wants to focus on these three nations when imposing tariffs. He also plans to use the revenue generated through tariffs to lower personal income taxes.
The EURJPY pair declined in its last intraday levels, to gain a positive momentum that might assist it to recover and rise again, and it attempts to offload its clear overbought conditions on the (RSI), especially with the emergence of the negative signals from there, to test a main bullish trend line on the short-term basis, accompanied by its lean on the support of its EMA50, reinforcing the importance of this area as a strong support that prevents the price turn to the bearish track on the near-term basis.
Therefore, our expectations suggest the (EURJPY) price rise in its upcoming intraday trading, conditioned by the stability of the support at 172.25, to target the critical resistance at 173.25 preparing to attack it.
The expected trading range for today is between 172.00 and 174.00
Trend forecast: Bullish
On Thursday, crude oil triggered a breakout of the hammer and rallied to test resistance around the lower line of the bear flag pattern, which was a support line before. The one-day bullish reversal hit a high of $67.55, at the time of this writing and looks likely to close in a similar position. That would confirm the hammer breakout with a daily close above Wednesday’s high and at the top of the day’s trading range. Trading continues near the highs of the day so it is possible a new high will be reached before today’s session ends.
The 20-Day MA, which represents potential resistance and is now at $67.69, is set to converge with the lower boundary line of the flag. Notice that the 20-Day line (purple) was recognized as resistance over many days the past couple of weeks as the flag formed. When two or more indicators identify a similar potential resistance zone, either signs of resistance are seen or an upside breakout triggers.
A bull breakout above today’s high and then the 20-Day MA would show further strength. However, the rally would be rising into the flag consolidation zone where it could encounter resistance easily along the way. There is also the 200-Day MA, currently at $68.67, representing dynamic resistance across the top of the flag.
Since a rally would be counter to the bearish breakdown of the flag and channel, it may be the least expected outcome. Therefore, it could happen and may surprise on the upside given recent spikes in volatility seen since the lower swing high in April.
For a look at all of today’s economic events, check out our economic calendar.