The main tag of Gold Today Price Articles.
You can use the search box below to find what you need.
[wd_asp id=1]
The main tag of Gold Today Price Articles.
You can use the search box below to find what you need.
[wd_asp id=1]
The US Dollar (USD) remains under selling pressure on Thursday, as investors juggle with risk-related headlines and little guidance from macroeconomic data. Spot Gold benefited from broad USD weakness and surpassed the $4,500 level during American trading hours.
The USD traded with a firmer tone at the beginning of the week after the United States (US) and Iran resumed hostilities, sending Oil prices sharply up and hence raising concerns about mounting inflationary pressures. The Greenback, however, came under pressure mid-week amid speculation that the Bank of Japan (BoJ) intervened in the currency market to prevent the Japanese Yen (JPY) from falling further.
A better market mood kept the USD pressured despite the Middle East conflict. On the one hand, speculative interest welcomed headlines indicating that Russian President Vladimir Putin said there is a chance for constructive peace talks with Ukraine.
Finally, Federal Reserve (Fed) Governor Christopher Waller cooled the odds for a September rate hike, saying that officials can “wait one meeting,” as long as there are no surprises from upcoming inflation data, adding that a 25 bps hike won’t bring inflation back to 2%.
Data that can shape the upcoming Fed’s decision is around the corner: On Friday, the US will publish the August Nonfarm Payrolls (NFP) report, a picture of the situation in the labor market, while next week, the country will unveil the Consumer Price Index (CPI) for the same month.
In the four-hour chart, XAU/USD turned bullish as it moved above the 20-period Simple Moving Average (SMA) at $4,397.48, the 100-period SMA at $4,481.65, and the 200-period SMA at $4,315.95. The moving averages are pretty much horizontal, failing to provide clear directional clues. Still, the price holding above them skews the risk to the upside. Technical indicators, in the meantime, gain upward traction above their midlines, maintaining nice vertical slopes, a sign of strong buying interest.
The XAU/USD pair daily chart keeps a constructive near-term tone as it holds above both the 20-day SMA at $4,462.49 and the 100-day SMA at $4,358.36. The Relative Strength Index (RSI) indicator ticks north at around 56, while the Momentum indicator also holds in positive territory, suggesting steady, rather than exuberant, upside pressure.
On the downside, immediate support is seen at the 100-period SMA at $4,481.65, followed by the 20-period SMA at $4,397.48 and then the 200-period SMA near $4,315.95. On the topside, the 200-day SMA at $4,533.34 forms the next significant resistance, and a sustained break above this barrier would likely open the door to further gains.
(The technical analysis of this story was written with the help of an AI tool. Know more.)
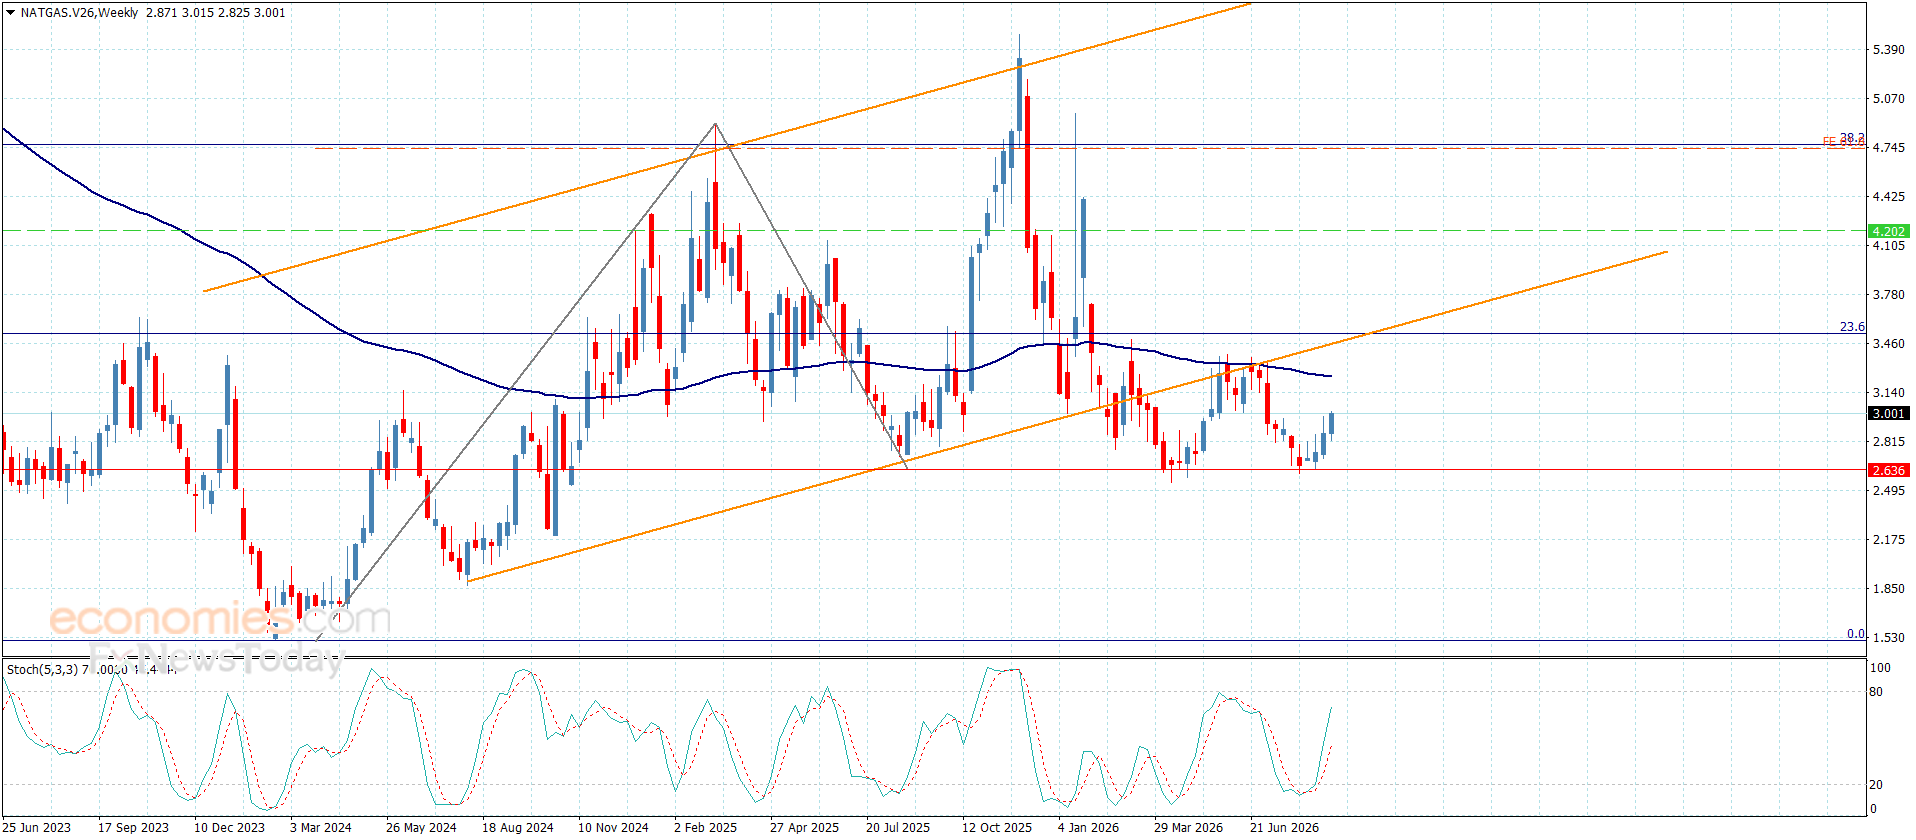
Natural gas price benefited from the repeated positive pressures by breaching the barrier at $2.920, confirming the continuation of the bullish corrective scenario, approaching the initial target at $3.050.
In general, the stability above $2.620 support and providing bullish momentum by the main indicators will increase the efficiency of the bullish trend in the current trading, to expect the attempt of recording extra gains by its rally towards $5.200 and $3.380.
The expected trading range for today is between $2.950 and $3.200
Trend forecast: Bearish
Gold (XAU/USD) is trading higher on Thursday, returning to levels above $4.400 after bouncing from three-week lows near $4,280 on Wednesday. The precious metal is drawing support from a weaker USD, as ADP employment data disappointed and New York Federal Reserve (Fed) President John Williams tamed rate hike expectations, but Fed tightening bets remain solid, and bulls are likely to face significant resistance at $4,470.
US Data released on Wednesday revealed that private employment rose 38K in August, the weakest reading since January and well below the 47K increase expected.
Apart from that, New York Federal Reserve President John Williams said that rising bond yields are due to a solid economy, rather than to inflation fears, and suggested that the central bank should “wait and see” before taking decisions on interest rates. This cooled hopes of an immediate rate hike, although futures markets are still pricing a 60% chance of a 25 basis point hike at September’s meeting, according to the CME’s FedWatch Tool.
XAU/USD has bounced up from lows and is trading returning to the $4,430 area, but keeps a mildly bearish near‑term tone following an impulsive reversal from last week’s highs near $4,700. Momentum indicators are in neutral territory, with the daily Relative Strength Index (14) at 52 and the Moving Average Convergence Divergence (MACD) below zero, which shows that the bullish impulse is fragile.
Gold bulls are likely to be tested at the August 31 high, near $4,470, and, above here at the key 200‑day Simple Moving Average (SMA) at $4,533, which closes the path to last week’s high, at $4,690. On the downside, a break of the August 14 low in the $4,310 area confirms a “Head and Shoulders” pattern, and adds pressure towards the August 6 low of $4,220 and the late July lows near $4,000.
(The technical analysis of this story was written with the help of an AI tool. Know more.)
Gold has played a key role in human’s history as it has been widely used as a store of value and medium of exchange. Currently, apart from its shine and usage for jewelry, the precious metal is widely seen as a safe-haven asset, meaning that it is considered a good investment during turbulent times. Gold is also widely seen as a hedge against inflation and against depreciating currencies as it doesn’t rely on any specific issuer or government.
Central banks are the biggest Gold holders. In their aim to support their currencies in turbulent times, central banks tend to diversify their reserves and buy Gold to improve the perceived strength of the economy and the currency. High Gold reserves can be a source of trust for a country’s solvency. Central banks added 1,136 tonnes of Gold worth around $70 billion to their reserves in 2022, according to data from the World Gold Council. This is the highest yearly purchase since records began. Central banks from emerging economies such as China, India and Turkey are quickly increasing their Gold reserves.
Gold has an inverse correlation with the US Dollar and US Treasuries, which are both major reserve and safe-haven assets. When the Dollar depreciates, Gold tends to rise, enabling investors and central banks to diversify their assets in turbulent times. Gold is also inversely correlated with risk assets. A rally in the stock market tends to weaken Gold price, while sell-offs in riskier markets tend to favor the precious metal.
The price can move due to a wide range of factors. Geopolitical instability or fears of a deep recession can quickly make Gold price escalate due to its safe-haven status. As a yield-less asset, Gold tends to rise with lower interest rates, while higher cost of money usually weighs down on the yellow metal. Still, most moves depend on how the US Dollar (USD) behaves as the asset is priced in dollars (XAU/USD). A strong Dollar tends to keep the price of Gold controlled, whereas a weaker Dollar is likely to push Gold prices up.
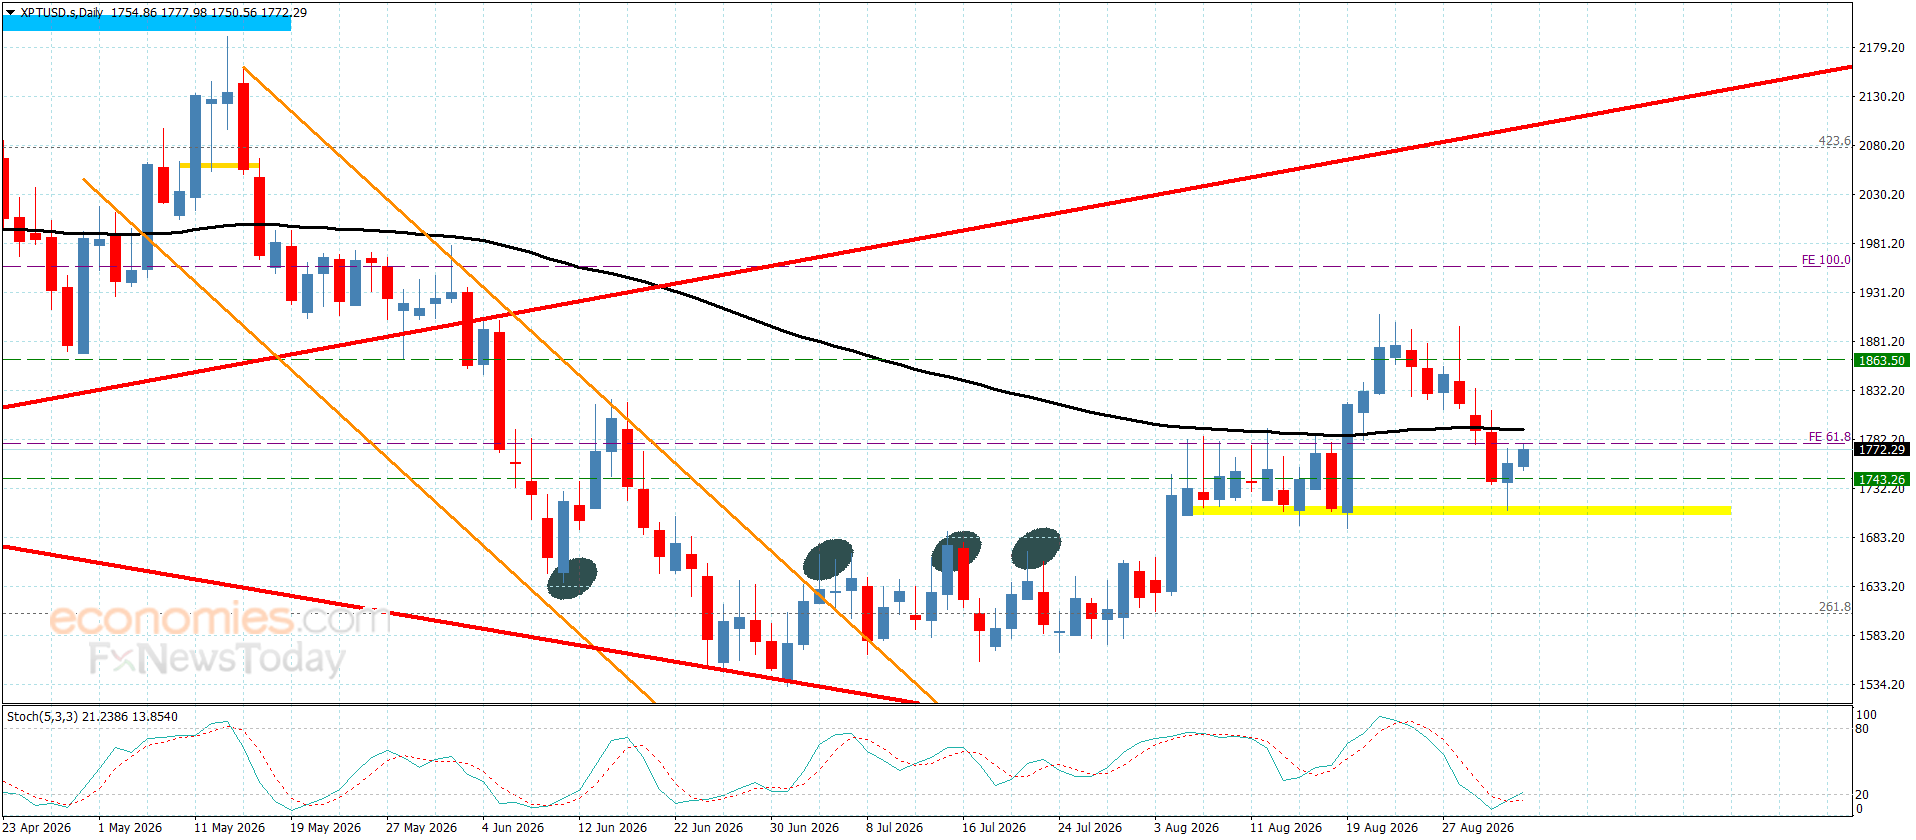
Platinum price ended the last corrective decline by its approach from the support level of $1695.00, to begin forming bullish waves, announcing the continuation of the previously suggested bullish scenario, fluctuating near $1780.00 level.
The price might be forced to provide some sideways trading until gathering bullish momentum to surpass the 55-moving average at $1800.00, to begin targeting several positive stations by its rally towards $1860.00 and $1910.00.
The expected trading range for today is between $1730.00 and $1860.00
Trend forecast: Bullish
Spot gold is edging higher Wednesday after rebounding from an early session setback. The main trend changed to down earlier today when sellers took out the swing bottom at $4,311.04, but new buyers may have emerged on the test of a key retracement zone.
The long-term range is $3,942.10 to $4,697.11. Its 50% to 61.8% retracement zone is $4,319.60 to $4,230.51. Today’s rebound came from a trade to $4,282.62, which fell inside the zone. To some traders, this is a value zone.
Adding to concerns about heightened volatility is the fact that Spot gold is trading under 200-day moving average resistance at $4,530.71 and nearing 50-day moving average support at $4,222.93.
The early price action suggests trader reaction to the 50% level at $4,319.60 will determine the direction of the market into the close. A sustained move over this level could lead to a strong rally into the close, while failure to hold it would put the $4,230.51 to $4,222.93 support cluster back on the radar.
The rate trade stays pointed against gold until the data changes it. Warsh and Barr both said this week the Fed has more work to do. The 10-year pulled back from 4.814% but is still near a multiyear high. The dollar index is at 99.67. Crude is above $90 WTI and near $95 Brent. The geopolitical bid from the Middle East conflict is going to the dollar, not the metal. Friday’s payrolls report at 56,000 expected is the number that can either keep the 68% September odds in place or force a repricing. The rate pressure holds until a soft jobs number gives buyers a reason to step back in.
Gold bounced from $4,282.62 inside the long-term retracement zone at $4,319.60 to $4,230.51. The main trend turned down Wednesday when sellers took out $4,311.04. The 200-day moving average at $4,530.71 is resistance above. The trade stays bearish while gold sits under $4,319.60. A close above that level is the first sign value buyers are taking over. A break through the 50-day at $4,222.93 opens the support cluster down to $3,942.10. The 200-day break from Friday is still the damage running this market. Wednesday’s bounce has not undone it.
If you’d like to know more about how to trade gold, please visit our educational area.
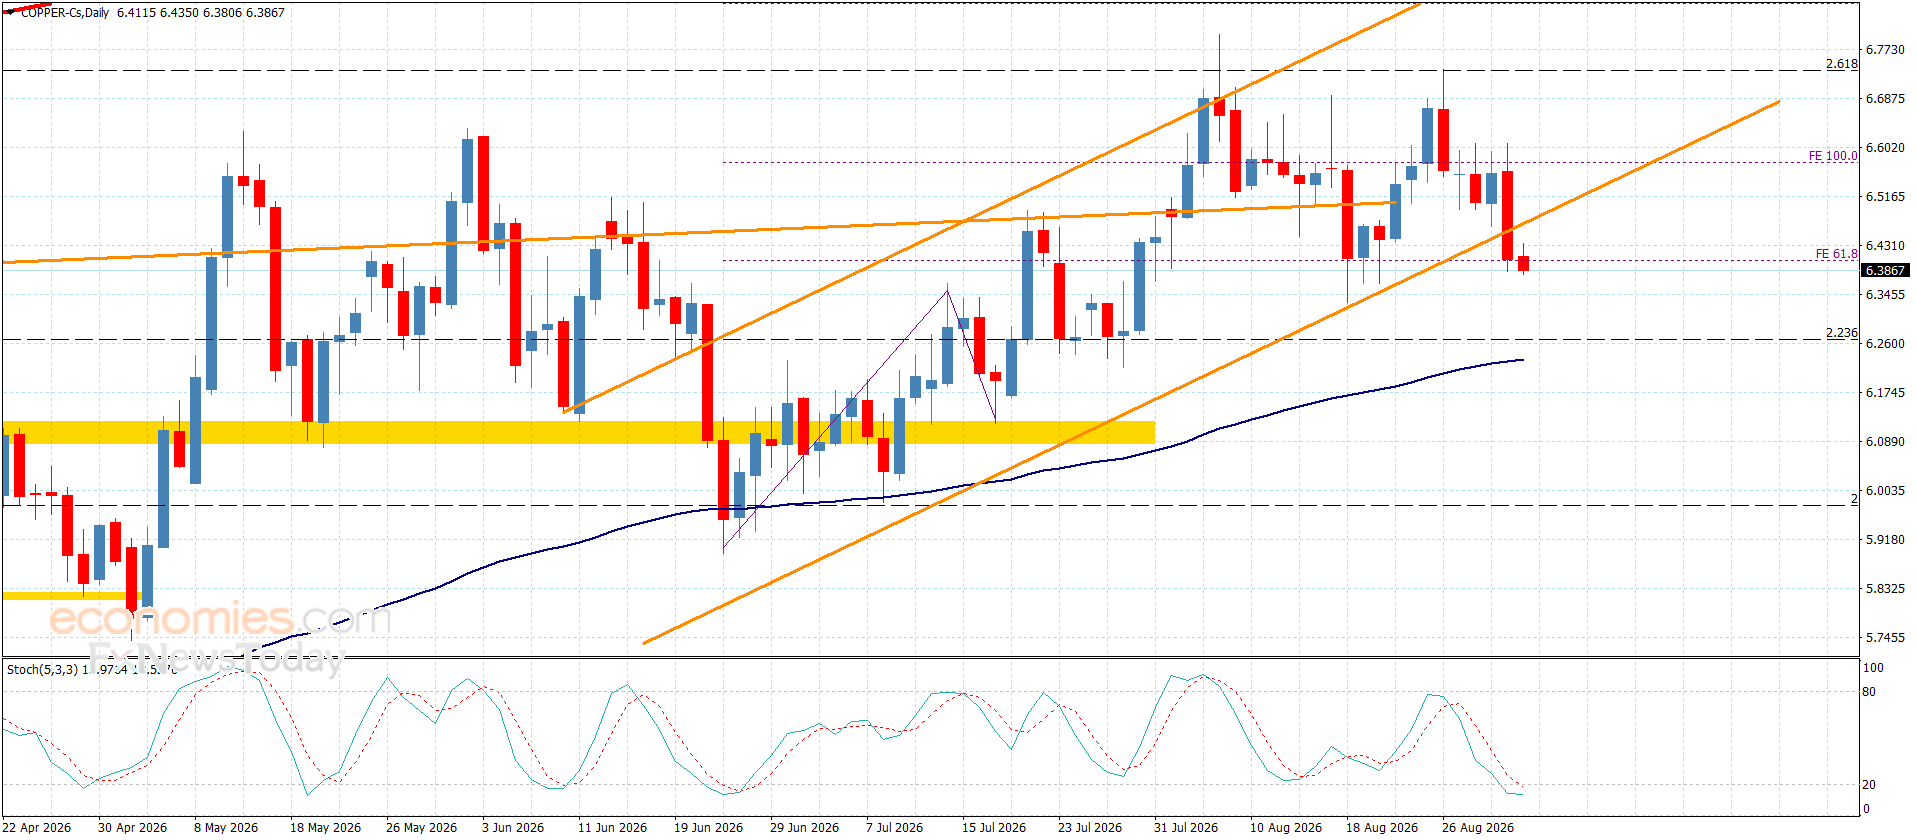
Copper price ended its recent trading by posting consecutive closes below the barrier at $6.7400, forcing it to succumb to the negative momentum of the Stochastic indicator and form several bearish corrective waves, with the price currently stabilizing around $6.3800.
The price needs to hold above the support level at $6.3300 during the current period to reinforce the previously suggested main bullish scenario, initially targeting $6.5000 and then the aforementioned barrier. However, breaking below this support and holding beneath it would force the price to form further corrective waves, potentially leading to additional losses toward $6.2000, which in turn represents the key level separating the current move from a potential change in the overall trend of upcoming trading.
The expected trading range for today is between $6.3300 and $6.5000
Trend forecast: Fluctuating
Welcome, my fellow traders! I have prepared a price forecast for the USCrude, XAUUSD, and EURUSD using a combination of the margin zones method and technical analysis. Based on the market analysis, I suggest entry signals for intraday traders.
Gold prices continued to fall today.
The article covers the following subjects:
Oil prices continued to rise yesterday, piercing the Target Zone of 86.82–85.61 and reaching the Gold Zone of 90.05–89.64. Bears are currently holding the Gold Zone, so a downward correction may unfold.
If a correction develops, the price may test the support zone A of 86.71–86.31. Consider long trades near it, with the first target at 88.53 and the second one around 90.75.
Buy near support A of 86.71–86.31. TakeProfit: 88.53, 90.75. StopLoss: 85.28.
Gold prices continued to fall today, reaching the Gold Zone of 4,286–4,276. Bulls defended this zone, and the price began to rise. If this corrective rally continues, the metal will climb to resistance A of 4,395–4,385. Once this zone is tested, consider short trades, with the first target at 4,338 and the second one near today’s low of 4,282.
Sell near resistance A of 4,395–4,385. TakeProfit: 4,338, 4,282. StopLoss: 4,420.
The euro continues to correct lower and is testing support B of 1.1585–1.1572. This support zone is the boundary of the short-term uptrend. If bulls keep the asset above this zone and the price begins to rise, long trades can be considered, with the first target at 1.1642 and the second one around 1.1711.
If the euro price settles below support B, the short-term trend will turn bearish. In this case, consider short trades on the next trading day, targeting the lower Target Zone of 1.1459–1.1434.
Buy near support B of 1.1585–1.1572. TakeProfit: 1.1642, 1.1711. StopLoss: 1.1540.
Would you like to learn more about technical analysis methods and principles? Explore our comprehensive guide.
P.S. Did you like my article? Share it in social networks: it will be the best “thank you” 🙂
Useful links:
The content of this article reflects the author’s opinion and does not necessarily reflect the official position of LiteFinance broker. The material published on this page is provided for informational purposes only and should not be considered as the provision of investment advice for the purposes of Directive 2014/65/EU.
According to copyright law, this article is considered intellectual property, which includes a prohibition on copying and distributing it without consent.
Select market data provided by ICE Data Services. Select reference data provided by FactSet. Copyright © 2026 FactSet Research Systems Inc.Copyright © 2026, American Bankers Association. CUSIP Database provided by FactSet Research Systems Inc. All rights reserved. SEC filings and other documents provided by Quartr.© 2026 TradingView, Inc.
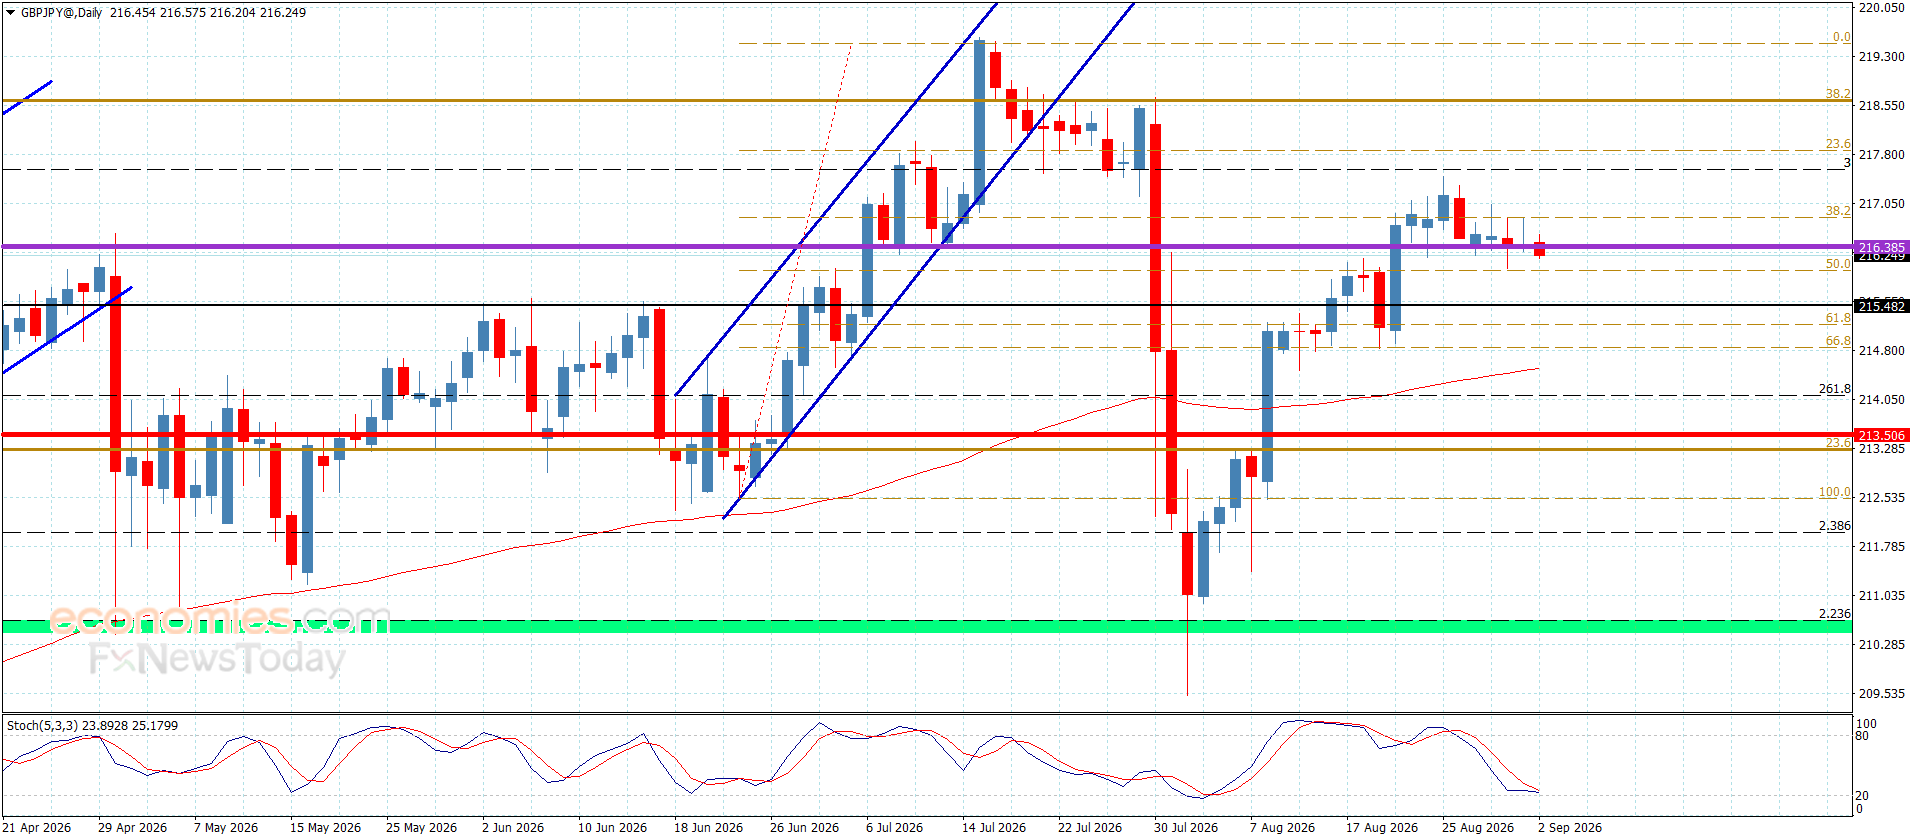
Despite the weakness in the pair’s recent trading, posting further negative closes below the 217.85 barrier supports the continuation of the previously suggested bearish corrective bias. The price has once again slipped below the 216.35 level, signaling its readiness to resume the previously proposed corrective decline.
Moreover, stochastic is providing negative momentum while stabilizing near the 20 level, reinforcing the chances of the price targeting the upcoming corrective levels around 215.55 and 214.95, respectively.
The expected trading range for today is between 214.95 and 216.50
Trend forecast: Bearish
The Platinum Group Metals Ltd stock price fell by -4.03% on the last day (Tuesday, 1st Sep 2026) from $1.49 to $1.43. It has now fallen 3 days in a row. During the last trading day the stock fluctuated 3.50% from a day low at $1.43 to a day high of $1.48. The price has fallen in 6 of the last 10 days but is still up by 0.7% over the past 2 weeks. Volume has increased on the last day by 426 thousand shares but on falling prices. This may be an early warning and the risk will be increased slightly over the next couple of days. In total, 1 million shares were bought and sold for approximately $1.51 million.
The stock lies in the middle of a very wide and weak rising trend in the short term and a further rise within the trend is signaled. Given the current short-term trend, the stock is expected to rise 2.99% during the next 3 months and, with a 90% probability hold a price between $1.30 and $1.69 at the end of this 3-month period.
The Platinum Group Metals Ltd stock holds a sell signal from the short-term Moving Average; at the same time, however, there is a buy signal from the long-term average. Since the short-term average is above the long-term average there is a general buy signal in the stock giving a positive forecast for the stock. On further gains, the stock will meet resistance from the short-term Moving Average at approximately $1.53. On a fall, the stock will find some support from the long-term average at approximately $1.42. A break-up through the short-term average will send a buy signal, whereas a breakdown through the long-term average will send a sell signal. Some negative signals were issued as well, and these may have some influence on the near short-term development. A sell signal was issued from a pivot top point on Friday, August 21, 2026, and so far it has fallen -12.80%. Further fall is indicated until a new bottom pivot has been found. Furthermore, there is currently a sell signal from the 3 month Moving Average Convergence Divergence (MACD). Volume rose on falling prices yesterday. This may be an early warning and the stock should be followed more closely.
Platinum Group Metals Ltd finds support from accumulated volume at $1.41 and this level may hold a buying opportunity as an upwards reaction can be expected when the support is being tested.
This stock has average movements during the day and with good trading volume, the risk is considered to be medium. During the last day, the stock moved $0.0500 between high and low, or 3.50%. For the last week, the stock has had daily average volatility of 5.69%.
Our recommended stop-loss:
$1.36
(-5.14%)
(This stock has medium daily movements and this gives medium risk. There is a sell signal from a pivot top found 7 days ago.)
For the upcoming trading day on Wednesday, 2nd we expect Platinum Group Metals Ltd to open at $1.45, and during the day (based on 14 day Average True Range),
to move between $1.39 and $1.47,
which gives a possible trading interval of +/-$0.0880 (+/-6.35%) up or down from last closing price.
If Platinum Group Metals Ltd takes out the full calculated possible swing range there will be an estimated 6.35% move between the lowest and the highest trading price during the day.
Since the stock is closer to the support from accumulated volume at $1.41 (1.40%)
than the resistance at $1.49 (4.20%),
our systems sees the trading risk/reward intra-day as attractive and believe profit can be made before the stock reaches first resistance..
Platinum Group Metals Ltd holds several negative signals and this should be a sell candidate, but due to the general chance for a turnaround situation it should be considered as a hold candidate (hold or accumulate) in this position whilst awaiting further development.
Current score:
0.633
Hold/Accumulate
Unchanged
Want to trade but not sure how?
Our step-by-step guide can help.
Skip the guide? Open account with our trusted broker* 
*Your capital is at risk