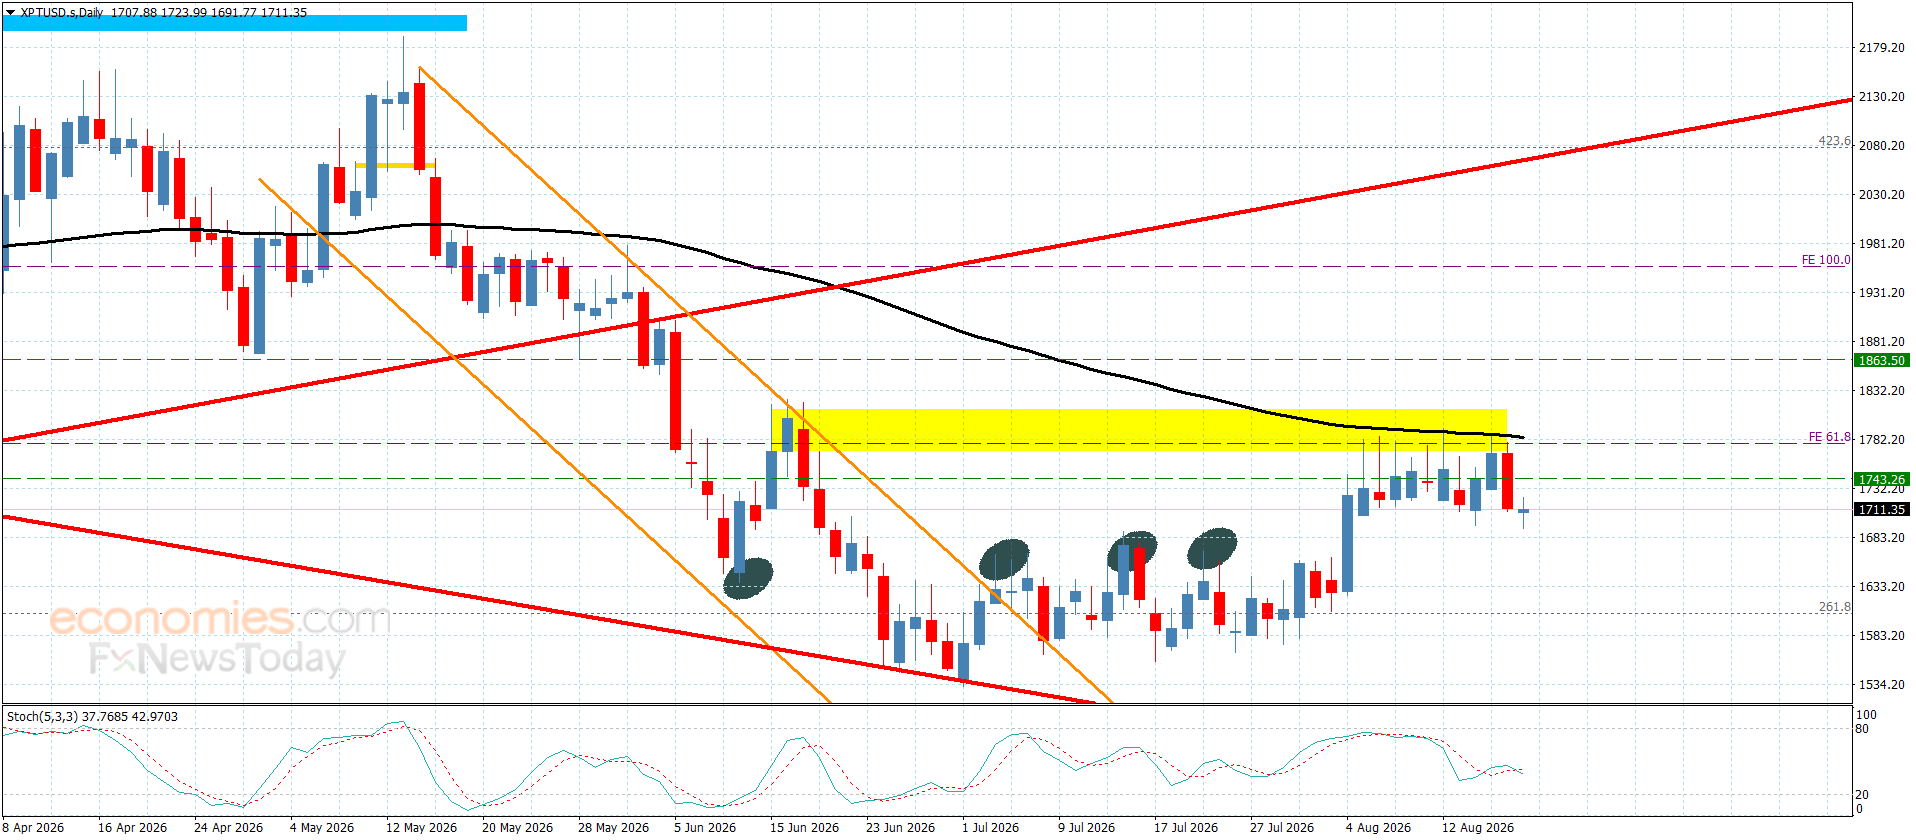
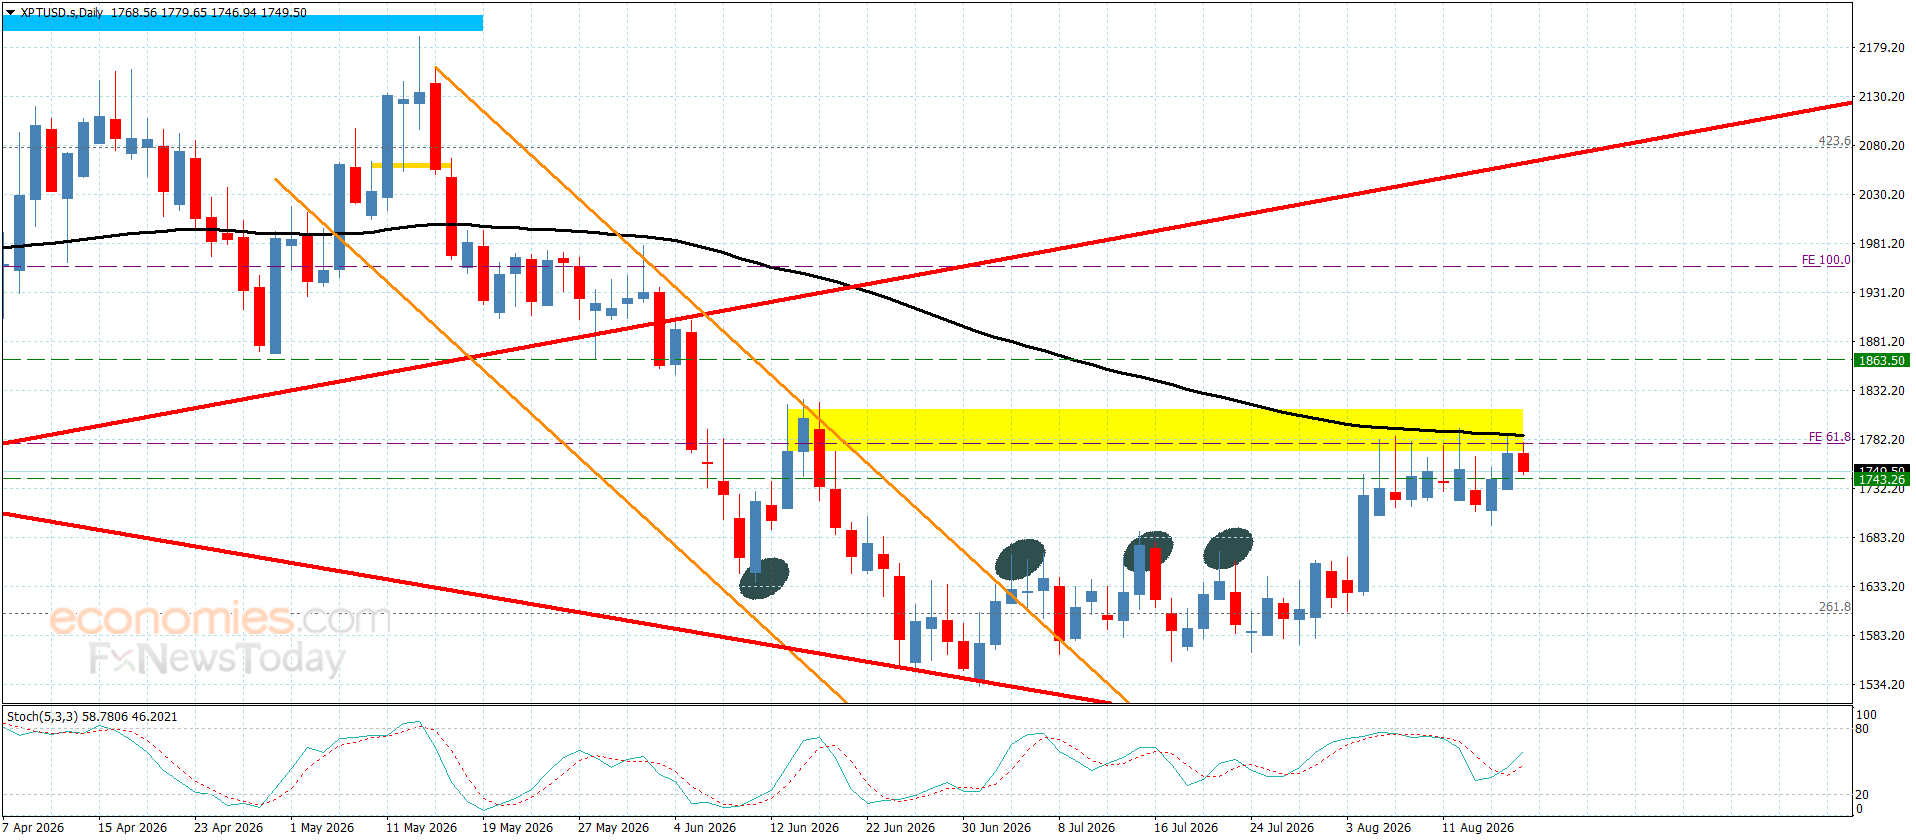
The main tag of Gold Today Price Articles.
You can use the search box below to find what you need.
[wd_asp id=1]
The main tag of Gold Today Price Articles.
You can use the search box below to find what you need.
[wd_asp id=1]
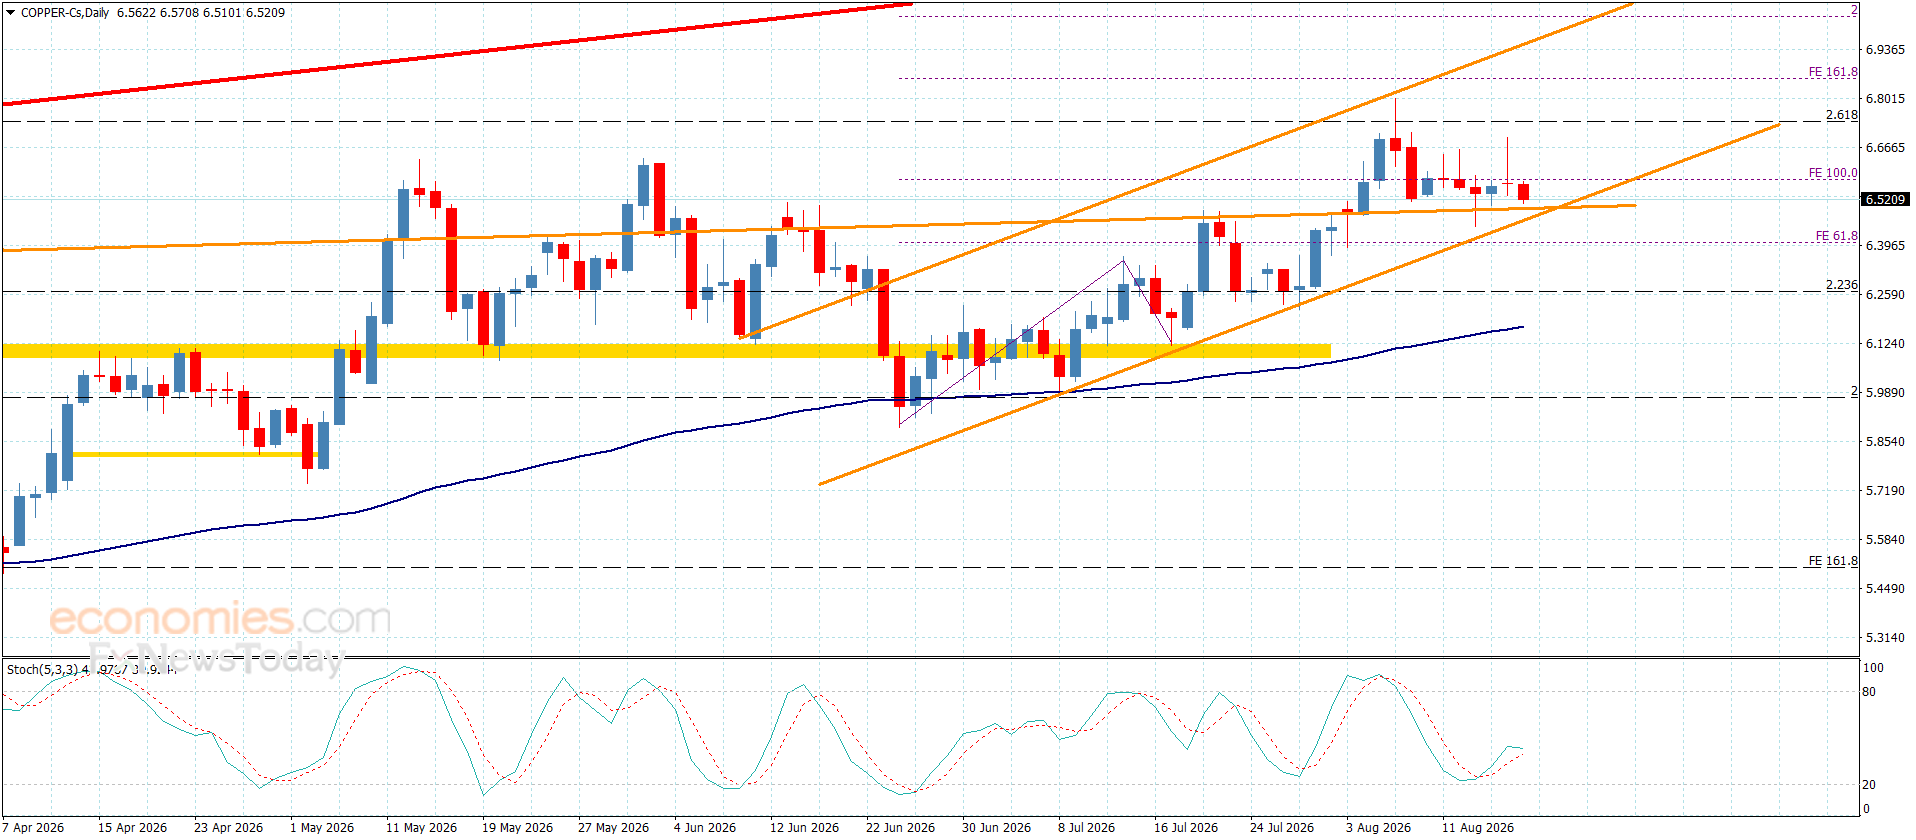
Copper price delayed activating the bearish corrective trend as it faced new positive pressure by stochastic reaching overbought levels, besides forming extra support at $6.1000 level in the last period, which pushed it to attack the barrier near $6.3800.
Facing positive pressure might push the price to surpass the current barrier, to begin targeting some positive stations by its rally towards $6.4600 and $6.6000, while the decline below $6.1000 and providing negative close will confirm its readiness to activate the bearish corrective trend, to expect reaching $5.9500 and $5.8000.
The expected trading range for today is between $6.2000 and $6.4000
Trend forecast: Fluctuating within the bullish trend
Japan ranks as the third largest coffee importer globally and maintains one of the most sophisticated single-serve coffee markets in the world. The broader coffee pod market has reached deep household penetration, estimated at ~25–30% of Japanese households owning a pod machine. Within this mature structure, the Single Origin Coffee Pods sub-segment represents a concentrated high-growth lane, defined by the intersection of Japan’s entrenched convenience culture and a deepening appreciation for specialty grade coffee.
The product profile for single-origin pods in Japan centers on tangible quality differentiation: origin-specific flavor profiles (e.g., Ethiopian Yirgacheffe floral notes, Colombian washed brightness), batch codes, and roasting dates prominently displayed on packaging. The market remains heavily weighted toward at-home consumption (~60–65% of volume), though office coffee service and hospitality channels are expanding as business travel recovers. Unlike blended pods which compete primarily on price, single-origin pods compete on taste, story, and ethical sourcing credentials, creating a distinct competitive dynamic cross-cutting the broader FMCG coffee category.
While the total coffee pod market in Japan is maturing at a moderate pace, the Single Origin Coffee Pods segment is firmly in a growth phase. Industry tracking data suggests the sub-segment captured roughly 18–22% of total coffee pod market value in 2026, up from an estimated 12–15% in 2020. Volume growth has been supported by expanding machine compatibility and rising availability in both general trade and specialty retail. The segment is projected to expand at a 7–9% value CAGR from 2026 to 2035, outpacing the broader pod market by a factor of two to three.
This growth trajectory implies that by 2035, single-origin pods could represent 28–33% of the total pod value pool in Japan. Volume growth is expected to be softer, running in the 2–4% CAGR range, as the primary lever is value growth through mix shift and pricing power. The size of the addressable consumer base is expanding as younger demographics (25–40 age cohort) show higher willingness to pay for origin transparency and quality. Downside risks to growth include prolonged weakness in the yen increasing landed costs beyond consumer tolerance, and regulatory changes that could mandate costly packaging redesigns across the entire product lineup.
By Product Type: Arabica Single Origin dominates Japan’s pod market, accounting for approximately 85–90% of segment volume within the category. Within this, washed and natural process Ethiopian and Colombian lots are the most widely distributed, while Kenya and Guatemala hold strong positions among connoisseurs. Robusta Single Origin remains a very small niche (under 5%), primarily used in higher-caffeine blends for office environments. Specialty/Grade 1 certifications (SCA 80+ point scoring) are increasingly common, with roughly 30–40% of single-origin pod SKUs carrying some formal grading claim. Organic and Fair Trade certifications appear on ~20–25% of SKUs, and are a strong driver in the DTC channel where ethical sourcing is a core brand pillar.
By Application and End-Use Sector: At-home consumption is the largest demand pool, driven by convenience, remote work legacies, and the desire for café-quality drinks. The at-home segment accounts for an estimated 60–65% of single-origin pod volume, with households in the Tokyo metropolitan area and Kansai region showing the highest penetration rates. Office and workplace consumption represents ~15–20%, supported by office coffee service providers that stock premium capsules for break rooms and meeting rooms. Hospitality (hotels, inns) accounts for ~10–15%, heavily oriented toward guest experience and gift/souvenir sales. Foodservice (cafés and restaurants) uses single-origin pods as a consistency tool for pour-over alternatives, representing ~5–10% of volume but often commanding the highest unit prices through wholesale arrangements.
By Buyer Group: End-consumers are the primary demand unit, segmented between quality-motivated buyers (willing to pay JPY 70+ per pod) and occasional treat buyers. Procurement managers in offices and hotels prioritize reliability of supply and compatibility with existing machine fleets. Category managers at retail chains evaluate single-origin pods on velocity, gross margin per linear foot, and differentiation value relative to private-label alternatives. Foodservice distributors and e-commerce platform buyers both demand responsive logistics and short lead times, given the short shelf-life implied by fresh-roasted single-origin offerings.
Single Origin Coffee Pods exist in a multi-layer pricing stack that starts on the international green coffee market and ends on a retail shelf or subscription portal. At the upstream level, specialty-grade green coffee commands a significant premium over commodity-grade beans. Depending on origin and quality score, the raw coffee cost for a single-origin pod is typically 30–60% higher than for a standard blend. This cost is layered with Japan’s import duties (applied on green coffee, generally low under various EPAs but subject to customs clearance costs), fumigation, and warehousing at bonded facilities around Tokyo, Yokohama, and Kobe.
Manufacturing and packaging costs represent the next major layer. Japan’s labor costs are among the highest in Asia, driving nearly universal automation for roasting, grinding, dosing, and nitrogen-flushing for freshness pod sealing. Pod sealing technology varies by material: aluminum capsules (perceived as best for freshness and recyclability) require high-pressure sealing lines, while plastic and bio-based capsules use ultrasonic welding. The unit cost of packaging materials is significant, with sustainable alternatives adding 20–40% per pod compared to conventional multi-material laminates.
Brand premium and positioning account for the wide retail price variance. Established specialty roasters can command JPY 80–130 per pod by leveraging origin storytelling and rarity. Retail margins and slotting fees in Japan’s concentrated supermarket sector are high, often adding 30–50% to the manufacturer’s suggested retail price. Online vs. offline price differentials are material, with subscriptions typically offering a 10–20% per-unit discount relative to single-box purchases in physical stores.
The competitive landscape for Single Origin Coffee Pods in Japan is a hybrid of global brand owners, domestic major roasters, and a growing cohort of specialty-focused challengers. Nestlé Japan, through its Nespresso and Starbucks by Nespresso formats, is widely recognized as the category leader in the premium single-serve space, commanding a significant share of the installed machine base. Nespresso’s own single-origin offerings (e.g., Ethiopia, Colombia) and its annual limited-edition series set a benchmark for quality and price that independent roasters must match or exceed in value. Domestic major roasters—UCC Holdings, Key Coffee, and AGF (Ajinomoto General Foods)—compete through a dual strategy: private label manufacturing for retailers and their own branded pod lines compatible with proprietary and Nespresso systems.
Specialty Coffee Roasters focused on DTC and high-end retail represent the most dynamic competitive tier. Companies like % Arabica, Blue Bottle Coffee (Nestlé-backed but operationally distinct in Japan), and independent roasters such as Single O, About Life Coffee, and Fuglen have introduced single-origin capsule lines that leverage their café credibility. These players operate at smaller scale but invest heavily in digital marketing and subscription logistics.
Value and private-label specialists, including major retailer brands (Aeon Topvalu, Seiyu, Don Quijote), offer single-origin pods at lower price points (JPY 45–65) by sourcing larger volumes of standard-grade single-origin beans (e.g., Brazil Santos, Vietnam Da Lat) and using simpler packaging. Contract manufacturing and white-label partners, concentrated in the Tokyo–Chiba and Kobe industrial corridors, provide filling and packaging services for brands that lack their own production lines.
This tier enables rapid SKU proliferation but introduces capacity constraints for small-batch, high-SKU-prolific runs that single-origin sourcing requires.
Japan has no domestic green coffee bean production; all raw material is imported. However, the country possesses a highly developed and technologically advanced domestic roasting and pod manufacturing ecosystem. Domestic production, defined here as the conversion of imported green coffee into finished pods, accounts for an estimated 70–80% of the single-origin pods sold in Japan. The remaining 20–30% comprise fully imported roasted coffee pods, chiefly from Italy, Switzerland, and the United States. Domestic manufacturing offers several structural advantages: shorter lead times, the ability to offer fresher-roasted product (a key selling point for single-origin), and customization for Japan-specific pod formats and packaging sizes.
Production clusters are concentrated in the Kanto region (Tokyo, Yokohama, Chiba, Saitama) and the Kobe–Osaka corridor. These regions offer proximity to major ports, extensive cold-chain logistics, and a dense service base for industrial roasting and packaging equipment. Supply bottlenecks center on securing consistent, high-quality single-origin green coffee lots on annual contracts, particularly for high-demand origins such as Ethiopia Yirgacheffe and Kenya AA. Climate-driven supply disruptions and freight cost volatility remain chronic risks.
On the packaging side, the shift toward sustainable materials has created competition for supply of specialized barrier materials (e.g., PVDC-free aluminum laminates, PLA-based capsules) which are largely imported. Filling line capacity is generally adequate for steady-state demand, but the industry’s move toward smaller, more frequent production runs for limited-edition single origins strains overall line utilization and raises unit conversion costs.
Japan’s coffee import dependency is total. For the Single Origin Coffee Pods segment specifically, the key trade flow is the import of green coffee beans classified under HS 090111 (not roasted, not decaffeinated). Japan annually imports approximately 400,000–450,000 tonnes of green coffee, with Brazil (~30%), Vietnam (~20%), Colombia (~10%), and Indonesia (~10%) as the largest volume origins. For single-origin pods, the origin mix skews heavily toward higher-grade Arabicas: Colombia, Ethiopia, Kenya, Guatemala, and Costa Rica are disproportionately represented relative to their overall import share due to their specialty-grade availability and favorable consumer perception in Japan.
Imports of roasted coffee (HS 090121), including pre-packaged single-origin pods from foreign manufacturers, face a higher tariff rate than green coffee, which disincentivizes this channel for volume-focused players. However, European and American specialty roasters with strong brand equity (e.g., Illy, Peet’s, counter-culture) maintain a presence in Japan through a mix of direct import and local distribution partnerships. The Japanese market’s quality expectations and specific pod system formats mean that imported finished pods often require dedicated production lines or adaptation, further raising the effective trade barrier.
Exports of finished Single Origin Coffee Pods from Japan to other East Asian markets (South Korea, Taiwan, Hong Kong, China) represent a small but structurally growing trade flow, driven by demand for Japanese-branded premium consumer goods and the cachet of Japanese roasting expertise. Trade data likely under-reports this flow as it is often consolidated within broader coffee and confectionery export categories.
Distribution of Single Origin Coffee Pods in Japan spans a complex multi-channel network reflecting the country’s dense retail infrastructure and sophisticated logistics sector. The primary channel is offline retail, consisting of supermarkets (e.g., Aeon, Ito-Yokado, Seiyu), convenience stores (7-Eleven, FamilyMart, Lawson), and department store food halls (Isetan, Takashimaya). Supermarkets hold the largest share by volume, leveraging wide shelf space and regular promotional cycles. Convenience stores are significant for impulse purchases and trial packs, though limited shelf space means they typically stock only 2–4 single-origin SKUs from major brands. Specialty coffee shops and lifestyle stores (e.g., Loft, Tokyu Hands) serve as discovery channels, offering unique rotating selections and high-margin single-origin pods.
Online retail is the fastest-growing distribution channel, estimated to account for 20–25% of segment sales by 2026, up from 10–15% pre-2020. Amazon Japan and Rakuten are the dominant platforms, with a growing share going to DTC websites operated by specialty roasters. Subscription models are prevalent online, providing recurring revenue and deep consumer data. B2B channels include office coffee service providers, foodservice distributors (Mitsubishi Shokuhin, Nippon Access, Sysco Japan), and hospitality procurement groups.
These buyers prioritize supply consistency, competitive pricing on high-volume origins, and compatibility with their installed machine base. Category managers in retail chains represent the most influential buyer group for brand access. They evaluate single-origin pods on category growth contribution, margin structure, and promotional support. Private-label buyers in this channel are aggressively expanding single-origin offerings to capture value-conscious consumers seeking premium taste.
The regulatory environment for Single Origin Coffee Pods in Japan is defined by food safety, labeling, packaging recyclability, and certification standards. The Food Sanitation Act and Food Labeling Act govern all consumer-facing products, requiring accurate origin or country of origin labeling (for raw beans, a key claim for single-origin marketing), ingredient lists, allergen information, and roast date. Products claiming specific health or functional benefits require separate regulatory approval under the Foods with Function Claims (FFC) system, which is rarely used for coffee pods due to caffeine content constraints.
The Containers and Packaging Recycling Law imposes extended producer responsibility (EPR) obligations on manufacturers and importers. This law is a primary driver of packaging innovation, as multi-material laminate pods (plastic + aluminum + coffee grounds) are difficult to recycle in Japan’s highly sorted waste stream. Mono-material aluminum pods are increasingly favored because aluminum recycling in Japan is well-established and economically viable.
Certifications carry significant market value. JAS Organic certification is mandatory for any organic claim and requires inspection of the supply chain from farm to packer, which adds administrative cost but confers strong consumer trust in the Japanese market. Fair Trade, Rainforest Alliance, and Bird Friendly certifications are used extensively as differentiators for single-origin products, with Rainforest Alliance appearing on an estimated 30–35% of specialty pod SKUs. Patent and trademark law governs system compatibility.
While Nespresso’s foundational patents expired in some jurisdictions, Japanese patent law and the legal landscape around capsule system clones remain active. Producers must ensure their pod designs do not infringe on active utility or design patents held by machine manufacturers, particularly for newer systems such as Nespresso Vertuo and Keurig 2.0. Compliance with these regulations requires dedicated legal and technical staffing, representing a fixed cost that disproportionately impacts smaller specialty roasters entering the single-origin pod space.
The Japan Single Origin Coffee Pods market is positioned for sustained expansion through the 2026–2035 forecast period, driven by favorable demographic shifts in taste preference, the continued penetration of pod machines in Japanese households, and the structural premiumization of the broader coffee market. Value growth is projected to run in the high single digits (7–9% CAGR), with volume growth tracking in the low to mid-single digits (2–4% CAGR). This implies that the average unit price will continue to rise as consumers trade up to higher-quality origins and as roasters pass through higher costs for sustainable packaging and certified sourcing. By 2035, single-origin pods could represent approximately 28–33% of the total coffee pod market value in Japan, up from an estimated 18–22% in 2026.
Key variables shaping the forecast include: (1) the trajectory of the Japanese yen against major origin currencies—prolonged yen weakness will compress roaster margins and may temper premiumization but is unlikely to reverse it; (2) the pace of sustainable packaging adoption—a regulatory mandate for recyclable packaging would accelerate the transition to aluminum and bio-based capsules, raising unit costs but also enhancing category sustainability credentials; (3) machine platform evolution—the next generation of home coffee machines will likely incorporate app-based customization and broader cold-brew compatibility, features well-suited to single-origin product lines.
Competitive dynamics are expected to intensify as private-label players improve the quality of their single-origin offerings and as more international specialty roasters enter the Japanese market through digital channels. The net effect is a market that remains attractive for premium-positioned brands, with healthy margins for those that successfully manage the complexities of origin sourcing, sustainable packaging, and multi-channel distribution. Volume growth will be gradual, but the structural shift toward higher value per pod creates a robust outlook for revenue expansion over the entire forecast horizon.
The most attractive growth opportunities in the Japan Single Origin Coffee Pods market center on the intersection of digital engagement, sustainability leadership, and under-penetrated B2B segments. Subscription-based DTC models represent a high-priority opportunity, allowing roasters to build direct relationships with consumers, stabilize demand forecasting, and increase lifetime value. The Japanese consumer’s comfort with subscription services across diverse categories provides a solid foundation for expansion in coffee pods. Innovators can differentiate by offering dynamic subscription algorithms that rotate origins based on user taste preferences and seasonal availability.
Sustainability presents a dual opportunity for cost leadership and brand elevation. First-mover advantage exists for brands that can deliver a fully compostable or highly recyclable single-origin pod without compromising on quality or pricing. Partnering with Japanese municipalities or waste management firms to create a closed-loop take-back program for used pods would align with the government’s broader circular economy goals and generate significant positive PR. The hospitality sector, particularly luxury hotels and traditional *ryokan*, is another major opportunity window.
These establishments are increasingly seeking localized premium amenities to enhance guest experience. A co-branded single-origin pod featuring the hotel’s design language and a story connecting the coffee origin to Japanese tea- or sake-making traditions could command high wholesale prices and build brand prestige.
Finally, there is a significant opportunity in the development of limited-edition and seasonal origin drops that mimic the “drop culture” of streetwear and collectibles. Japanese consumers have a demonstrated enthusiasm for limited-time offerings and rare product releases. A roaster capable of securing a exclusive contract for a microlot from a celebrated farm (e.g., Finca El Injerto, Hacienda La Esmeralda) and packaging it as a numbered, collectible pod set could generate outsized media attention and drive traffic for broader product lines.
These high-margin, low-volume releases serve as brand anchors that elevate the perceived value of the entire single-origin portfolio. The confluence of Japan’s cultural precision, its appreciation for craft, and its infrastructural readiness for premium single-serve coffee creates a fertile environment for targeted, innovative market plays through 2035.
This report is an independent strategic category study of the market for single origin coffee pods in Japan. It is designed for brand owners, general managers, category leaders, trade-marketing teams, e-commerce teams, retail partners, distributors, investors, and market entrants that need a clear read on where growth sits, which brands control the category, how pricing and promotion shape demand, and which channels matter most for scale and margin.
The framework is built for packaged coffee markets within consumer goods, where performance is driven by need states, shopper missions, brand hierarchies, price-pack architecture, retail execution, promotional intensity, and route-to-market control rather than by a narrow technical specification alone. It defines single origin coffee pods as Pre-portioned coffee grounds sealed in single-serve pods or capsules, designed for compatibility with specific brewing systems, sourced from a single geographic region or farm to emphasize traceability and distinct flavor profiles and maps the market through category boundaries, consumer segments, usage occasions, channel structure, brand and private-label positions, supply and availability logic, pricing and promotion mechanics, and country-level commercial roles. Historical analysis typically covers 2012 to 2025, with forward-looking scenarios through 2035.
This report is designed to answer the questions that matter most to brand, category, channel, and strategy teams in consumer-goods markets.
At its core, this report explains how the market for single origin coffee pods actually works as a consumer category. It is built to show where demand comes from, which need states and shopper missions matter most, which brands and private-label players shape the category, which channels control visibility and conversion, and where pricing power, repeat purchase, and margin are actually created.
Rather than framing the category through narrow technical attributes, the study breaks it into decision-grade commercial layers: product format, benefit platform, shopper segment, purchase occasion, pack-price architecture, channel environment, promotional intensity, route-to-market control, and company archetype. It is therefore useful both for teams shaping portfolio strategy and for teams executing growth through End-consumer (household), Procurement manager (office/hotel), Category manager (retailer), Foodservice distributor, and E-commerce platform buyer.
The report also clarifies how value pools differ across Home brewing, Office coffee service, Hotel in-room dining, and Café backup/supplement, how premiumization and private label reshape category economics, how retail concentration and route-to-market design affect scale, and which countries matter most for brand building, sourcing, packaging, and channel expansion.
The report is based on an independent market-intelligence methodology that combines category reconstruction, public company evidence, retail and channel mapping, pricing review, and multi-layer triangulation. It is built for consumer categories where no single public dataset captures the real structure of demand, brand power, promotion, and channel control.
The evidence stack typically combines company disclosures, investor materials, brand and retailer product pages, e-commerce assortment checks, packaging and claims analysis, public pricing references, trade statistics where relevant, regulatory and labeling guidance, and observable route-to-market evidence from distributors, retailers, merchandisers, and marketplace ecosystems.
The analytical model then reconstructs the category across the layers that matter commercially: category scope, shopper need states, consumer segments, pack-price ladders, brand and private-label hierarchy, channel power, promotional intensity, route-to-market design, and country role differences.
Special attention is given to Convenience and speed of preparation, Traceability and origin storytelling, Premiumization and taste exploration, Compatibility with installed machine base, Sustainability claims (recyclable, compostable pods), and At-home café experience. The objective is not only to size the market, but to explain where value pools sit, which segments drive mix and repeat purchase, which channels shape growth, and how leading brands defend or expand their positions across End-consumer (household), Procurement manager (office/hotel), Category manager (retailer), Foodservice distributor, and E-commerce platform buyer.
The report does not rely on survey-based opinion as its core evidence base. Instead, it uses observable commercial signals and structured public evidence to build a decision-grade view for brand, category, retail, e-commerce, investment, and market-entry teams.
This report defines single origin coffee pods as Pre-portioned coffee grounds sealed in single-serve pods or capsules, designed for compatibility with specific brewing systems, sourced from a single geographic region or farm to emphasize traceability and distinct flavor profiles and treats it as a branded consumer category rather than as a narrow technical product class. The objective is to capture the real commercial market that category, brand, trade-marketing, and channel teams are managing.
Scope is determined by how the category is sold, merchandised, priced, and chosen in market. That means the report follows product formats, claims, price tiers, pack architecture, need states, and retail environments that shape Home brewing, Office coffee service, Hotel in-room dining, and Café backup/supplement.
The study deliberately separates the category from adjacent baskets when they distort the economics or shopper logic of the market being measured. Typical exclusions therefore include Multi-origin/blended coffee pods, Instant coffee sachets, Whole bean coffee, Ground coffee for drip/filter, Coffee pods for office/bean-to-cup machines, Tea or other beverage pods, Coffee brewing machines and hardware, Coffee syrups and creamers, Coffee subscription services (as a standalone service), Coffee-related merchandise, and Ready-to-drink (RTD) canned/bottled coffee.
The report provides focused coverage of the Japan market and positions Japan within the wider global consumer-goods industry structure.
The geographic analysis explains local consumer demand conditions, brand and private-label balance, retail concentration, pricing tiers, import dependence, and the country’s strategic role in the wider category.
This study is designed for strategic and commercial users across brand-led consumer categories, including:
In many brand-driven, channel-sensitive, and consumer-demand-led markets, official trade and production statistics are not sufficient on their own to describe the true market. Product boundaries may cut across multiple tariff codes, several product categories may be bundled into the same official classification, and a meaningful share of activity may take place through customized services, captive supply, platform relationships, or technically specialized channels that are not directly visible in standard statistical datasets.
For this reason, the report is designed as a modeled strategic market study. It uses official and public evidence wherever it is reliable and scope-compatible, but it does not force the market into a purely statistical framework when doing so would reduce analytical quality. Instead, it reconstructs the market through the logic of demand, supply, technology, country roles, and company behavior.
This makes the report particularly well suited to products that are innovation-intensive, technically differentiated, capacity-constrained, platform-dependent, or commercially structured around specialized buyer-supplier relationships rather than standardized commodity trade.
The report typically includes:
Silver continues to be very noisy on Friday as we have pulled back a bit despite the fact that interest rates have dropped.
The 50-day EMA just above continues to offer a little bit of resistance and therefore I think it does make a certain amount of sense that we just hang out in this region.
Quite frankly, I believe this is a market that given enough time probably has to make a bigger decision, but as we head into the weekend it’s difficult to get overly aggressive with anything, let alone a market that is extraordinarily volatile like silver.
The XAG/USD market pulling back from here could open up the possibility of a test of the $70.00 level. The 200-day EMA sits just below there, and I think it opens up the possibility of even more support. To the upside, we have the $80.00 level, which of course is above the 50-day EMA.
The $80.00 level is essentially fair value from the longer-term consolidation range, which extends all the way to the $90.00 level. That $90.00 level I think is a target eventually, but it’s going to take a while to get there. If we were to break out above there, then I think you start to see silver behave extraordinarily bullish.
There is a lot of demand out there for the little bit of supply that we have for silver, but as long as interest rates remain relatively high, I think a lot of people are going to be very hesitant to buy a lot of silver. Furthermore, as we head into the weekend, we don’t know what the headlines will be, and therefore it makes sense that we have somewhat of a lackluster end.
Ready to trade our daily forex analysis and predictions? Here are the best Silver trading brokers to choose from.
Christopher Lewis has been trading Forex and has over 20 years experience in financial markets. Chris has been a regular contributor to Daily Forex since the early days of the site. He writes about Forex for several online publications, including FX Empire, Investing.com, and his own site, aptly named The Trader Guy. Chris favours technical analysis methods to identify his trades and likes to trade equity indices and commodities as well as Forex. He favours a longer-term trading style, and his trades often last for days or weeks.
As seen on: Pairs Of Aces Podcast,The Trader Guy, FXEmpire
The light sweet crude oil market has gone back and forth to show signs of hesitation, but at this point in time, we are sitting just below the $100 level.
We did bounce from the 50-day EMA and that does matter.
I think ultimately you have got a situation where if we can break above the $100 level, then $105 could be very real. Breaking below the 50-day EMA opens up a drop to the 50% Fibonacci retracement level of the bigger move going back several months, possibly even opening up a drop down to the 61.8% Fibonacci retracement level near the $86 level. The $105 level has proven to be very difficult, and if we can break above there, the $110 level is, in fact, where we go longer term.
All things being equal, I expect a lot of choppy behavior out of oil because, quite frankly, we have got a bunch of people in the news throwing headlines around to move the markets and not really anything fundamentally driven other than the fact that there is going to be a shortage, no matter what people think or want.
A move above the $110 level opens up the possibility of a move to the $120 level before it is all said and done, but I do not see that happening yet. All things being equal, I do think that we are trying to find some type of summer range from which to trade in, and with that, I look at this as a market that, quite frankly, if we get an opportunity to buy the dip, you probably want to.
I just would not look for huge gains. I think finding a little bit of value in oil makes a certain amount of sense this time of year, but again, remember, this could be moved by the latest tweet or press conference, you just do not know.
Ready to trade daily crude oil price analysis? We’ve shortlisted the best Forex Oil trading brokers in the industry for you.
Christopher Lewis has been trading Forex and has over 20 years experience in financial markets. Chris has been a regular contributor to Daily Forex since the early days of the site. He writes about Forex for several online publications, including FX Empire, Investing.com, and his own site, aptly named The Trader Guy. Chris favours technical analysis methods to identify his trades and likes to trade equity indices and commodities as well as Forex. He favours a longer-term trading style, and his trades often last for days or weeks.
As seen on: Pairs Of Aces Podcast,The Trader Guy, FXEmpire
Domestic coffee prices today
Opening the first trading session of the new week on May 25, 2026, the domestic coffee market did not maintain the excitement of the previous weekend. According to survey data, the purchase price of soybean kernels has simultaneously cooled down, losing from 300 to 400 VND/kg.
Dak Nong (old): Reduced by 400 VND, retreating to 87,700 VND/kg, but still continues to lead in purchasing prices throughout the region.
Dak Lak: Reduced by 400 VND, currently trading at the threshold of 87,600 VND/kg.
Gia Lai: Recorded a slight decrease of 300 VND, listed at the same level as Dak Lak at 87,600 VND/kg.
Lam Dong: Reduced by 400 VND, pushing the purchase price down to the lowest level in the region at 87,000 VND/kg.
Notably, pepper today also recorded a decrease of 1,000 VND, falling to the level of 141,000 VND/kg. Conversely, the USD/VND exchange rate at Vietcombank slightly increased by 2 VND, currently listed at 26,132 VND/USD.
World coffee prices
Due to time zone differences, as of noon today (Vietnam time), both ICE London and New York futures exchanges have not yet entered the official order matching session of Monday. Electronic boards are currently temporarily frozen, maintaining the opposite closing level of last Friday:
London Stock Exchange (Robusta): July futures (RMN26) anchored at a high of $3,456/ton (maintaining the breakthrough +57 USD from the end of the week).
New York Stock Exchange (Arabica): July futures (KCN26) sideways at 272.35 cents/lb (currently in the lowest price range in 1.5 years).
Coffee market outlook
The coffee market is currently caught between two opposing macroeconomic information flows, creating a fierce tug-of-war in investor sentiment:
The current high price of Robusta is greatly supported by the drought in Vietnam. According to the weather forecasting agency, rainfall in the Central Highlands in the past time is still very scattered and scarce, directly threatening the development of young coffee fruit trees. Severe drought has caused ponds and lakes in Gia Lai and many Central Highlands regions to dry up to the bottom, thousands of hectares of coffee and pepper fell into a state of thirst.
In addition, the “Super El Niño” specter (with a 67% probability of occurring according to NOAA) is raising concerns that the rainy season in Brazil will be delayed to September and October, with the risk of devastating the 2026/27 crop. Arabica inventories hitting a 3-month low (449,567 bags) is also a safe buffer zone to prevent prices from falling freely.
Although the weather is very risky, the actual crop season of Brazil is being assessed as extremely good. “Big players” such as Marex and StoneX continuously emphasize the production figure of 75.3 – 75.9 million bags, pushing the global surplus in 2026 to a record level of 10 million bags. At the same time, Vietnam’s export data increased sharply by 15.8% (reaching 810,000 tons in the first 4 months of the year) along with the fact that Robusta inventories on the London exchange have just recovered to a 6-week high (3,968 lots) are burdens hindering price increases.
The slight downward correction at the beginning of the week in the domestic market shows the caution of traders ahead of the new South American crop line pouring into the market.
Gold (XAU/USD) trades lower for the second consecutive day on Friday, but remains contained within previous ranges, with downside attempts limited above the $4,500 line for now. Market volatility remains subdued on Friday, with traders awaiting developments from the US-Iran war to make investment decisions.
The confusing situation in the Middle East is providing moderate support to the safe-haven US Dollar, keeping the US Dollar Index (DXY) steady near six-week highs and Gold bulls in check.
The latest news reports that Tehran is reviewing a peace proposal submitted by the US, with both parties far apart on Iran’s nuclear activities and control of the Strait of Hormuz. US Secretary of State Marco Rubio, however, said on Thursday that there was “some progress” in the talks with Tehran, which is feeding a moderate optimism
XAU/USD trades at $4,522, holding a capped tone, with price action nearing the tip of a small triangle pattern. The Relative Strength Index (RSI) hovers around 45, hinting at consolidative, yet slightly negative momentum, while the Moving Average Convergence Divergence (MACD) stays in positive territory but has started to ease, suggesting that recent upside attempts are losing traction
Triangles are considered continuation patterns; thus, in this case, a bearish outcome is favoured. The base of the triangle is now at $4,500, but the key support area is the May 20 low near $4,450. A break of this level exposes late March lows at $4,350 and $4,306.
A confirmation above $4,580 (May 18 highs), on the other hand, would negate the bearish view and shift to the May 11 and 12 lows around the $4,650 ahead of May’s top in the $4,770 area.
(The technical analysis of this story was written with the help of an AI tool.)
Gold has played a key role in human’s history as it has been widely used as a store of value and medium of exchange. Currently, apart from its shine and usage for jewelry, the precious metal is widely seen as a safe-haven asset, meaning that it is considered a good investment during turbulent times. Gold is also widely seen as a hedge against inflation and against depreciating currencies as it doesn’t rely on any specific issuer or government.
Central banks are the biggest Gold holders. In their aim to support their currencies in turbulent times, central banks tend to diversify their reserves and buy Gold to improve the perceived strength of the economy and the currency. High Gold reserves can be a source of trust for a country’s solvency. Central banks added 1,136 tonnes of Gold worth around $70 billion to their reserves in 2022, according to data from the World Gold Council. This is the highest yearly purchase since records began. Central banks from emerging economies such as China, India and Turkey are quickly increasing their Gold reserves.
Gold has an inverse correlation with the US Dollar and US Treasuries, which are both major reserve and safe-haven assets. When the Dollar depreciates, Gold tends to rise, enabling investors and central banks to diversify their assets in turbulent times. Gold is also inversely correlated with risk assets. A rally in the stock market tends to weaken Gold price, while sell-offs in riskier markets tend to favor the precious metal.
The price can move due to a wide range of factors. Geopolitical instability or fears of a deep recession can quickly make Gold price escalate due to its safe-haven status. As a yield-less asset, Gold tends to rise with lower interest rates, while higher cost of money usually weighs down on the yellow metal. Still, most moves depend on how the US Dollar (USD) behaves as the asset is priced in dollars (XAU/USD). A strong Dollar tends to keep the price of Gold controlled, whereas a weaker Dollar is likely to push Gold prices up.
Indonesia’s decaf coffee variety pack market sits at the intersection of two powerful consumer trends: rising specialty coffee culture and a growing desire to reduce daily caffeine intake. While Indonesia is a major global producer of arabica and robusta green beans, its domestic decaffeination processing infrastructure is negligible, meaning nearly all decaf coffee products consumed domestically rely on imported roasted or pre-blended decaf stock. The variety pack format—offering multiple origins, roast profiles, or brew methods (whole bean, ground, single-serve pods) in a single retail unit—is particularly suited to exploration-oriented consumers and gift-buying occasions.
The product is defined as a tangible consumer packaged good sold through modern grocery, specialty food stores, e‑commerce platforms, and direct-to-consumer subscription channels. Key decaffeination methods represented in the Indonesian market include Swiss Water Process, CO₂ decaffeination, and direct solvent processes, though chemical-free claims are increasingly used as a premium positioning tool. The market is heavily influenced by import dynamics, branding strategies, and the degree of consumer education about decaf quality, rather than by upstream agricultural factors. Demand is concentrated in Java, Bali, and Sumatra’s urban centres, with Jakarta alone accounting for an estimated 30–40% of national decaf variety pack sales.
The overall Indonesia coffee retail market was valued in the range of USD 2.5–3.5 billion in 2025, with decaf coffee occupying a low-single-digit share. Decaf variety packs represent a subset of that decaf category, accounting for roughly 15–20% of decaf coffee sales by value, the rest being single-origin decaf bags or regular decaf blends. On a volume basis, the variety pack segment is estimated to have sold between 250 and 400 tonnes of decaf coffee equivalent in 2025, growing at a 12–15% compound rate over the prior three years, compared to 6–8% for the overall packaged coffee market.
From 2026 to 2035, demand is expected to maintain a trajectory of 9–13% annual growth in volume terms, driven by urbanisation, rising disposable incomes, and the mainstreaming of evening coffee consumption. The value growth rate will likely be higher, in the 11–16% range, as the mix shifts toward premium-process decaf and multi-format variety packs. By 2035, the segment could roughly triple in volume compared to 2026, though it will remain a niche—probably still below 3% of total coffee consumption in Indonesia—due to the strong cultural preference for traditional caffeinated coffee and the price premium of decaf.
Three format segments dominate the Indonesia decaf variety pack market. Ground decaf packs hold the largest share, approximately 40–45% of sales by volume, driven by compatibility with standard drip brewers and pour-over devices used in Indonesian households. Whole bean decaf packs account for 25–30%, favoured by specialty coffee enthusiasts who grind at home, while single-serve pod/capsule packs capture 18–22% and are the fastest-growing format, benefiting from the proliferation of Nespresso‑compatible and Dolce Gusto‑compatible systems in urban homes. Mixed-format discovery packs—containing a combination of whole bean, ground, and pods—represent less than 10% but carry the highest average selling price per gram and are heavily used in subscription and gift channels.
In terms of application, at-home consumption is the dominant end-use, accounting for 55–65% of variety pack sales. Office and workplace consumption (15–20%) is growing as corporate gifting programmes adopt decaf variety packs for wellness-focused employee incentives. Subscription/discovery services (10–15%) are the fastest channel, with monthly recurring deliveries of rotating decaf origins and methods. Hospitality and foodservice trial sizing (5–10%) remains small but strategically important for brand-building; hotels and upscale cafes use single-serve decaf packs as a guest amenity or tasting menu component.
Buyer groups span end consumers (direct-to-consumer e‑commerce and store purchases), grocery buyers managing category resets, specialty food store buyers, corporate procurement officers for gifting, and hotel food and beverage managers.
Retail pricing for decaf variety packs in Indonesia exhibits a wide range, from approximately IDR 45,000–60,000 per 250 g for a basic private‑label ground variety pack to IDR 120,000–200,000 per 250 g for a premium Swiss Water Process single‑origin whole bean discovery pack. The key cost drivers cascade from green bean commodity prices (arabica at approximately USD 2.50–4.00 per kg FOB origin), to the decaffeination premium (USD 1.00–2.50 per kg of green bean, depending on method and certification), to roasting, packaging, and branding margins. Variety packs incur additional costs from smaller batch sizes, multi‑origin sourcing, and custom packaging inserts.
The decaffeination premium is the single largest factor separating decaf from regular coffee prices. Chemical-free processes (Swiss Water, CO₂) command a 40–60% premium over conventional solvent decaf, and this differential is passed through to the retail level. Indonesian importers also face 5–10% import duties on finished roasted decaf coffee under HS codes 090121 and 090122, plus logistics costs from processing hubs in Switzerland, Germany, Canada, or the United States. As a result, decaf variety packs are priced 35–50% above equivalent regular coffee variety packs in Indonesian retail, which constrains adoption in lower‑income demographics but reinforces the premium “health and specialist” positioning that drives the higher‑margin segment.
The competitive landscape in Indonesia’s decaf variety pack market consists of three archetypes. Global brand owners and category leaders—such as Nestlé (Nescafé Gold Decaf, Dolce Gusto Decaf capsules), JAB Holding (Jacobs, Douwe Egberts), and illy—leverage established distribution networks and brand trust, offering decaf variety packs primarily through modern trade and e‑commerce platforms. Their market share is estimated at 40–50% by value, driven by strong shelf presence and promotional spending.
Specialty coffee roasters and direct-to-consumer brands account for 25–35% of the market. These include Indonesian roasters such as Anomali Coffee, Tanamera Coffee, and Common Grounds, which source decaffeinated green beans from overseas, roast in‑country, and assemble variety packs for their own cafes and online stores. They compete on origin storytelling and process transparency. Private‑label and retailer‑brand decaf variety packs (10–15% share) are offered by major grocery chains and discounters, typically sourced from contract roasters in Singapore or Malaysia.
Online‑first subscription boxes, both local (e.g., Kopi Pack, Month & Co.) and international (Bean Box, Trade Coffee), represent the fastest-growing competitive segment, though still small in absolute share (5–10%). Competition is intensifying, with price promotions and free‑shipping offers being the primary tools to drive trial in a category where repeat purchase is still being established.
Indonesia has no commercially significant domestic decaffeination plants. The country is a major producer of green coffee beans (ranked third or fourth globally), but virtually all beans destined for the domestic decaf market must be shipped to decaffeination facilities in Switzerland, Germany, Canada, or the United States for processing, then re‑imported as decaffeinated green beans or already roasted decaf coffee. A few specialty roasters, such as Tanamera Coffee, have experimented with small‑lot contract decaffeination runs in Europe and then bring the processed beans back to Indonesia for roasting and packaging.
The supply model is therefore import‑led. Monthly containerised shipments of decaffeinated green beans (typically 18–20 metric tonnes per container) arrive at Tanjung Priok (Jakarta) and Tanjung Perak (Surabaya) ports. Roasters in‑country perform the roasting, blending, grinding, and packaging functions required to assemble variety packs. Lead times from order of green decaf beans to finished packs on shelf range from 8 to 16 weeks, depending on shipping schedules and customs clearance. This structure makes the market vulnerable to global logistics disruptions and to capacity constraints at preferred decaffeination facilities, which often allocate capacity to larger Western buyers first. Domestic supply availability is thus a function of foreign processing capacity, not local agricultural output.
Indonesia is a net importer of decaffeinated coffee products. Customs data under HS codes 090121 (roasted, not decaffeinated) and 090122 (roasted, decaffeinated) indicate that over 90% of decaffeinated roasted coffee entering Indonesia comes from Switzerland, Germany, and the United States—countries that host the major decaffeination plants. Decaf variety packs, as manufactured consumer goods, are imported either as finished retail products (with branding and packaging already applied) or as bulk decaf roasted beans that are then packed locally. The latter route is preferred by domestic roasters because it allows customisation of the variety pack assortment and avoids higher duties on finished retail goods.
Trade flows are further complicated by the lack of preferential trade agreements between Indonesia and most decaffeination hubs, resulting in import duties of 5–10% on roasted decaf coffee plus 10% VAT. Re‑export of decaf coffee from Indonesia is negligible—the country’s role is that of a consumer market, not a processing hub. A small amount of decaf variety packs may be re‑exported to neighbouring countries (Singapore, Malaysia) as part of regional e‑commerce fulfilment, but this volume is below 2% of total imports. The trade structure underscores the market’s dependency on the efficiency and cost competitiveness of global decaffeination supply chains.
Modern grocery retailers (hypermarkets, supermarkets, and convenience stores) are the primary distribution channel for decaf variety packs in Indonesia, accounting for 50–55% of sales. Chains such as Transmart, Hypermart, Superindo, and Ranch Market stock both branded and private‑label decaf variety packs in dedicated coffee aisles and health‑food sections. Specialty food stores and coffee shops (15–20%) serve as discovery channels where consumers first encounter premium decaf variety packs, often through in‑cafe retail displays. E‑commerce platforms, led by Tokopedia, Shopee, and Lazada, together capture 20–25% of sales, with the share rising 3–5 percentage points per year as online grocery adoption deepens in urban areas.
Direct‑to‑consumer subscription models represent the smallest but most dynamic channel (5–10%). These buyers are typically middle‑ to high‑income urban consumers aged 25–45, purchasing out of interest in wellness and coffee exploration rather than daily necessity. Business buyers include corporate procurement managers (for gifting), hotel F&B directors, and office coffee service operators. Each buyer group has distinct purchasing criteria: grocery category managers focus on rotation speed and margin, while corporate buyers prioritise packaging aesthetics and delivery reliability. The distribution landscape is fragmenting as DTC brands bypass traditional retail margins, pressuring established brand owners to invest in their own e‑commerce storefronts and subscription offerings.
The primary regulatory framework for decaf coffee variety packs in Indonesia is the National Agency for Drug and Food Control (BPOM) regulation on processed food registration and labelling. All decaf coffee products must be registered with BPOM and bear a distribution permit number (MD/ML). Labelling requirements include a list of ingredients, nutrition information, net weight, and the declaration of “decaffeinated” if the caffeine content is below 0.1% on a dry‑weight basis. The use of specific decaffeination process claims (e.g., “Swiss Water Process”, “CO₂ decaffeinated”, “chemically free”) is permitted only if substantiated by a certificate of analysis from the processing facility. Misleading claims can result in permit suspension.
Additional voluntary certifications—Organic (SNI 6729 or international equivalents), Fair Trade, and Rainforest Alliance—are increasingly used as differentiators in the variety pack market, particularly by specialty roasters and DTC brands. The Indonesian National Standard (SNI) for coffee (SNI 01‑3542) sets limits on maximum allowable caffeine content for decaf (0.1% m/m), though enforcement in the variety pack segment relies on batch testing. E‑commerce regulations under Government Regulation No. 80/2019 require online sellers of processed foods to display BPOM registration numbers prominently.
As the category grows, BPOM is expected to issue more specific guidance on the labelling of variety packs that contain multiple roast profiles or origins, particularly regarding allergen cross‑contact and lot traceability across the pack’s components.
Over the 2026–2035 forecast horizon, the Indonesia decaf coffee variety pack market is projected to grow at a compound annual rate of 10–14% in value terms, outpacing both the regular coffee market (6–8%) and the broader packaged food segment. By 2035, the segment’s volume could double to 2.5–3 times the 2026 level, driven by three structural factors: the expansion of the health‑conscious middle class, the maturation of coffee culture in secondary cities (Bandung, Surabaya, Medan, Makassar), and the normalisation of evening coffee occasions as part of Indonesian social life.
Premium sub‑segments—single‑origin decaf packs with chemical‑free process claims, subscription discovery boxes, and limited‑edition variety packs—will gain share from entry‑level private‑label products, potentially accounting for 55–65% of segment value by 2035. Single‑serve pod variety packs will grow at the fastest rate (15–18% CAGR), while whole bean and ground formats see steady 8–11% growth. The market will remain import‑dependent, but a moderate increase in local roasting and packing of decaf beans (sourced from foreign decaffeination plants) could reduce landed costs by 5–10% relative to fully imported finished packs. Competitive intensity will rise as global brand owners deepen local distribution and small roasters scale their DTC operations, leading to margin compression in the mid‑priced tier.
The most significant opportunity lies in consumer education and trial conversion. With decaf variety pack penetration still under 2% of coffee‑drinking households, investments in experiential marketing—pop‑up tasting kiosks, workplace samplers, and influencer‑led brewing tutorials—can unlock a substantial latent demand. The evening and after‑dinner coffee occasion is virtually untapped in Indonesia; positioning decaf variety packs as the “perfect night‑cap coffee” could create a new daily usage ritual. Subscription models, in particular, offer a recurring revenue stream and a data loop to understand flavour preferences across regions and roast profiles.
A second opportunity is in the premium gifting segment. The variety pack format, with its visual differentiation and sampling value, is ideally suited for corporate gifts, festive hampers, and wedding favours. Brands that develop elegant, customisable packaging with local design cues can command wholesale prices 40–60% above standard retail. Furthermore, as the foodservice sector recovers and expands, hotels and cafes looking to differentiate their amenity programmes will seek out exclusive decaf variety packs tailored to their brand identity.
Finally, there is a structural opening for a domestic decaffeination facility—potentially in Java near major ports—to reduce import lead times and costs, although the capital investment (USD 10–20 million for a moderate‑scale plant) and reliance on specialty‑grade green bean supply remain significant barriers. For now, the most accessible opportunities are in branding, distribution, and direct consumer engagement, rather than upstream processing.
This report is an independent strategic category study of the market for decaf coffee variety pack in Indonesia. It is designed for brand owners, general managers, category leaders, trade-marketing teams, e-commerce teams, retail partners, distributors, investors, and market entrants that need a clear read on where growth sits, which brands control the category, how pricing and promotion shape demand, and which channels matter most for scale and margin.
The framework is built for Packaged Coffee & Beverages markets within consumer goods, where performance is driven by need states, shopper missions, brand hierarchies, price-pack architecture, retail execution, promotional intensity, and route-to-market control rather than by a narrow technical specification alone. It defines decaf coffee variety pack as A curated assortment of decaffeinated coffee products, typically including multiple roast profiles, origins, or brewing formats, sold as a single SKU for consumer trial, convenience, or subscription and maps the market through category boundaries, consumer segments, usage occasions, channel structure, brand and private-label positions, supply and availability logic, pricing and promotion mechanics, and country-level commercial roles. Historical analysis typically covers 2012 to 2025, with forward-looking scenarios through 2035.
This report is designed to answer the questions that matter most to brand, category, channel, and strategy teams in consumer-goods markets.
At its core, this report explains how the market for decaf coffee variety pack actually works as a consumer category. It is built to show where demand comes from, which need states and shopper missions matter most, which brands and private-label players shape the category, which channels control visibility and conversion, and where pricing power, repeat purchase, and margin are actually created.
Rather than framing the category through narrow technical attributes, the study breaks it into decision-grade commercial layers: product format, benefit platform, shopper segment, purchase occasion, pack-price architecture, channel environment, promotional intensity, route-to-market control, and company archetype. It is therefore useful both for teams shaping portfolio strategy and for teams executing growth through End Consumer (DTC), Grocery Retailer (Category Manager), Specialty Food Store Buyer, Corporate Procurement (Gifting), and Hospitality/Foodservice Buyer.
The report also clarifies how value pools differ across Daily caffeine-free consumption, Evening coffee occasion, Health-conscious & sensitive consumer routines, and Gifting & trial for new decaf drinkers, how premiumization and private label reshape category economics, how retail concentration and route-to-market design affect scale, and which countries matter most for brand building, sourcing, packaging, and channel expansion.
The report is based on an independent market-intelligence methodology that combines category reconstruction, public company evidence, retail and channel mapping, pricing review, and multi-layer triangulation. It is built for consumer categories where no single public dataset captures the real structure of demand, brand power, promotion, and channel control.
The evidence stack typically combines company disclosures, investor materials, brand and retailer product pages, e-commerce assortment checks, packaging and claims analysis, public pricing references, trade statistics where relevant, regulatory and labeling guidance, and observable route-to-market evidence from distributors, retailers, merchandisers, and marketplace ecosystems.
The analytical model then reconstructs the category across the layers that matter commercially: category scope, shopper need states, consumer segments, pack-price ladders, brand and private-label hierarchy, channel power, promotional intensity, route-to-market design, and country role differences.
Special attention is given to Health & wellness trends reducing caffeine intake, Evening/afternoon coffee occasion growth, Aging population & caffeine sensitivity, Premiumization & exploration in decaf segment, and Subscription & discovery box popularity. The objective is not only to size the market, but to explain where value pools sit, which segments drive mix and repeat purchase, which channels shape growth, and how leading brands defend or expand their positions across End Consumer (DTC), Grocery Retailer (Category Manager), Specialty Food Store Buyer, Corporate Procurement (Gifting), and Hospitality/Foodservice Buyer.
The report does not rely on survey-based opinion as its core evidence base. Instead, it uses observable commercial signals and structured public evidence to build a decision-grade view for brand, category, retail, e-commerce, investment, and market-entry teams.
This report defines decaf coffee variety pack as A curated assortment of decaffeinated coffee products, typically including multiple roast profiles, origins, or brewing formats, sold as a single SKU for consumer trial, convenience, or subscription and treats it as a branded consumer category rather than as a narrow technical product class. The objective is to capture the real commercial market that category, brand, trade-marketing, and channel teams are managing.
Scope is determined by how the category is sold, merchandised, priced, and chosen in market. That means the report follows product formats, claims, price tiers, pack architecture, need states, and retail environments that shape Daily caffeine-free consumption, Evening coffee occasion, Health-conscious & sensitive consumer routines, and Gifting & trial for new decaf drinkers.
The study deliberately separates the category from adjacent baskets when they distort the economics or shopper logic of the market being measured. Typical exclusions therefore include Single-variety decaf coffee bags, Caffeinated coffee variety packs, Instant decaf coffee jars, Ready-to-drink (RTD) decaf coffee beverages, Decaf tea or other caffeine-free products, Coffee equipment & brewers, Coffee syrups & flavorings, Caffeinated coffee subscriptions, Specialty tea samplers, and Functional beverage packs.
The report provides focused coverage of the Indonesia market and positions Indonesia within the wider global consumer-goods industry structure.
The geographic analysis explains local consumer demand conditions, brand and private-label balance, retail concentration, pricing tiers, import dependence, and the country’s strategic role in the wider category.
This study is designed for strategic and commercial users across brand-led consumer categories, including:
In many brand-driven, channel-sensitive, and consumer-demand-led markets, official trade and production statistics are not sufficient on their own to describe the true market. Product boundaries may cut across multiple tariff codes, several product categories may be bundled into the same official classification, and a meaningful share of activity may take place through customized services, captive supply, platform relationships, or technically specialized channels that are not directly visible in standard statistical datasets.
For this reason, the report is designed as a modeled strategic market study. It uses official and public evidence wherever it is reliable and scope-compatible, but it does not force the market into a purely statistical framework when doing so would reduce analytical quality. Instead, it reconstructs the market through the logic of demand, supply, technology, country roles, and company behavior.
This makes the report particularly well suited to products that are innovation-intensive, technically differentiated, capacity-constrained, platform-dependent, or commercially structured around specialized buyer-supplier relationships rather than standardized commodity trade.
The report typically includes:
I wrote on 17th May that the best trades for the week would be:
Long of Brent Crude Futures (or a suitable ETF) if we get a daily close above $114.46. This did not set up.
Long of Gasoline Futures (or UGA ETF) following a daily close above $3.7382. This did not set up.
Long of the US 10-Year Treasury Yield future. This gave a loss of 0.52%.
The overall loss of 0.52% last week averaged a per asset loss of 0.17%.
A summary of last week’s most important data in the market:
US FOMC Meeting Minutes – marginally more hawkish than expected, so may have given a very slight tailwind for the USD.
UK CPI (inflation) – lower than expected, with the annualized rate falling to 2.8%. This will take some pressure off the Bank of England and may have led the British Pound to a weaker price than it might otherwise have shown.
Canadian CPI (inflation) – lower than expected, with the annualized rate falling to 2.8%. This will take some pressure off the Bank of Canada and may have led the Canadian Dollar to a weaker price than it might otherwise have shown.
UK Flash Services & Manufacturing PMI – these growth indicators outperformed expectations, which may give investors a bit more confidence in the UK.
Australia Unemployment Rate – this rose unexpectedly from 4.3% to 4.5%.
UK Claimant Count Change (Unemployment Claims) – this was broadly in line with expectations.
Last week saw global stock markets edge higher, with the US Dow Jones 30 reaching a new record high, and other major indices close higher near their respective record highs, as did the major Japanese and South Korean stock indices. Markets are being led higher by strong earnings data and continuing bullish sentiment on the AI sector.
Bond yields generally remained elevated on inflation fears, although many yields came off their highs as both UK and Canadian inflation data came in lower than expected.
Crude Oil remained elevated as uncertainty continued over the ongoing standoff between the USA and Iran.
Crypto and Forex markets were relatively quiet. Commodities were mixed.
The news is dominated by an emerging confirmation by President Trump that the USA and Iran will shortly sign a memorandum of understanding. It seems that this will provide a 60-day period where the US blockade of Iran will end and the Strait of Hormuz will reopen, but the exact terms beyond that remain unclear.
The effect of this news, assuming the memorandum is shortly signed, will almost certainly be to send stock markets and risk assets higher as soon as markets open this week, while yields and crude oil will fall. In the Forex market, we are likely to see firm rises in the AUD/USD and AUD/JPY currency pair and cross.
Beyond that, the coming week’s most important data points, in order of likely importance, are:
US Core PCE Price Index
US Advance GDP
Australian CPI (inflation)
Reserve Bank of New Zealand Policy Meeting – no change to the Official Cash Rate is expected.
Canadian GDP
Monday is a public holiday in the USA, the UK, Germany, France, and Switzerland.
Currency Price Changes and Interest Rates
For the month of May, as there is no clear trend in the US Dollar, I made no monthly forecast.
This week, I made no weekly forecast, as there were no unusual movements in the Forex market last week.
Volatility decreased last week, with only 15% of currency pairs moving by more than 1% in value. Next week’s volatility is likely to be higher as there are several high impact data items due, and the effect of the emerging deal between the USA and Iran.
You can trade these forecasts in a real or demo Forex brokerage account.
Key Support and Resistance Levels
The US Dollar printed an unusually small doji candlestick last week, which is suggestive of indecision or indifference by the market.
We have no long-term trend, and the greenback has been consolidating within its current range for an entire year now.
It is possible that the emerging news of a deal between the USA and Iran might reduce perceived inflationary pressure which could be a dovish influence upon Dollar yields, and this might send the Dollar lower over the coming week. However, several other currencies are facing the same situation as oil shock inflation feeds through everywhere, so as it is all relative, it might now have much influence.
What these factors point to is a Dollar which is likely to range slightly with unpredictable price action. It is not in a directionally tradable condition. Therefore, I think it makes sense to base trades over the coming week on other factors and to just ignore the US Dollar as a factor even if you are trading something priced in Dollars.
US Dollar Index Weekly Price Chart
The AUD/USD currency pair printed a doji candlestick last week, that was slightly bearish, although the price action is not far from the 3.5-year high price which this currency pair made three weeks ago. The price has been ranging between support and resistance, and this is probably because the world was waiting to see whether the USA and Iran would resume a kinetic war or reach some kind of deal to end the war and the entire standoff.
It now seems very likely that a deal, or at least the beginning of one, has been reached if not fully signed and agreed. I think it is very likely that this will cause a substantial improvement in risk sentiment, and as that happens, this pair will probably open with a gap higher when the Forex market opens for this week. Technical factors will initially be relatively unimportant but could become significant after a few hours if the price becomes over-extended.
This is a pair to keep your eye on if factors move towards progress of this deal. If the price breaks above its recent 3.5 year high, it will be trading in blue sky and could move higher with ease. The AUD/JPY currency cross could do even better in the same direction.
I see this currency pair as likely to advance over the coming week.
AUD/USD Weekly Price Chart
The S&P 500 Index rose firmly last week, closing not far below 7,500 which is near the record high it made just a couple of weeks ago.
It was driven higher by NVIDIA’s surprisingly excellent earnings data, and possibly by increased optimism over a deal between the USA and Iran to end the war.
Developments over this weekend have confirmed that some kind of deal, or at least the start of a deal, is probably extremely close, and if this is borne out, it will only send the market even higher, likely to new record highs where it will trade in blue sky.
The big round number at 7,500 might be acting as resistance, but once that is overcome, the price could go all the way to 8,000 before that happens again.
I think unless something goes awry with the deal, we will see this Index advance over the coming week, so I see this Index as a buy.
S&P 500 Index Weekly Price Chart
Everything I wrote above about the S&P 500 Index applies even more strongly to the NASDAQ 100 Index, which is doing even better as it contains a stronger concentration of booming AI-driven companies. The bullish momentum is a little stronger here, and the NASDAQ 100 has a notably higher average annual return than the S&P 500 Index.
I see this Index as a buy.
NASDAQ 100 Index Weekly Price Chart
Brent Crude Oil futures fell over the week, mostly due to increasing expectations that the USA and Iran will conclude a deal that would end the blockade of the Strait of Hormuz by both parties.
These expectations seem to be justified now, with President Trump stating that a memorandum of understanding is all but signed, with the first step the reopening of the Strait and a normalization in the Gulf.
This is extremely likely to lead to a significant gap lower when the market opens this week.
Of course, the deal could fall apart. As more details of the deal and related negotiations are revealed, there will likely be more uncertainty, and a stabilization of price movement.
Overall, it looks likely that we will see a decline in the price over the coming week, but this is still a dangerous bet to make over several days.
Day traders might want to look for short trades here on short time frames when there is bearish momentum, especially early in the week.
Brent Crude Oil Futures Weekly Price Chart
I see the best trades this week as:
Long of the AUD/USD currency pair.
Long of the S&P 500 Index.
Long of the NASDAQ 100 Index.
Ready to trade our Forex weekly forecast? Check out our list of the top Forex brokers.
This report is an independent strategic category study of the market for decaf coffee variety pack in China. It is designed for brand owners, general managers, category leaders, trade-marketing teams, e-commerce teams, retail partners, distributors, investors, and market entrants that need a clear read on where growth sits, which brands control the category, how pricing and promotion shape demand, and which channels matter most for scale and margin.
The framework is built for Packaged Coffee & Beverages markets within consumer goods, where performance is driven by need states, shopper missions, brand hierarchies, price-pack architecture, retail execution, promotional intensity, and route-to-market control rather than by a narrow technical specification alone. It defines decaf coffee variety pack as A curated assortment of decaffeinated coffee products, typically including multiple roast profiles, origins, or brewing formats, sold as a single SKU for consumer trial, convenience, or subscription and maps the market through category boundaries, consumer segments, usage occasions, channel structure, brand and private-label positions, supply and availability logic, pricing and promotion mechanics, and country-level commercial roles. Historical analysis typically covers 2012 to 2025, with forward-looking scenarios through 2035.
This report is designed to answer the questions that matter most to brand, category, channel, and strategy teams in consumer-goods markets.
At its core, this report explains how the market for decaf coffee variety pack actually works as a consumer category. It is built to show where demand comes from, which need states and shopper missions matter most, which brands and private-label players shape the category, which channels control visibility and conversion, and where pricing power, repeat purchase, and margin are actually created.
Rather than framing the category through narrow technical attributes, the study breaks it into decision-grade commercial layers: product format, benefit platform, shopper segment, purchase occasion, pack-price architecture, channel environment, promotional intensity, route-to-market control, and company archetype. It is therefore useful both for teams shaping portfolio strategy and for teams executing growth through End Consumer (DTC), Grocery Retailer (Category Manager), Specialty Food Store Buyer, Corporate Procurement (Gifting), and Hospitality/Foodservice Buyer.
The report also clarifies how value pools differ across Daily caffeine-free consumption, Evening coffee occasion, Health-conscious & sensitive consumer routines, and Gifting & trial for new decaf drinkers, how premiumization and private label reshape category economics, how retail concentration and route-to-market design affect scale, and which countries matter most for brand building, sourcing, packaging, and channel expansion.
The report is based on an independent market-intelligence methodology that combines category reconstruction, public company evidence, retail and channel mapping, pricing review, and multi-layer triangulation. It is built for consumer categories where no single public dataset captures the real structure of demand, brand power, promotion, and channel control.
The evidence stack typically combines company disclosures, investor materials, brand and retailer product pages, e-commerce assortment checks, packaging and claims analysis, public pricing references, trade statistics where relevant, regulatory and labeling guidance, and observable route-to-market evidence from distributors, retailers, merchandisers, and marketplace ecosystems.
The analytical model then reconstructs the category across the layers that matter commercially: category scope, shopper need states, consumer segments, pack-price ladders, brand and private-label hierarchy, channel power, promotional intensity, route-to-market design, and country role differences.
Special attention is given to Health & wellness trends reducing caffeine intake, Evening/afternoon coffee occasion growth, Aging population & caffeine sensitivity, Premiumization & exploration in decaf segment, and Subscription & discovery box popularity. The objective is not only to size the market, but to explain where value pools sit, which segments drive mix and repeat purchase, which channels shape growth, and how leading brands defend or expand their positions across End Consumer (DTC), Grocery Retailer (Category Manager), Specialty Food Store Buyer, Corporate Procurement (Gifting), and Hospitality/Foodservice Buyer.
The report does not rely on survey-based opinion as its core evidence base. Instead, it uses observable commercial signals and structured public evidence to build a decision-grade view for brand, category, retail, e-commerce, investment, and market-entry teams.
This report defines decaf coffee variety pack as A curated assortment of decaffeinated coffee products, typically including multiple roast profiles, origins, or brewing formats, sold as a single SKU for consumer trial, convenience, or subscription and treats it as a branded consumer category rather than as a narrow technical product class. The objective is to capture the real commercial market that category, brand, trade-marketing, and channel teams are managing.
Scope is determined by how the category is sold, merchandised, priced, and chosen in market. That means the report follows product formats, claims, price tiers, pack architecture, need states, and retail environments that shape Daily caffeine-free consumption, Evening coffee occasion, Health-conscious & sensitive consumer routines, and Gifting & trial for new decaf drinkers.
The study deliberately separates the category from adjacent baskets when they distort the economics or shopper logic of the market being measured. Typical exclusions therefore include Single-variety decaf coffee bags, Caffeinated coffee variety packs, Instant decaf coffee jars, Ready-to-drink (RTD) decaf coffee beverages, Decaf tea or other caffeine-free products, Coffee equipment & brewers, Coffee syrups & flavorings, Caffeinated coffee subscriptions, Specialty tea samplers, and Functional beverage packs.
The report provides focused coverage of the China market and positions China within the wider global consumer-goods industry structure.
The geographic analysis explains local consumer demand conditions, brand and private-label balance, retail concentration, pricing tiers, import dependence, and the country’s strategic role in the wider category.
This study is designed for strategic and commercial users across brand-led consumer categories, including:
In many brand-driven, channel-sensitive, and consumer-demand-led markets, official trade and production statistics are not sufficient on their own to describe the true market. Product boundaries may cut across multiple tariff codes, several product categories may be bundled into the same official classification, and a meaningful share of activity may take place through customized services, captive supply, platform relationships, or technically specialized channels that are not directly visible in standard statistical datasets.
For this reason, the report is designed as a modeled strategic market study. It uses official and public evidence wherever it is reliable and scope-compatible, but it does not force the market into a purely statistical framework when doing so would reduce analytical quality. Instead, it reconstructs the market through the logic of demand, supply, technology, country roles, and company behavior.
This makes the report particularly well suited to products that are innovation-intensive, technically differentiated, capacity-constrained, platform-dependent, or commercially structured around specialized buyer-supplier relationships rather than standardized commodity trade.
The report typically includes:
At 9 a.m. Eastern Time today, oil was priced at $104.68 per barrel with Brent serving as the benchmark (we’ll explain different benchmarks later in this article). That’s a drop of $4.08 compared with yesterday morning and around $40.46 higher than the price one year ago.
It’s impossible to forecast oil prices with detailed precision. Many different elements affect the market, but ultimately it boils down to supply and demand. When worries about economic recession, war, and other large-scale disruptions increase, oil’s path can shift fast.
Gas prices at the pump don’t only track crude oil. They also include what it takes to refine and move that fuel, the taxes layered on top, and the extra markup your local station adds to stay in business.
Since crude oil generally makes up a majority of the per-gallon cost, changes in its price have an outsized impact. When oil surges, gas prices typically rise in tandem. But when oil retreats, gas prices often lag on the way down, a trend sometimes described as “rockets and feathers.”
In case of emergency, the U.S. has a store of crude oil known as the Strategic Petroleum Reserve. Its primary purpose is energy security in case of disaster (think sanctions, severe storm damage, even war). But it can also go a long way toward softening crippling price hikes during supply shocks.
It’s not a long-term answer and is more meant to provide temporary relief, assisting consumers and keeping critical parts of the economy running, like key industries, emergency services, public transportation, etc.
Both oil and natural gas are key sources of the energy we use every day. Because of this, a big change in oil prices can affect natural gas. For example, if oil prices increase, some industries may swap natural gas for some segments of their operations where possible, which increases demand for natural gas.
To gauge oil’s performance, we often turn to two benchmarks:
Between these two, Brent better represents global oil performance because it prices much of the world’s traded crude. And, it’s often the best way to track historical oil performance. In fact, even the U.S. Energy Information Administration now uses Brent as its primary reference in its Annual Energy Outlook.
Looking at the Brent benchmark across several decades, oil has been anything but steady. It’s seen spikes due to factors such as wars and supply cuts, and it’s also seen crashes from global recessions and an oversupply (called a “glut”). For example:
All to say, oil’s historical performance has been anything but smooth. Again, it’s hugely affected by wars, recessions, OPEC whims, evolving energy initiatives and policies, and much more.
Looking to stay up-to-date regarding the latest energy developments? Check out our recent coverage:
The current price of oil per barrel depends largely on supply and demand, including news about potential future supply and demand (geopolitics, decisions made by OPEC+, etc.). In the U.S., prices also move based on how friendly an administration is to drilling, as it can affect future supply. For example, 2025 saw the Trump administration move to reopen more than 1.5 million acres in the Coastal Plain of the Arctic National Wildlife Refuge for oil and gas leasing, reversing the Biden administration’s policy of limiting oil drilling in the Arctic.
The price of oil updates constantly when the “futures” markets are open. A futures market is effectively an auction where people agree to buy or sell oil in the future. As long as people and companies are trading contracts, the oil price is changing.
In short, shale is rock that contains oil and natural gas. Think of shale as energy yet to be tapped. The more shale the U.S. accesses, the more energy we’ll have—and the more easily oil prices can keep from spiking as much thanks to a greater supply.
When oil is expensive, it tends to make everyday items cost more. This can be related to energy (your heating, gas utilities, etc.), but it’s also due to the logistics involved with making those items accessible to you. Shipping, for example, can affect the price of things at the grocery store, as it’s more expensive to get those products from warehouses and farms onto the shelf.