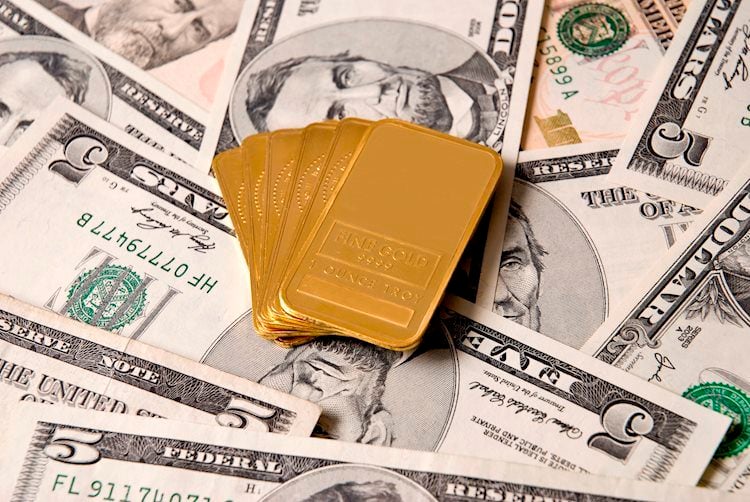
The main tag of Gold Today Price Articles.
You can use the search box below to find what you need.
[wd_asp id=1]
The main tag of Gold Today Price Articles.
You can use the search box below to find what you need.
[wd_asp id=1]
Spot GOLD trades around $2,630, having shed roughly $30 after Wall Street’s opening. The bright metal has been under selling pressure since early in Asia, maintaining a sour tone as the day comes to an end. XAU/USD fell despite the broad US Dollar’s weakness, as a better market mood pushed investors away from safe-haven assets.
Investors welcomed headlines indicating a cease-fire agreement between Israel and Hezbollah is very close, according to the Israeli ambassador to the United States (US). Authorities are expected to announce on Tuesday a 60-day cease-fire, with hopes that it could be resolved in such a pause.
Demand for the Greenback increased in the last Monday’s session, helped by the solid performance of US indexes and encouraging US data. The country reported that the Chicago Fed National Activity Index was down a modest 0.4 in October, following an upwardly revised -0.27 in September. At the same time, the November Dallas Fed Manufacturing Business Index posted -2.7, slightly better than the previous -3.
The focus this week will be on the US Personal Consumption Expenditures (PCE) Price Index, the Federal Reserve’s (Fed) favourite inflation gauge, which will be published on Wednesday. The country will release alongside the second estimate of the Q3 Gross Domestic Product (GDP).
The daily chart for XAU/USD shows the risk skews to the downside. The pair accelerated south after breaking below a now bearish 20 Simple Moving Average (SMA), while technical indicators turned sharply lower within negative levels after failing to overcome their midlines. The 100 and 200 SMAs maintain their upward slopes, with the shorter one currently at around $2,563, a critical support level in the upcoming sessions.
In the near term, and according to the 4-hour chart, XAU/USD is also at risk of extending its slide. The pair fell below all its moving averages, with the 100 SMA gaining downward momentum at around $2,655. Finally, technical indicators head firmly south within negative levels without showing signs of bearish exhaustion.
Support levels: 2,626.10 2,611.35 2,598.70
Resistance levels: 2,640.40 2,655.00 2,671.55
Once Monday’s session is complete, pivots are at the day’s high of 3.46 and the low of 3.26. A decisive move through either has the potential to lead to a continuation in the same direction. Moreover, be cautious of false breakouts, either up or down, that quickly reverse back into today’s trading range. Natural gas rallied above three key pivots last week, indicating improving demand.
The series of lower swing highs are components of the upper boundary of a large symmetrical triangle pattern. At the same time, once the trend high of 3.56 was hit last Friday it led to a bearish engulfing day with natural gas closing below the prior day’s low after exceeding the prior day’s high earlier in the session.
Last week’s rally exceeded the top of a previously identified resistance zone with a high of 3.45. A decisive rally above today’s high will put natural gas in a position to possibly challenge last week’s high of 3.56. A little above that high is another potential resistance zone from 3.64 to 3.67. That zone is anchored by previous resistance at the peak for 2023 at 3.64. If natural gas can get above there, it will be trading at its highest price in around 22-months.
Alternatively, a drop below today’s low will likely see further testing of lower support levels. Given the bearish engulfing day last Friday and weak close, it wouldn’t be surprising to see another test of Friday’s low of 3.07. Also, watch the 3.15 swing high area on the way down for possible support. Other key potential support areas include the prior swing high at 3.02 and the 20-Day MA at 2.90.
For a look at all of today’s economic events, check out our economic calendar.
Silver price (XAG/USD) retraces its recent gains, trading around $30.80 per troy ounce during the Asian session on Monday. This decline may be linked to a technical pullback, similar to the weakness seen in precious metal Gold. However, Silver, as a safe-haven asset, could regain its momentum due to the escalating Russia-Ukraine conflict.
On Friday, President Vladimir Putin confirmed that Russia conducted a hypersonic intermediate-range missile test in an attack on the Ukrainian city of Dnipro. The Kremlin stated that the strike was a retaliatory measure in response to Ukraine’s first assault on Russian territory using US and British-supplied weapons.
Silver prices may receive additional support from a weaker US Dollar following the announcement by US President-elect Donald Trump of his nomination of hedge fund manager Scott Bessent as the new US Treasury Secretary. Bessent, a seasoned Wall Street figure and fiscal conservative, is expected to adopt a more cautious stance on tariffs, alleviating concerns about the implementation of aggressive trade policies.
The non-interest-bearing Silver might have faced downward pressure due to the potential for a higher opportunity cost over a prolonged period. This could be attributed to the strong preliminary S&P Global US Purchasing Managers’ Index (PMI) data released on Friday, which has fueled expectations that the Federal Reserve (Fed) may slow the pace of rate cuts.
Futures traders are now assigning a 50.9% probability to the Federal Reserve cutting rates by a quarter point, down from approximately 61.9% a week earlier, according to the CME FedWatch Tool.
Silver is a precious metal highly traded among investors. It has been historically used as a store of value and a medium of exchange. Although less popular than Gold, traders may turn to Silver to diversify their investment portfolio, for its intrinsic value or as a potential hedge during high-inflation periods. Investors can buy physical Silver, in coins or in bars, or trade it through vehicles such as Exchange Traded Funds, which track its price on international markets.
Silver prices can move due to a wide range of factors. Geopolitical instability or fears of a deep recession can make Silver price escalate due to its safe-haven status, although to a lesser extent than Gold’s. As a yieldless asset, Silver tends to rise with lower interest rates. Its moves also depend on how the US Dollar (USD) behaves as the asset is priced in dollars (XAG/USD). A strong Dollar tends to keep the price of Silver at bay, whereas a weaker Dollar is likely to propel prices up. Other factors such as investment demand, mining supply – Silver is much more abundant than Gold – and recycling rates can also affect prices.
Silver is widely used in industry, particularly in sectors such as electronics or solar energy, as it has one of the highest electric conductivity of all metals – more than Copper and Gold. A surge in demand can increase prices, while a decline tends to lower them. Dynamics in the US, Chinese and Indian economies can also contribute to price swings: for the US and particularly China, their big industrial sectors use Silver in various processes; in India, consumers’ demand for the precious metal for jewellery also plays a key role in setting prices.
Silver prices tend to follow Gold’s moves. When Gold prices rise, Silver typically follows suit, as their status as safe-haven assets is similar. The Gold/Silver ratio, which shows the number of ounces of Silver needed to equal the value of one ounce of Gold, may help to determine the relative valuation between both metals. Some investors may consider a high ratio as an indicator that Silver is undervalued, or Gold is overvalued. On the contrary, a low ratio might suggest that Gold is undervalued relative to Silver.
After witnessing intense volatility in Monday’s opening hour, Gold’s price is licking its wounds near $2,700. The bright metal enjoyed good two-way trades before sellers returned to the game after five straight days.
Gold price picked up fresh bids and jumped to nearly a two-week high of $2,721 in the early dealing. The US Dollar saw a bearish opening gap in tandem with the US Treasury bond yields. Asian traders hit their desks and reacted to the weekend news that US President-elect Donald Trump named billionaire Scott Bessent as his Treasury Secretary.
Bessent’s appointment to the critical position in the Trump administration assured the US Treasury market, as he is seen as an old Wall Street hand and a fiscal conservative. This narrative triggered a sharp retracement in the benchmark US 10-year Treasury bond yields, testing the 4.30% level as of writing.
The US Dollar (USD) tracked the sell-off in the US Treasury bond yields, currently trading 0.65% lower on the day against its major currency rivals.
Despite the ongoing pullback in the USD and the Treasury bond yields, the non-yielding Gold price cannot capitalize on it, correcting sharply from higher levels.
The latest downtick in Gold price could be attributed to improving risk sentiment, courtesy of easing geopolitical tensions between Israel and Lebanon, and reducing uncertainty around the Trump administration. Citing Israeli and US officials. Axios reported that Israel and Lebanon are on the cusp of a ceasefire agreement.
Gold buyers are also cashing in ahead of Wednesday’s US inflation data amid a holiday-shortened Thanksgiving week.
All eyes remain on the geopolitical developments between Israel and Lebanon and Russia-Ukraine in the absence of any top-tier US economic data release on Monday. No speeches from US Federal Reserve (Fed) policymakers could leave Gold traders at the mercy of risk trends.
Having reclaimed all major daily Simple Moving Averages (SMA) on Friday, Gold price has paused its recovery momentum near $2,720.
The turn lower in the 14-day Relative Strength Index (RSI) could also be linked to the renewed weakness in Gold price. The leading indicator currently trades near 56 after testing the 58 level.
An impending Bear Cross continues to pose as a headwind for Gold price. The 21-day SMA is closing in to cut the 50-day SMA from above. If that happens on a daily closing basis, it will validate the bearish crossover.
These technical indicators suggest that the tide could be turning in favor of Gold sellers.
The immediate support is around $2,670, where the 21-day SMA and the 50-day SMA close in.
A sustained break below that level could initiate a fresh downtrend toward $2,600. The November 20 low of $2,619 will be tested ahead of that.
On the other hand, Gold buyers need a daily candlestick closing above the November 5 high of $2.750 to resume the uptrend toward the all-time high of $2,790.
Gold has played a key role in human’s history as it has been widely used as a store of value and medium of exchange. Currently, apart from its shine and usage for jewelry, the precious metal is widely seen as a safe-haven asset, meaning that it is considered a good investment during turbulent times. Gold is also widely seen as a hedge against inflation and against depreciating currencies as it doesn’t rely on any specific issuer or government.
Central banks are the biggest Gold holders. In their aim to support their currencies in turbulent times, central banks tend to diversify their reserves and buy Gold to improve the perceived strength of the economy and the currency. High Gold reserves can be a source of trust for a country’s solvency. Central banks added 1,136 tonnes of Gold worth around $70 billion to their reserves in 2022, according to data from the World Gold Council. This is the highest yearly purchase since records began. Central banks from emerging economies such as China, India and Turkey are quickly increasing their Gold reserves.
Gold has an inverse correlation with the US Dollar and US Treasuries, which are both major reserve and safe-haven assets. When the Dollar depreciates, Gold tends to rise, enabling investors and central banks to diversify their assets in turbulent times. Gold is also inversely correlated with risk assets. A rally in the stock market tends to weaken Gold price, while sell-offs in riskier markets tend to favor the precious metal.
The price can move due to a wide range of factors. Geopolitical instability or fears of a deep recession can quickly make Gold price escalate due to its safe-haven status. As a yield-less asset, Gold tends to rise with lower interest rates, while higher cost of money usually weighs down on the yellow metal. Still, most moves depend on how the US Dollar (USD) behaves as the asset is priced in dollars (XAU/USD). A strong Dollar tends to keep the price of Gold controlled, whereas a weaker Dollar is likely to push Gold prices up.
The Gold price (XAU/USD) jumps to around $2,720 during the early Asian session on Monday. The sell-off in the US Dollar (USD) provides some support to the USD-denominated Gold price. Additionally, rising geopolitical tensions continue to underpin safe-haven assets like yellow metal.
Investors will closely monitor the developments surrounding the Russia-Ukraine conflicts. Last week, Russian President Vladimir Putin lowered the threshold for a nuclear strike in response to a broader range of conventional attacks, days after reports said Washington DC, had allowed Ukraine to use US-made weapons to strike deep into Russian territory. This, in turn, might boost the safe-haven flows, benefiting the precious metal price.
“It’s really one main geopolitical factor that’s at play here in the gold market over the course of the last several days – the increased tensions between Ukraine and Russia is probably most notable,” noted David Meger, director of metals trading at High Ridge Futures.
On the other hand, several Federal Reserve (Fed) officials remain cautious about rate reductions, which might cap the Gold’s upside. The market is adjusting its expectations for the Fed’s cuts next year as inflation is becoming a bigger concern. Higher rates reduce the appeal of gold. According to the CME FedWatch Tool, futures traders are now pricing in 50.9% odds that the Fed will cut rates by a quarter point, down from around 69.5% a month ago.
Gold has played a key role in human’s history as it has been widely used as a store of value and medium of exchange. Currently, apart from its shine and usage for jewelry, the precious metal is widely seen as a safe-haven asset, meaning that it is considered a good investment during turbulent times. Gold is also widely seen as a hedge against inflation and against depreciating currencies as it doesn’t rely on any specific issuer or government.
Central banks are the biggest Gold holders. In their aim to support their currencies in turbulent times, central banks tend to diversify their reserves and buy Gold to improve the perceived strength of the economy and the currency. High Gold reserves can be a source of trust for a country’s solvency. Central banks added 1,136 tonnes of Gold worth around $70 billion to their reserves in 2022, according to data from the World Gold Council. This is the highest yearly purchase since records began. Central banks from emerging economies such as China, India and Turkey are quickly increasing their Gold reserves.
Gold has an inverse correlation with the US Dollar and US Treasuries, which are both major reserve and safe-haven assets. When the Dollar depreciates, Gold tends to rise, enabling investors and central banks to diversify their assets in turbulent times. Gold is also inversely correlated with risk assets. A rally in the stock market tends to weaken Gold price, while sell-offs in riskier markets tend to favor the precious metal.
The price can move due to a wide range of factors. Geopolitical instability or fears of a deep recession can quickly make Gold price escalate due to its safe-haven status. As a yield-less asset, Gold tends to rise with lower interest rates, while higher cost of money usually weighs down on the yellow metal. Still, most moves depend on how the US Dollar (USD) behaves as the asset is priced in dollars (XAU/USD). A strong Dollar tends to keep the price of Gold controlled, whereas a weaker Dollar is likely to push Gold prices up.
A rally above today’s high will trigger a bullish breakout above the line before crude quickly encounters potential resistance around the 50-Day MA pivot, which is at 71.23. That is followed by the top of a declining consolidation pattern (red box) from around 73.15 to 73.27. Crude missed a chance to continue to fall following a bearish trigger on Monday.
Instead, it dropped below prior lows but then quickly reversed higher and ended the day with a bullish key reversal day. The bullish continuation of that one-day reversal has been struggling as crude is rising into a swath of potential resistance, given that it remains within a larger consolidation pattern.
Today’s advance showed strength by reclaiming the 20-Day MA (purple) above 69.97. Given where crude is trading at the time of this writing, it still has a chance to close the day above the line. If it does, that would be another minor sign of strength that needs follow-through. A breakout through a key price level in either direction that quickly reverses in a decisive fashion, is a failure of a breakout attempt. Typically, the reversal of the breakout can be accompanied by sharp moves in the opposite direction. That may still happen with crude if today’s high is exceeded. This does not mean that it will do so, it is only a possibility until further signs of strength are seen.
There is another price level representing a key pivot that also needs to be considered. Last week’s high was 70.84. Therefore, an advance above that high will trigger a bullish reversal on the weekly time frame. It would be reached shortly after a breakout above today’s high.
On the downside, a drop below today’s low of 69.16 may lead to a bearish pullback to test support around this week’s lows. Since resistance is being seen around where some signs of resistance would be expected, at the downtrend line, that scenario may yet play out.
Silver price recovered some ground on Friday and reclaimed the $31.00 a troy ounce, boosted by falling US Treasury bond yields and despite a firm US Dollar. At the time of writing, the XAG/USD trades at $31.28, a gain of over 1.62%.
The grey metal has consolidated within the $30.50-$31.50 range for the last four days, capped on the upside by the 50-day Simple Moving Average (SMA) at $31.75. If Silver extends its rally above the latter, the $32.00 psychological figure would be up next. Once cleared, further upside is seen, with the $33.00 mark up next, ahead of the October 29 peak at $34.54.
For a bearish continuation, XAG/USD first support would be $31.00. Once surpassed, the next demand zone would be $30.00, followed by the November 14 low of $29.68. On further weakness, the next stop would be the 200-day Simple Moving Average (SMA) at $28.91.
Oscillators such as the Relative Strength Index (RSI) suggest buyers are gathering steam, yet the RSI is still below its neutral line. Hence, the bias is neutral-bullish.
Silver is a precious metal highly traded among investors. It has been historically used as a store of value and a medium of exchange. Although less popular than Gold, traders may turn to Silver to diversify their investment portfolio, for its intrinsic value or as a potential hedge during high-inflation periods. Investors can buy physical Silver, in coins or in bars, or trade it through vehicles such as Exchange Traded Funds, which track its price on international markets.
Silver prices can move due to a wide range of factors. Geopolitical instability or fears of a deep recession can make Silver price escalate due to its safe-haven status, although to a lesser extent than Gold’s. As a yieldless asset, Silver tends to rise with lower interest rates. Its moves also depend on how the US Dollar (USD) behaves as the asset is priced in dollars (XAG/USD). A strong Dollar tends to keep the price of Silver at bay, whereas a weaker Dollar is likely to propel prices up. Other factors such as investment demand, mining supply – Silver is much more abundant than Gold – and recycling rates can also affect prices.
Silver is widely used in industry, particularly in sectors such as electronics or solar energy, as it has one of the highest electric conductivity of all metals – more than Copper and Gold. A surge in demand can increase prices, while a decline tends to lower them. Dynamics in the US, Chinese and Indian economies can also contribute to price swings: for the US and particularly China, their big industrial sectors use Silver in various processes; in India, consumers’ demand for the precious metal for jewellery also plays a key role in setting prices.
Silver prices tend to follow Gold’s moves. When Gold prices rise, Silver typically follows suit, as their status as safe-haven assets is similar. The Gold/Silver ratio, which shows the number of ounces of Silver needed to equal the value of one ounce of Gold, may help to determine the relative valuation between both metals. Some investors may consider a high ratio as an indicator that Silver is undervalued, or Gold is overvalued. On the contrary, a low ratio might suggest that Gold is undervalued relative to Silver.
At 14:13 GMT, Natural Gas futures are trading $3.187, down $0.152 or -4.55%.
Natural gas prices soared earlier this week on forecasts for a colder-than-normal pattern between November 28 and early December. NatGasWeather reported that frosty air in the northern U.S. is expected to elevate national demand during this period. Overnight weather model updates, however, introduced a slightly warmer outlook, sparking Friday’s pullback.
Despite the moderation, heating degree day (HDD) data from GFS and EC models remain well above normal, supporting expectations for robust heating demand. If subsequent weather updates restore a colder bias, price recovery could be swift.
The latest EIA storage report showed a small draw of 3 Bcf, leaving total working gas at 3,969 Bcf as of November 15. Current inventories are 141 Bcf higher than last year and 239 Bcf above the five-year average of 3,730 Bcf. While this drawdown was less bearish than the forecasted 2 Bcf injection, elevated supply levels continue to weigh on the market, underscoring the need for sustained demand increases to drive further price rallies.
In the short term, natural gas faces bearish risks if support at $3.168 fails, potentially opening the door to further declines toward $3.044–$3.057. Conversely, colder weather forecasts could cap losses and reignite bullish momentum if resistance at $3.332 and $3.573 is breached. For now, ample supply and slightly moderating weather suggest cautious sentiment, tilting the market toward a bearish outlook.
Silver price (XAG/USD) strives to establish above $31.00 in Friday’s European session. The white metal surges to near $31.40 as demand for safe-haven bets has strengthened after Russia launched intercontinental ballistic missiles with a range of several thousand kilometers on Ukraine’s defense facilities in Dnipro.
The move appeared as retaliation given that Ukraine used United States (US) supplied ATACMS weapons and the United Kingdom (UK) provided storm shadow missiles to attack deep in Russia over the week.
Russian President Vladimir Putin has also warned the UK to strike with the same ballistic missile that their defense facility used against Ukraine, PA Media reported. Putin stated that their nation is entitled to use weapons against those nations who supplies weapons to Ukraine.
In response to that, the spokesperson of UK Prime Minister Keir Starmer said, “Only serves to strengthen our resolve and to ensure that Ukraine has what it needs to act in self-defense against Russia’s reckless and illegal invasion.”
The scenario of heightened geopolitical uncertainty improves the demand for safe-haven assets, such as Silver.
Apart from Silver, the safe-haven appeal of the US Dollar (USD) has also strengthened. The US Dollar Index (DXY), which gauges Greenback’s value against six major currencies, posts a fresh two-year high at 108.00.
Meanwhile, investors look for fresh cues about the Federal Reserve’s (Fed) likely interest rate action in the December meeting. According to the CME FedWatch tool, there is a 56% chance that the Fed will cut interest rates by 25 basis points (bps) to 4.25%-4.50%.
Silver price delivers a mean-reversion move to near the 20-day Exponential Moving Average (EMA) around $31.40 after declining to near $29.70. The white metal weakened after the breakdown of the horizontal support plotted from the May 21 high of $32.50.
The upward-sloping trendline from the February 29 low of $22.30 will act as key support for the Silver price around $29.50.
The 14-day Relative Strength Index (RSI) oscillates in the 40.00-60.00 range, suggesting a sideways trend.
Silver is a precious metal highly traded among investors. It has been historically used as a store of value and a medium of exchange. Although less popular than Gold, traders may turn to Silver to diversify their investment portfolio, for its intrinsic value or as a potential hedge during high-inflation periods. Investors can buy physical Silver, in coins or in bars, or trade it through vehicles such as Exchange Traded Funds, which track its price on international markets.
Silver prices can move due to a wide range of factors. Geopolitical instability or fears of a deep recession can make Silver price escalate due to its safe-haven status, although to a lesser extent than Gold’s. As a yieldless asset, Silver tends to rise with lower interest rates. Its moves also depend on how the US Dollar (USD) behaves as the asset is priced in dollars (XAG/USD). A strong Dollar tends to keep the price of Silver at bay, whereas a weaker Dollar is likely to propel prices up. Other factors such as investment demand, mining supply – Silver is much more abundant than Gold – and recycling rates can also affect prices.
Silver is widely used in industry, particularly in sectors such as electronics or solar energy, as it has one of the highest electric conductivity of all metals – more than Copper and Gold. A surge in demand can increase prices, while a decline tends to lower them. Dynamics in the US, Chinese and Indian economies can also contribute to price swings: for the US and particularly China, their big industrial sectors use Silver in various processes; in India, consumers’ demand for the precious metal for jewellery also plays a key role in setting prices.
Silver prices tend to follow Gold’s moves. When Gold prices rise, Silver typically follows suit, as their status as safe-haven assets is similar. The Gold/Silver ratio, which shows the number of ounces of Silver needed to equal the value of one ounce of Gold, may help to determine the relative valuation between both metals. Some investors may consider a high ratio as an indicator that Silver is undervalued, or Gold is overvalued. On the contrary, a low ratio might suggest that Gold is undervalued relative to Silver.
Silver price (XAG/USD) retraces its recent losses, trading around $31.00 per troy ounce during the Asian hours on Friday. The prices of safe-haven assets like Silver gained ground due to the escalated situation in the Russia-Ukraine war.
Russian President Vladimir Putin warned on Thursday that the Ukraine conflict is escalating toward a global confrontation, citing the use of US and British-supplied weapons by Ukraine to target Russia, according to Reuters.
Putin stated that Russia had retaliated by deploying a new hypersonic medium-range ballistic missile against a Ukrainian military facility, with further strikes possible. He added that civilians would receive warnings ahead of any future attacks involving these weapons.
Meanwhile, commodity traders continued to evaluate the Federal Reserve’s (Fed) monetary policy outlook following the unexpected drop in US Initial Jobless Claims. Claims fell to 213,000 for the week ending November 15, down from a revised 219,000 (previously 217,000) in the prior week and below the forecast of 220,000. This development has fueled speculation about a slower pace of Fed rate cuts.
Futures traders now see a 57.8% chance of the Federal Reserve cutting rates by a quarter point, down from around 72.2% last week, according to data from the CME FedWatch Tool. Non-interest-bearing Silver may face challenges due to the higher opportunity cost associated with higher interest rates.
However, Federal Reserve Bank of Chicago President Austan Goolsbee commented on Thursday that inflation is on track to reach 2%. Goolsbee noted that over the next year, interest rates are likely to be significantly lower than their current levels. He also suggested that it might be prudent to slow the pace of rate cuts as the Fed approaches a neutral rate level.
Silver is a precious metal highly traded among investors. It has been historically used as a store of value and a medium of exchange. Although less popular than Gold, traders may turn to Silver to diversify their investment portfolio, for its intrinsic value or as a potential hedge during high-inflation periods. Investors can buy physical Silver, in coins or in bars, or trade it through vehicles such as Exchange Traded Funds, which track its price on international markets.
Silver prices can move due to a wide range of factors. Geopolitical instability or fears of a deep recession can make Silver price escalate due to its safe-haven status, although to a lesser extent than Gold’s. As a yieldless asset, Silver tends to rise with lower interest rates. Its moves also depend on how the US Dollar (USD) behaves as the asset is priced in dollars (XAG/USD). A strong Dollar tends to keep the price of Silver at bay, whereas a weaker Dollar is likely to propel prices up. Other factors such as investment demand, mining supply – Silver is much more abundant than Gold – and recycling rates can also affect prices.
Silver is widely used in industry, particularly in sectors such as electronics or solar energy, as it has one of the highest electric conductivity of all metals – more than Copper and Gold. A surge in demand can increase prices, while a decline tends to lower them. Dynamics in the US, Chinese and Indian economies can also contribute to price swings: for the US and particularly China, their big industrial sectors use Silver in various processes; in India, consumers’ demand for the precious metal for jewellery also plays a key role in setting prices.
Silver prices tend to follow Gold’s moves. When Gold prices rise, Silver typically follows suit, as their status as safe-haven assets is similar. The Gold/Silver ratio, which shows the number of ounces of Silver needed to equal the value of one ounce of Gold, may help to determine the relative valuation between both metals. Some investors may consider a high ratio as an indicator that Silver is undervalued, or Gold is overvalued. On the contrary, a low ratio might suggest that Gold is undervalued relative to Silver.