The main tag of Gold Today Price Articles.
You can use the search box below to find what you need.
[wd_asp id=1]
The main tag of Gold Today Price Articles.
You can use the search box below to find what you need.
[wd_asp id=1]
Silver price (XAG/USD) extends its correction below $31.00 in European trading hours on Wednesday after facing selling pressure near $31.50 on Tuesday. The white metal falls back as fresh escalation in the Russia-Ukraine war inspired by President Vladimir Putin’s approval to lowering the threshold for counter attack by nuclear weapons faded after Russian Foreign Minister Sergei Lavrov said the country will “do everything possible” to avoid the onset of nuclear war.
Putin cleared revision in the nuclear doctrine after US President Joe Biden provided the Army Tactical Missile System (ATACMS) to Ukraine and permitted them to launch deep into Russian territory. Historically, demand for safe-haven assets such as Silver, strengthens in times of uncertainty and heightened geopolitical risks.
A sharp recovery in the US Treasury yields has also weighed on the Silver price. 10-year US Treasury yields jump to near 4.42% on expectations of fewer interest rate cuts from the Federal Reserve (Fed) in its current policy-easing cycle. Higher yields on interest-bearing assets increase the opportunity cost of holding an investment in non-yielding assets, such as Silver. The US Dollar Index (DXY), which gauges Greenback’s value against six major currencies, bounces back strongly above 106.60.
Market participants expect the economic agenda of President-elected Donald Trump will boost the United States (US) inflation and economic growth, a scenario that will force the Fed to follow a gradual rate-cut approach.
Silver price stays on track toward the upward-sloping trendline around $29.00, plotted from the February low of $22.30, which also coincides with the 200-day Exponential Moving Average (EMA). The white metal falls back after facing selling pressure near the 50-day EMA, which trades around $31.40.
The asset weakened after the breakdown of the horizontal support plotted from the May 21 high of $32.50.
The 14-day Relative Strength Index (RSI) slides to near 40.00. A bearish momentum will trigger if the RSI (14) sustains below the same.
Silver is a precious metal highly traded among investors. It has been historically used as a store of value and a medium of exchange. Although less popular than Gold, traders may turn to Silver to diversify their investment portfolio, for its intrinsic value or as a potential hedge during high-inflation periods. Investors can buy physical Silver, in coins or in bars, or trade it through vehicles such as Exchange Traded Funds, which track its price on international markets.
Silver prices can move due to a wide range of factors. Geopolitical instability or fears of a deep recession can make Silver price escalate due to its safe-haven status, although to a lesser extent than Gold’s. As a yieldless asset, Silver tends to rise with lower interest rates. Its moves also depend on how the US Dollar (USD) behaves as the asset is priced in dollars (XAG/USD). A strong Dollar tends to keep the price of Silver at bay, whereas a weaker Dollar is likely to propel prices up. Other factors such as investment demand, mining supply – Silver is much more abundant than Gold – and recycling rates can also affect prices.
Silver is widely used in industry, particularly in sectors such as electronics or solar energy, as it has one of the highest electric conductivity of all metals – more than Copper and Gold. A surge in demand can increase prices, while a decline tends to lower them. Dynamics in the US, Chinese and Indian economies can also contribute to price swings: for the US and particularly China, their big industrial sectors use Silver in various processes; in India, consumers’ demand for the precious metal for jewellery also plays a key role in setting prices.
Silver prices tend to follow Gold’s moves. When Gold prices rise, Silver typically follows suit, as their status as safe-haven assets is similar. The Gold/Silver ratio, which shows the number of ounces of Silver needed to equal the value of one ounce of Gold, may help to determine the relative valuation between both metals. Some investors may consider a high ratio as an indicator that Silver is undervalued, or Gold is overvalued. On the contrary, a low ratio might suggest that Gold is undervalued relative to Silver.
Gold price stays on the front foot early Wednesday, looking to regain the $2,650 barrier as the road to recovery extends for the third straight day. Traders now await the upcoming speeches from US Federal Reserve (Fed) policymakers and Nvidia’s earnings report amid lingering geopolitical concerns between Russia and Ukraine.
The US Dollar (USD) seems to find fresh demand in Asian trading on Wednesday, tracking the uptick in the US Treasury bond yields as broader market sentiment improves on China’s stimulus hopes.
Markets were cautious earlier following the People’s Bank of China’s (PBOC) inaction on the Loan Prime Rates (LPR). However, expectations that China will roll out more stimulus to prop up the economy are lifting the market mood.
Further, worries over a further geopolitical escalation between Russia and Ukraine seem to fade, lifting risk appetite.
However, Gold buyers refuse to give up so far, anticipating a shift in risk sentiment if the American AI giant Nvidia Inc.’s earnings report disappoints and triggers a wave of risk aversion across the financial markets.
Also, the developments surrounding Russia and Ukraine will be closely eyed, keeping the demand for the traditional safe-haven Gold price underpinned.
On Tuesday, Russia’s Defence Ministry said that Ukraine fired six US-made Army Tactical Missile Systems (ATACMS) missiles at Bryansk region, just days after US President Joe Biden allowed the Ukrainian use of American-made weapons to strike inside Russia.
The Kremlin confirmed Tuesday that they lowered the threshold for a possible nuclear strike in response to non-nuclear attacks on Russia.
Besides, the Fedspeak will help gauge the US central bank’s path forward on interest rates, with markets now pricing in a 60% chance that the Fed will cut rates by 25 basis points (bps) in December.
The short-term technical outlook for Gold price remains the same, with traders likely to adopt a ‘sell on bounce’ trade strategy as the 14-day Relative Strength Index (RSI) remains below the 50 level. The indicator is currently trading near 47.
An impending Bear Cross adds credence to the downside potential. The 21-day Simple Moving Average (SMA) is looking to cross the 50-day SMA above. If that happens on a daily closing basis, it will validate the bearish crossover.
That said, failure to find acceptance above the 50-day SMA at $2,660 on a daily closing basis could reinforce sellers toward the $2,600 threshold.
The previous day’s low of $2,610 will be tested ahead of that.
On the flip side, the immediate resistance is seen at the 50-day SMA, above which the 21-day SMA at $2,682 will come into play.
Additional recovery could face stiff resistance at the $2,700 threshold.
Gold has played a key role in human’s history as it has been widely used as a store of value and medium of exchange. Currently, apart from its shine and usage for jewelry, the precious metal is widely seen as a safe-haven asset, meaning that it is considered a good investment during turbulent times. Gold is also widely seen as a hedge against inflation and against depreciating currencies as it doesn’t rely on any specific issuer or government.
Central banks are the biggest Gold holders. In their aim to support their currencies in turbulent times, central banks tend to diversify their reserves and buy Gold to improve the perceived strength of the economy and the currency. High Gold reserves can be a source of trust for a country’s solvency. Central banks added 1,136 tonnes of Gold worth around $70 billion to their reserves in 2022, according to data from the World Gold Council. This is the highest yearly purchase since records began. Central banks from emerging economies such as China, India and Turkey are quickly increasing their Gold reserves.
Gold has an inverse correlation with the US Dollar and US Treasuries, which are both major reserve and safe-haven assets. When the Dollar depreciates, Gold tends to rise, enabling investors and central banks to diversify their assets in turbulent times. Gold is also inversely correlated with risk assets. A rally in the stock market tends to weaken Gold price, while sell-offs in riskier markets tend to favor the precious metal.
The price can move due to a wide range of factors. Geopolitical instability or fears of a deep recession can quickly make Gold price escalate due to its safe-haven status. As a yield-less asset, Gold tends to rise with lower interest rates, while higher cost of money usually weighs down on the yellow metal. Still, most moves depend on how the US Dollar (USD) behaves as the asset is priced in dollars (XAU/USD). A strong Dollar tends to keep the price of Gold controlled, whereas a weaker Dollar is likely to push Gold prices up.
Silver price (XAG/USD) retraces its recent gains, trading around $31.20 per troy ounce during the Asian session on Wednesday. The price of Silver might have faced downward pressure after the People’s Bank of China (PBoC) Monetary Policy Committee (MPC) decided to maintain the benchmark interest rate at 3.1% for November. Higher interest rates in China, a key global manufacturing hub for electronics, solar panels, and automotive components, would likely reduce industrial demand for Silver.
The price of the safe-haven bullion gained ground amid escalating tensions in the Russia-Ukraine conflict. According to a Reuters report late Tuesday, Ukraine deployed US-supplied ATACMS missiles to strike Russian territory for the first time, signaling a significant escalation on the 1,000th day of the conflict. However, market concerns eased slightly after Russian Foreign Minister Sergei Lavrov stated that the government would “do everything possible” to prevent the outbreak of nuclear war.
The dollar-denominated Silver strengthens its demand as the US Dollar (USD) experienced profit-taking selling after a recent rally. This rally was fueled by expectations of fewer Federal Reserve (Fed) rate cuts and optimism about US economic outperformance under the incoming Trump administration. A lower US Dollar makes the precious metals cheaper for buyers with foreign currencies, which increases the Silver demand.
Jeffrey Schmid, President of the Federal Reserve Bank of Kansas City, stated on Tuesday that he expects both inflation and employment to move closer to the Fed’s targets. Schmid explained that rate cuts signal the Fed’s confidence in inflation trending toward its 2% goal. He also noted that while large fiscal deficits won’t necessarily drive inflation, the Fed may need to counteract potential pressures with higher interest rates.
Silver is a precious metal highly traded among investors. It has been historically used as a store of value and a medium of exchange. Although less popular than Gold, traders may turn to Silver to diversify their investment portfolio, for its intrinsic value or as a potential hedge during high-inflation periods. Investors can buy physical Silver, in coins or in bars, or trade it through vehicles such as Exchange Traded Funds, which track its price on international markets.
Silver prices can move due to a wide range of factors. Geopolitical instability or fears of a deep recession can make Silver price escalate due to its safe-haven status, although to a lesser extent than Gold’s. As a yieldless asset, Silver tends to rise with lower interest rates. Its moves also depend on how the US Dollar (USD) behaves as the asset is priced in dollars (XAG/USD). A strong Dollar tends to keep the price of Silver at bay, whereas a weaker Dollar is likely to propel prices up. Other factors such as investment demand, mining supply – Silver is much more abundant than Gold – and recycling rates can also affect prices.
Silver is widely used in industry, particularly in sectors such as electronics or solar energy, as it has one of the highest electric conductivity of all metals – more than Copper and Gold. A surge in demand can increase prices, while a decline tends to lower them. Dynamics in the US, Chinese and Indian economies can also contribute to price swings: for the US and particularly China, their big industrial sectors use Silver in various processes; in India, consumers’ demand for the precious metal for jewellery also plays a key role in setting prices.
Silver prices tend to follow Gold’s moves. When Gold prices rise, Silver typically follows suit, as their status as safe-haven assets is similar. The Gold/Silver ratio, which shows the number of ounces of Silver needed to equal the value of one ounce of Gold, may help to determine the relative valuation between both metals. Some investors may consider a high ratio as an indicator that Silver is undervalued, or Gold is overvalued. On the contrary, a low ratio might suggest that Gold is undervalued relative to Silver.
Since crude seemed to have recognized the 20-Day MA, even though it is contained within a rectangle consolidation formation, today’s high along with the 20-Day line marks near-term resistance. A bullish breakout above the 20-Day line will indicate short-term strength, but within a dominant consolidation pattern.
This means that until crude moves out of the pattern and stays out of it, trading will likely remain choppy with low conviction moves. An advance above the 20-Day line has crude heading towards the top of the pattern at 73.27. Also, there may be some reaction on the approach around the 50-Day MA at 71.19.
A bearish breakdown from the rectangle triggered on Monday as crude fell below the prior low of the range at 67.05. But following a drop 66.86, buyers stepped in and took back control, which led to today’s high. Monday was a reversal day where the day began with sellers in charge as crude fell to a 47-day low, and it ended with buyers back in charge, reaching a five-day high and ending at a six-day closing high. If crude oil can continue to strengthen above the 20-Day line, the internal downtrend may also provide an indication of strength or weakness.
If crude can breakout above 73.27 and continue to strengthen it likely heads towards the 61.8% Fibonacci retracement at 74.60, along with potential resistance from a trendline that marks the bottom boundary of a large symmetrical triangle pattern. Subsequently, the 78.6% retracement at 76.57 along with the 200-Day MA at 77.38, becomes the next higher targets.
Alternatively, a sustained decline below this week’s low of 66.86 has crude first testing support around the swing low of 65.65 from early-September. That low was the lowest traded price for crude oil since May 2023. If it fails to hold as support crude next targets the 63.68 to 63.30 potential support zone, which happens to be around the long-term downtrend line.
For a look at all of today’s economic events, check out our economic calendar.
The advance today triggered a breakout of the closest prior swing high in the series of lower swing lows at 3.02. Once there is a daily close above 3.02, assuming further bullish moves, an upside breakout of a large symmetrical triangle pattern will have confirmed the breakout. In addition, today’s rally triggered a likely continuation of the bull trend that started from the August swing low, as there is now a higher swing high. A daily close above the 3.02 high also will confirm the continuation of that trend. A confirmed breakout indicates that there is a greater chance for a continuation of the move.
Once the price structure of the triangle is busted with a higher swing high, previous higher swing highs become a target. And a confirmed breakout above either will provide another sign of strength. The first is 3.16 from the peak in June. Given the potential improvement in momentum once a breakout is confirmed that price target may easily be surpassed leading to 3.22.
However, that is a short-term target as it is derived from the most recent rising ABCD pattern (light blue) that shows price symmetry between the two swings at that target. Further up is a price zone of potential resistance from 3.35 to 3.45. An ascending ABCD pattern (purple) reaches its target at 3.35. At 3.39 there is a match with resistance seen at the January peak, while there is an extended ABCD target at 3.42. The range ends with the target from a large rising ABCD pattern at 3.45.
For a look at all of today’s economic events, check out our economic calendar.
Persistent concerns in the geopolitical landscape encouraged market participants to increase their positions in the precious metal on turnaround Tuesday, a move that came in response to swelling effervescence in the Russia-Ukraine front and as a direct answer to bouts of demand for the safe haven universe.
Against that backdrop, prices of the troy ounce of the yellow metal advanced further north of the recently broken $2,600 mark, meeting immediate hurdle at the interim 55-day SMA in the $2,640 zone for the time being.
In addition, Gold’s rebound appears bolstered by a vacillating price action in the US Dollar (USD) as markets reassess the strength of the Trump-era rally. Additionally, the widespread loss of momentum in US Treasury yields across various maturities has also offered the metal further chances to recover.
It is worth noting that the resurgence of tensions on the geopolitical front came in response to reports over the weekend that the Biden administration has authorized Ukraine to use US-made weapons to strike Russian territory.
Looking ahead, this week’s focus will shift to key economic data releases globally, with preliminary PMIs expected to take center stage in the first turn. Comments from central bank officials are also likely to draw attention, especially following Fed Chair Jerome Powell’s remarks last week, where he reiterated the Fed’s cautious approach to further rate cuts, citing the resilience of the US economy.
Shifting the optics, non-commercial players (speculators) reduced their net long positions in Gold to approximately 236.5K contracts as of November 12, the lowest level since early June, according to the latest CFTC report. This decline coincided with a second consecutive drop in open interest, which could in turn morph into a signal that the recent downtrend in the commodity could start losing momentum.
The daily chart for XAU/USD shows a clear break above the bullish 100-day Simple Moving Average (SMA) near $2,550, an area close to November’s low of $2,536. Further up, the so far weekly high around $2,540 (November 19) coincides with the transitory 55-day SMA, reinforcing this initial resistance zone. Up from here, the next minor target emerges at the weekly high of $2,749 (November 5).
On the other hand, a quick breach of the temporary 100-day SMA at $2,551 should shift the attention to the November bottom of $2,536 (November 14).
In the short term, the 4-hour chart suggests that the ongoing recovery has more room to run. The Relative Strength Index (RSI) has bounced but faces resistance around the 62 region, while the Average Directional Index (ADX) at 32 indicates a lack of strong trend momentum for the time being.
On the upside, the next resistance levels to watch are $2,639, followed by the more significant 200-SMA at $2,678 and the 100-SMA. On the downside, support remains firm at $2,536, a key level to watch if prices reverse course.
Silver price (XAG/USD) continues to gain ground for the second consecutive day, trading around $31.40 per troy ounce during the Asian session on Tuesday. The prices of the dollar-denominated Silver recover from two-month lows as the US Dollar (USD) experiences profit-taking selling after a recent rally. This rally was fueled by expectations of fewer Federal Reserve (Fed) rate cuts and optimism about US economic outperformance under the incoming Trump administration.
Meanwhile, safe-haven Silver is gaining traction amid rising geopolitical tensions. US President Joe Biden authorized Ukraine to use US-made weapons for strikes deep within Russia, a move that escalated concerns in the region. In response, the Kremlin issued a warning on Monday, vowing to retaliate against what it called a reckless decision by the Biden administration. Russia had earlier cautioned that such actions could significantly increase the risk of confrontation with NATO.
Non-yielding assets like Silver faced headwinds after Fed Chair Jerome Powell tempered expectations of immediate rate cuts. Powell emphasized the economy’s strength, a robust labor market, and ongoing inflationary pressures. He stated, “The economy is not sending any signals that we need to be in a hurry to lower rates.” Investors now await additional remarks from Fed officials this week for further insight into the trajectory of US interest rates.
Markets are closely monitoring China’s upcoming Loan Prime Rate (LPR) decision, anticipating potential additional stimulus measures to support economic growth. This follows the recent 10 trillion Yuan debt package, which did not include direct economic stimulus, heightening market concerns. As one of the world’s largest manufacturing hubs for electronics, solar panels, and automotive components, China’s industrial demand for Silver remains a key factor influencing its prices.
Silver is a precious metal highly traded among investors. It has been historically used as a store of value and a medium of exchange. Although less popular than Gold, traders may turn to Silver to diversify their investment portfolio, for its intrinsic value or as a potential hedge during high-inflation periods. Investors can buy physical Silver, in coins or in bars, or trade it through vehicles such as Exchange Traded Funds, which track its price on international markets.
Silver prices can move due to a wide range of factors. Geopolitical instability or fears of a deep recession can make Silver price escalate due to its safe-haven status, although to a lesser extent than Gold’s. As a yieldless asset, Silver tends to rise with lower interest rates. Its moves also depend on how the US Dollar (USD) behaves as the asset is priced in dollars (XAG/USD). A strong Dollar tends to keep the price of Silver at bay, whereas a weaker Dollar is likely to propel prices up. Other factors such as investment demand, mining supply – Silver is much more abundant than Gold – and recycling rates can also affect prices.
Silver is widely used in industry, particularly in sectors such as electronics or solar energy, as it has one of the highest electric conductivity of all metals – more than Copper and Gold. A surge in demand can increase prices, while a decline tends to lower them. Dynamics in the US, Chinese and Indian economies can also contribute to price swings: for the US and particularly China, their big industrial sectors use Silver in various processes; in India, consumers’ demand for the precious metal for jewellery also plays a key role in setting prices.
Silver prices tend to follow Gold’s moves. When Gold prices rise, Silver typically follows suit, as their status as safe-haven assets is similar. The Gold/Silver ratio, which shows the number of ounces of Silver needed to equal the value of one ounce of Gold, may help to determine the relative valuation between both metals. Some investors may consider a high ratio as an indicator that Silver is undervalued, or Gold is overvalued. On the contrary, a low ratio might suggest that Gold is undervalued relative to Silver.
Gold price extends the recovery into Asian trading on Tuesday, reversing half the previous week’s decline. The focus remains on the upcoming speeches from US Federal Reserve (Fed) policymakers and geopolitical tensions between Russia and Ukraine.
Gold price stays firm for the second consecutive day so far, drawing support from the recent retracement in the US Treasury bond yields across the curve, fuelling the corrective downside in the US Dollar (USD) against its major currency rivals.
The US bond yields have embarked upon a correction mode as investors remain wary of the impact of the potential fiscal and trade policies to be introduced by US President-elect Donald Trump on the economic and inflation outlook.
Additionally, Gold price capitalizes on the renewed geopolitical escalation between Russia and Ukraine after US President Joe Biden authorized Ukraine to use American Army Tactical Missile Systems (ATACMS) to strike inside Russia on Sunday. The decision to allow the use of long-range US weapons inside Russia came after Moscow deployed North Korean ground troops to supplement its own forces.
Moreover, expectations of more stimulus measures coming in from China also bode well for the bright metal. China is the world’s top Gold consumer. Securities Journal, Chinese state media, quoted analysts saying further cuts to the Reserve Requirement Ratio (RRR) coming this year.
Note that China is the world’s top Gold consumer, and any support measures by the local authorities to boost economic performance seem positive for the precious metal. However, it remains to be seen if Gold price manages to hold on to its recovery momentum as traders turn cautious, awaiting more cues on the Fed’s interest rate outlook from the central bank talks due Tuesday and later this week.
Also, traders could refrain from placing fresh bets on the yellow metal ahead of the American AI giant Nvidia Inc.’s earnings report, which could significantly impact the broader market sentiment and the value of the USD, eventually influencing the USD-sensitive Gold price.
Technically, Gold price appears to be a ‘sell on bounce’ trade as long as the 14-day Relative Strength Index (RSI) remains below the 50 level. The indicator is currently trading near 45.
The immediate resistance is seen at the $2,630 round number, above which a strong topside barrier aligns at the 50-day Simple Moving Average (SMA) at $2,655.
Acceptance above the latter is critical to sustaining the recovery mode from two-month troughs of $2,537.
The next stiff resistance is located at $2,687, the 21-day SMA.
Failing to find a foothold above the 50-day SMA on a daily closing basis could revive the bearish sentiment, reinforcing sellers toward the $2,600 threshold.
Additional declines could threaten the confluence support at $2,551, where the 100-day SMA coincides with the September 18 low.
A sustained break below the last will trigger a fresh downtrend toward the $2,500 threshold, with the next bearish target seen at the September 4 low of $2,472.
Gold has played a key role in human’s history as it has been widely used as a store of value and medium of exchange. Currently, apart from its shine and usage for jewelry, the precious metal is widely seen as a safe-haven asset, meaning that it is considered a good investment during turbulent times. Gold is also widely seen as a hedge against inflation and against depreciating currencies as it doesn’t rely on any specific issuer or government.
Central banks are the biggest Gold holders. In their aim to support their currencies in turbulent times, central banks tend to diversify their reserves and buy Gold to improve the perceived strength of the economy and the currency. High Gold reserves can be a source of trust for a country’s solvency. Central banks added 1,136 tonnes of Gold worth around $70 billion to their reserves in 2022, according to data from the World Gold Council. This is the highest yearly purchase since records began. Central banks from emerging economies such as China, India and Turkey are quickly increasing their Gold reserves.
Gold has an inverse correlation with the US Dollar and US Treasuries, which are both major reserve and safe-haven assets. When the Dollar depreciates, Gold tends to rise, enabling investors and central banks to diversify their assets in turbulent times. Gold is also inversely correlated with risk assets. A rally in the stock market tends to weaken Gold price, while sell-offs in riskier markets tend to favor the precious metal.
The price can move due to a wide range of factors. Geopolitical instability or fears of a deep recession can quickly make Gold price escalate due to its safe-haven status. As a yield-less asset, Gold tends to rise with lower interest rates, while higher cost of money usually weighs down on the yellow metal. Still, most moves depend on how the US Dollar (USD) behaves as the asset is priced in dollars (XAU/USD). A strong Dollar tends to keep the price of Gold controlled, whereas a weaker Dollar is likely to push Gold prices up.
Silver prices soar late in the New York session, trading with gains of over 3% at around $31.16 after bouncing off daily lows of $30.24. A weak US Dollar and falling US Treasury yields augmented appetite for precious metals, which halted their slide after the US Presidential Election.
Silver’s uptrend remains intact despite trading below the 50-day Simple Moving Average (SMA) at $31.54. Although it has printed a lower low beneath the October 8 swing low of $30.13, sellers need the grey’s metal price to stay below the 50-day SMA. If that’s not achieved, the next resistance would be $32.00, followed by the October 4 peak at $32.95. On further strength, $33.00 would be up next.
On the other hand, XAG/USD is slumping below $30.13, and sellers are in charge. The next support would be $30.00, followed by the Intermediate support seen at $27.69, the September 6 low.
Oscillators such as the Relative Strength Index (RSI) remain bearishly biased, though in the short term, some upside is seen.
Silver is a precious metal highly traded among investors. It has been historically used as a store of value and a medium of exchange. Although less popular than Gold, traders may turn to Silver to diversify their investment portfolio, for its intrinsic value or as a potential hedge during high-inflation periods. Investors can buy physical Silver, in coins or in bars, or trade it through vehicles such as Exchange Traded Funds, which track its price on international markets.
Silver prices can move due to a wide range of factors. Geopolitical instability or fears of a deep recession can make Silver price escalate due to its safe-haven status, although to a lesser extent than Gold’s. As a yieldless asset, Silver tends to rise with lower interest rates. Its moves also depend on how the US Dollar (USD) behaves as the asset is priced in dollars (XAG/USD). A strong Dollar tends to keep the price of Silver at bay, whereas a weaker Dollar is likely to propel prices up. Other factors such as investment demand, mining supply – Silver is much more abundant than Gold – and recycling rates can also affect prices.
Silver is widely used in industry, particularly in sectors such as electronics or solar energy, as it has one of the highest electric conductivity of all metals – more than Copper and Gold. A surge in demand can increase prices, while a decline tends to lower them. Dynamics in the US, Chinese and Indian economies can also contribute to price swings: for the US and particularly China, their big industrial sectors use Silver in various processes; in India, consumers’ demand for the precious metal for jewellery also plays a key role in setting prices.
Silver prices tend to follow Gold’s moves. When Gold prices rise, Silver typically follows suit, as their status as safe-haven assets is similar. The Gold/Silver ratio, which shows the number of ounces of Silver needed to equal the value of one ounce of Gold, may help to determine the relative valuation between both metals. Some investors may consider a high ratio as an indicator that Silver is undervalued, or Gold is overvalued. On the contrary, a low ratio might suggest that Gold is undervalued relative to Silver.
After six consecutive days of losses, Gold prices manage to regain some balance and trim part of the recent intense pullback, reclaiming the $2,600 mark per troy ounce and above in quite a positive start to the new trading week.
The favourable backdrop in the precious metal also appears propped up by another negative day in the US Dollar (USD) as market participants keep re-assessing the recent Trump-infused strong rally, while the lack of a clear direction in US yields across different time frames also gives the yellow metal fresh legs.
However, the resurgence of the geopolitical factor, precisely from the Russia-Ukraine war, seems to be mostly behind the wake-up call in the metal, particularly after Biden’s administration “authorised” Ukraine to use US-made weapons to strike Russian territory.
Moving forward, it should be a week dominated by data releases surrounding the real economy worldwide, where the publication of preliminary PMIs is expected to take centre stage. In addition, opinions from central bank officials are also seen keeping investors entertained, especially after Fed’s Chair Jerome Powell suggested last week that the central bank is in no rush to cut its interest rates further given a resilient US economy.
On another front, non-commercial players (speculators) have reduced their net long positions in Gold to about 236.5K contracts, a level not seen since early June, according to the CFTC Positioning report for the week ending November 12. This retracement also came in tandem with the second straight drop in open interest, aligning with the recent decline.
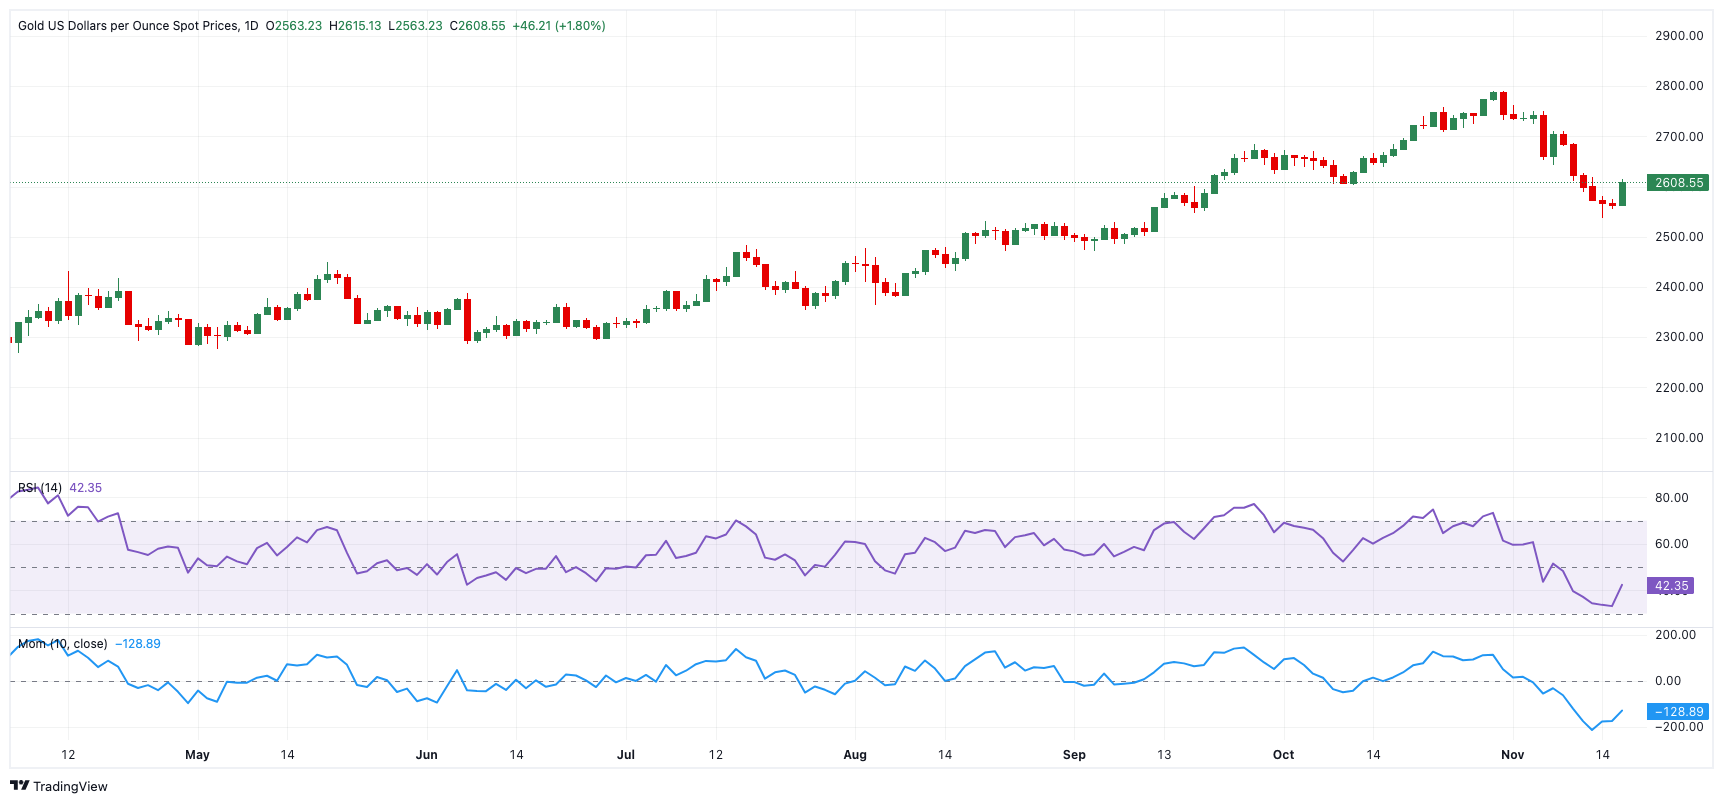
The daily chart for XAU/USD shows that it bounced from a bullish 100 Simple Moving Average (SMA) near $2,550, a region close to the November low ($2,536). However, the initial hurdle above $2,600 coincides with a Fibo retracement of the yearly rally and is expected to offer decent resistance.
In the near term, and according to the 4-hour chart, the ongoing upward correction seems poised to continue. The Relative Strength Index (RSI) rebounded but met resistance around the 55 level, while the Average Directional Index (ADX) around 32 is not supportive of a strong trend.
Initially, on the upside, emerges the 55-SMA at $2,630, which precedes the more significant 200-SMA and the provisional 100-SMA at $2,679 and $2,684, respectively. On the other hand comes $2,536.