The main tag of Gold Today Price Articles.
You can use the search box below to find what you need.
[wd_asp id=1]
The main tag of Gold Today Price Articles.
You can use the search box below to find what you need.
[wd_asp id=1]
Silver prices (XAG/USD) experiences a third consecutive day of declines, trading around $30.60 per troy ounce during the Asian session on Tuesday. The precious metals sector, including Silver, is facing pressure due to a reduced demand for safe-haven assets.
Traders are increasingly shifting toward riskier assets as markets assess the potential impacts of US President-Elect Trump’s potential fiscal policies and monetary strategies. The possibility of tariffs being implemented early in Trump’s presidency could lead to inflation, which in turn may cause the Federal Reserve (Fed) to delay its expected easing measures in the coming year.
As a result, the dollar-denominated Silver is also struggling amid a stronger Greenback and rising US Treasury yields. The US Dollar Index (DXY), which tracks the value of the US Dollar against six major currencies, is hovering near a four-month high at 105.70. Meanwhile, the yields on 2-year and 10-year US Treasury bonds are at 4.28% and 4.32%, respectively, at the time of writing.
China’s recent stimulus measures have fallen short of investor expectations, undermining earlier hopes for industrial support in the largest manufacturing hub and negatively impacting the outlook for industrial metals across the board. This has put additional pressure on Silver, which has significant usage in electrification, particularly in solar panels.
Last week, China announced a 10 trillion Yuan debt package aimed at easing local government financing pressures and boosting the economy. However, the package did not include direct economic stimulus measures, which many had hoped for.
Meanwhile, Chinese-owned solar panel manufacturers have begun scaling back production, partly due to concerns that Trump’s election victory in the US could lead to higher tariffs on the sector. Morgan Stanley has predicted that the Trump administration may impose immediate tariffs of 60% on imports from China.
Silver is a precious metal highly traded among investors. It has been historically used as a store of value and a medium of exchange. Although less popular than Gold, traders may turn to Silver to diversify their investment portfolio, for its intrinsic value or as a potential hedge during high-inflation periods. Investors can buy physical Silver, in coins or in bars, or trade it through vehicles such as Exchange Traded Funds, which track its price on international markets.
Silver prices can move due to a wide range of factors. Geopolitical instability or fears of a deep recession can make Silver price escalate due to its safe-haven status, although to a lesser extent than Gold’s. As a yieldless asset, Silver tends to rise with lower interest rates. Its moves also depend on how the US Dollar (USD) behaves as the asset is priced in dollars (XAG/USD). A strong Dollar tends to keep the price of Silver at bay, whereas a weaker Dollar is likely to propel prices up. Other factors such as investment demand, mining supply – Silver is much more abundant than Gold – and recycling rates can also affect prices.
Silver is widely used in industry, particularly in sectors such as electronics or solar energy, as it has one of the highest electric conductivity of all metals – more than Copper and Gold. A surge in demand can increase prices, while a decline tends to lower them. Dynamics in the US, Chinese and Indian economies can also contribute to price swings: for the US and particularly China, their big industrial sectors use Silver in various processes; in India, consumers’ demand for the precious metal for jewellery also plays a key role in setting prices.
Silver prices tend to follow Gold’s moves. When Gold prices rise, Silver typically follows suit, as their status as safe-haven assets is similar. The Gold/Silver ratio, which shows the number of ounces of Silver needed to equal the value of one ounce of Gold, may help to determine the relative valuation between both metals. Some investors may consider a high ratio as an indicator that Silver is undervalued, or Gold is overvalued. On the contrary, a low ratio might suggest that Gold is undervalued relative to Silver.
| August 13, 2024 Coffee Price Forecast: Influenced by many factors, coffee prices continue to decrease August 14, 2024 Coffee Price Forecast: Concerns about weather in Brazil push coffee prices up sharply again? |
Forecast of coffee prices on August 15, 2024, in the domestic market, increased again. According to data from the General Department of Customs, in July, Vietnam’s coffee exports reached 7 tons, worth 76.982 million USD, down 381,2% in volume but up 29,3% in value compared to the same period last year.
In particular, the average coffee export price last month reached a record of 4.951 USD/ton, up 7,8% over the previous month and up to 75,1% (equivalent to 2.123 USD/ton) over the same period. 2023.
In the first 7 months of this year, the export price of this agricultural product increased by 52,3% to an average of 3.682 USD/ton. Thanks to that, although export output decreased by 12,4% over the same period, the value still increased by 33,5%, reaching 979.353 tons, worth 3,6 billion USD.
With favorable price factors, the coffee industry is expected to bring in a record export turnover of 5 billion USD this year.
Regarding export markets, the European Union (EU) is still Vietnam’s largest coffee consumption market in the first 7 months of the year, accounting for 39% of total export volume with 381.699 tons, worth 1,37 billion USD. . Although the amount of coffee exported to the EU decreased by 10,7%, the value increased by 39% over the same period last year.
Of which, exports to key markets such as Germany, Italy and Spain reached 121.500 tons, 91.082 tons and 71.734 tons, respectively. Over the same period, the amount of coffee exported to Germany and Spain decreased by 11,6% and 14,5%, respectively, while exports to Italy increased by 17,8%.
Coffee exports to some other major markets such as Japan, the US and Russia have decreased significantly compared to the same period last year.
However, exports to Asian markets recorded strong growth, with Indonesia increasing by 50,4%; Philippines increased by 63,7%; China increased by 27,2%; Thailand increased by 68,7%; and Malaysia increased by 61,7%.
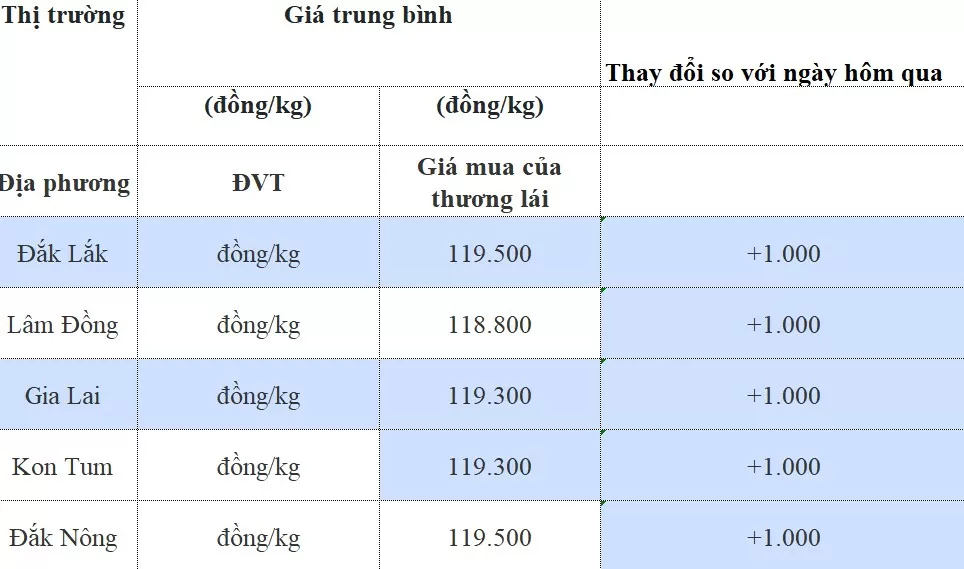
In the domestic market, coffee prices were updated at 4:30 a.m. on August 14, 2024 as follows, according to www.giacaphe.com, domestic coffee prices decreased slightly compared to yesterday, ranging from 117.800-118.500 VND/kg. Currently, the average purchase price in the Central Highlands provinces is 118.000 VND/kg, the highest purchase price in the province Dak Lak, Dak Nong is 119.300 VND/kg.
| August 15, 2024 Coffee Price Forecast: All Plunge |
Specifically, the coffee purchase price in the province Gia Lai (Chu Prong) is 118.300 VND, in Pleiku and La Grai the same price is 118.200 VND/kg; in the province Kon Tum Coffee is purchased at 118.300 VND/kg; in Dak Nong province, coffee is purchased at the highest price of 118.500 VND/kg.
Price of green coffee beans (coffee beans, fresh coffee beans) in the province Lam Dong In districts such as Bao Loc, Di Linh, Lam Ha, coffee is purchased at 117.800 VND/kg.
Today’s coffee price on 14/8 in Dak Lak province is purchased at around 118.500 VND/kg; in Cu M’gar district, coffee is purchased at around 118.400 VND/kg, and in Ea H’leo district, Buon Ho town, it is purchased at the same price of 118.400 VND/kg.
Coffee price list today August 14, 2024
 |
Coffee price update world At 20:30 on August 14, 2024 Vietnam time on the London exchange, the price of Robusta coffee futures contract for monthly delivery September 2024 on the London exchange was at 4.454 USD/ton, up 79 USD compared to the beginning of the trading session.
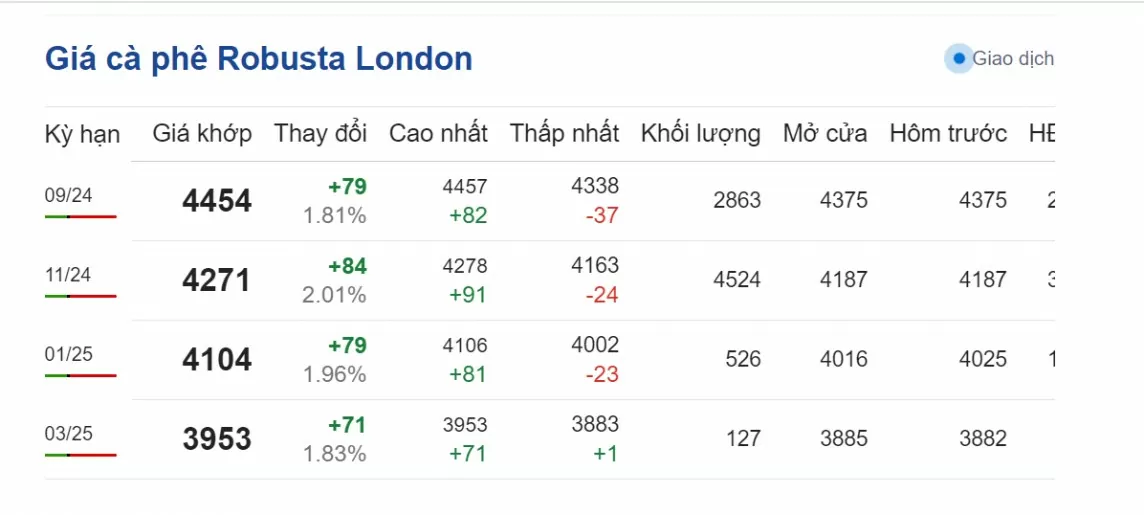 |
| Coffee price today August 14, 2024: Robusta coffee price on London floor. (Photo: Screenshot giacaphe.com |
The monthly delivery term November 2024 is 4.271 USD/ton, up 84 USD; the monthly delivery term January 2025 is 4.104 USD/ton, up 79 USD and the monthly delivery term March 2025 is 3.953 USD/ton, up 71 USD.
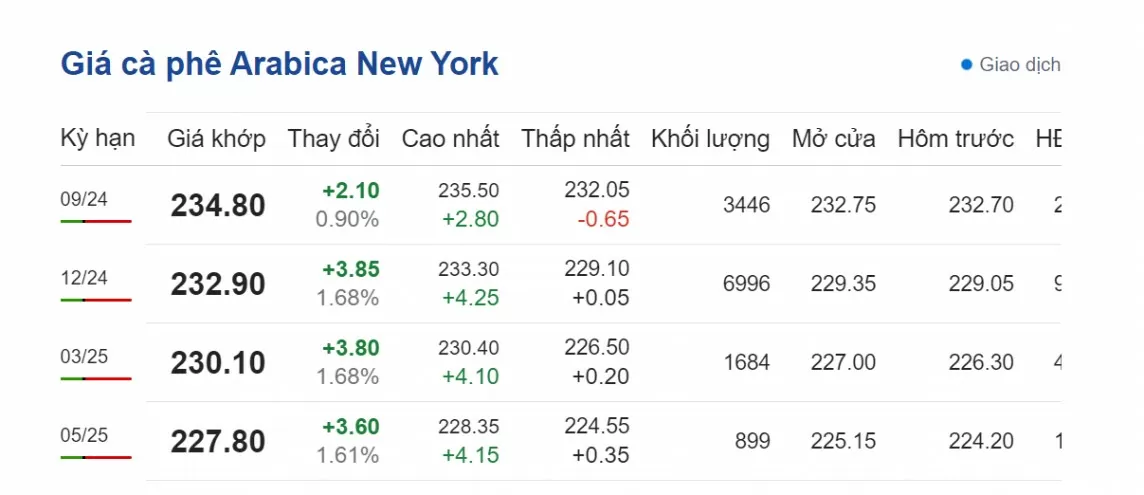 |
| Today’s coffee price August 14, 2024: New York Arabica coffee price (Photo: Screenshot giacaphe.com |
In particular, the price of Arabica coffee on the New York floor today at 20:30 p.m. on July 134, 8 increased in all terms, fluctuating at 2024 – 227.80 cents/lb.
Specifically, the monthly delivery term September 2024 is 234.80 cents/lb; up 2.10 cents/lb compared to the beginning of the session. The monthly delivery term December 2024 is 232.90 cents/lb, up 3.85 cents/lb; the monthly delivery term March 2025 is 230.10 cents/lb, up 3.80 cents/lb and the monthly delivery term May 2025 is 227.80 cents/lb, up 3.60 cents/lb.
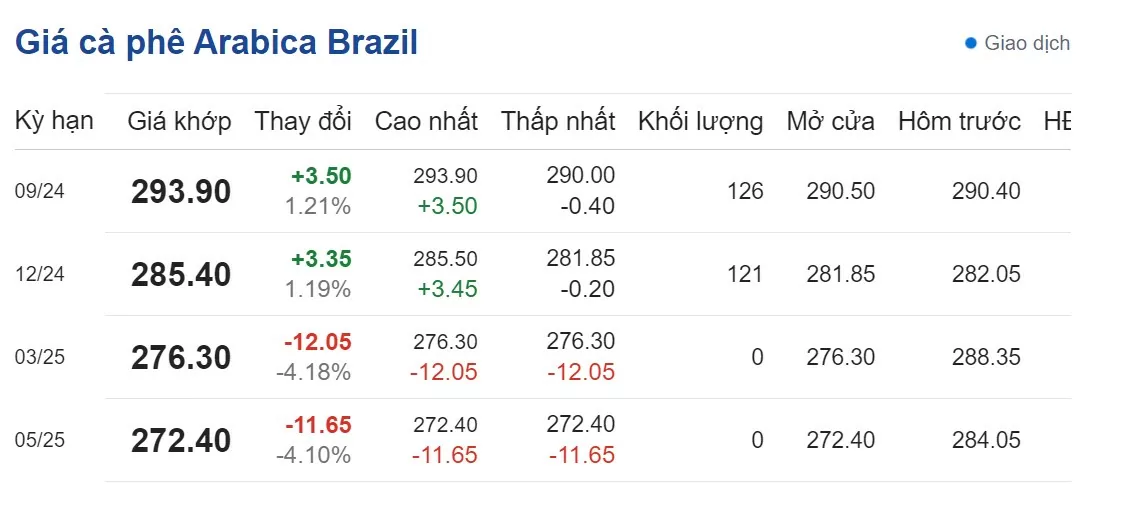 |
| Coffee price today August 14, 2024: Brazilian Arabica coffee price. (Photo: Screenshot giacaphe.com) |
Brazilian Arabica coffee prices today at 20:30 on August 14, 2024 increased and decreased in opposite directions. Specifically, the monthly delivery term September 2024 was 293.90 USD/ton, up 1.21%; the monthly delivery term December 2024 was 285.40 USD/ton, up 1.19%; the monthly delivery term March 2025 was 276.30 USD/ton, down 4.18% and the monthly delivery term May 2025 was 272.40 USD/ton, down 4.10%.
Robusta coffee traded on ICE Futures Europe (London floor) opens at 16:00 and closes at 00:30 (the next day), Vietnam time.
Arabica coffee on the ICE Futures US floor (New York floor) opens at 16:15 p.m. and closes at 01:30 a.m. (the next day), Vietnam time.
Strong Robusta exports from Brazil are helping to offset supply shortages from Vietnam, traders said. Cecafe said Brazil’s Robusta coffee exports in the month of July 2024 surged 82,2% year-on-year to 2023 bags (900.000kg).
Agronomists say that light and localized frosts in Brazil occur strongly in the southern region of the country, basically not affecting coffee and sugarcane growing areas.
Brazilian coffee export association Cecafé also reported that total green coffee exports in the first seven months of 7 increased by 2024% over the same period last year, reaching 51,88 million bags. Of which, there were 25,83 million bags of Arabica coffee, an increase of 20,65% and 31,08 million bags of Robusta Conilon coffee, an increase of 5,18%, compared to the same period last year.
*Information is for reference only. Prices may change depending on time and location.
Sources: https://congthuong.vn/du-bao-gia-ca-phe-1582024-dong-loat-lao-doc-339068.html
Gold price is seeing a dead cat bounce early Tuesday after being hammered down to two-month lows of $2,611 on Wednesday. Attention now turns to speeches from several US Federal Reserve (Fed) policymakers due later in the day for fresh hints on the central bank’s interest rate cut outlook.
In the meantime, Gold traders are likely to take cues from the prevalent market sentiment and the US Dollar price action, as they continue to digest the latest measures under consideration by China to support its housing sector.
Citing people familiar with the matter, Bloomberg News reported that Chinese authorities are outlining a plan enabling major cities, such as Shanghai and Beijing, to reduce the deed tax for buyers to as low as 1%, down from the current rate of up to 3%.
Following the market’s disappointment over China’s 10 trillion yuan ($1.4 trillion) debt package, any additional supportive measures are unlikely to have any positive market impact, as traders remain wary of potential trade tariffs that could be imposed by US President-elect Donald Trump when he returns to office in January next year.
Also, traders refrain from placing fresh bets on the Gold price heading toward Wednesday’s high-impact US Consumer Price Index (CPI) inflation data, which could significantly impact the Fed’s path forward on rates and the US Dollar (USD).
That said, any upside attempt in Gold price could likely be limited as markets continue to favor the USD amid the ‘Trump trades’ and fading expectations of future rate cuts by the Fed.
A solid win for Trump in the US presidential race and a likely Republican majority in Congress have boosted expectations for a more straightforward path to implement his policies. Trump’s policies on foreign trade and tax cuts are seen as inflationary, which could dissuade the Fed from continuing its easing cycle. This, in turn, could support the USD at the expense of Gold price.
Markets are currently pricing in a 67% chance that the Fed will lower rates by 25 basis points (bps) in December, the CME Group’s FedWatch Tool showed, down from about 83% seen at the start of the month. Therefore, Fedspeak is eagerly awaited to seek more clues on the Fed’s rate cut outlook.
Having taken down all the major Fibonacci Retracement (Fibo) levels recently, Gold price Is consolidating the downside before the next push lower.
In doing so, Gold price has retraced the entire advance from the October 10 low of $2,604 to the all-time high of $2,790.
The 14-day Relative Strength Index (RSI) remains below the 50 level, keeping the downside risks well in place.
Any recovery in Gold price will need to find acceptance above the strong resistance near $2,645, where the 50-day Simple Moving Average (SMA) and the 78.6% Fibo level of the same ascent close in.
The next topside barriers are 61.8% Fibo and 50% Fibo supports-turned-resistances at $2,673 and $2,695, respectively.
If the downtrend regains traction, sellers will attack the October 10 low of $2,604, below which a test of the 100-day SMA at $2,538 will be inevitable in the coming days.
As of today, there is a potential bull breakout of a symmetrical triangle formation approaching. A rise above the top line will provide an initial sign of a potential breakout. However, since the swing high of 3.02 is not too much higher, a decisive advance above that price level should provide a more reliable bullish signal as it will further confirm strength. A trendline break alone generally needs further confirmation for greater validation.
Let’s look at a couple ways to consider upside targets. First, previous price structure marks potential resistance. Each prior swing high within the triangle pattern identifies a potential resistance zone as it was an area of resistance in the recent past as the triangle formation evolved. The swing high of 3.02 is followed by the peak from June at 3.16. Next up is the swing high from January at 3.39, followed by the 2023 peak at 3.64.
Then, price symmetry is analyzed looking for potential pivots where there is a match between swings, A pivot area could lead to a pullback or a breakthrough. There are three rising ABCD patterns shown on the chart to highlight price symmetry. The largest pattern is shown in orange, and it begins from the April swing low (A).
Since it is the largest pattern as it covers the longest time frame, it identifies the potentially more significant price target, which is 3.45. The next rising ABCD pattern is in purple, and it points to a potential pivot at 3.35. A more recent and therefore smaller rising ABCD pattern in green points to a potential initial pilot of 3.22 for natural gas once a sustained breakout of the triangle occurs.
For a look at all of today’s economic events, check out our economic calendar.
Silver price drops over 1.80% on Monday trading late in the New York session, trading below the $31.00 a troy ounce, amid worries about Trump’s second term could escalate a trade war. At the time of writing, the XAG/USD trades at $30.69, after hitting a daily high of $31.55.
The uptrend in Silver prices is intact, yet after falling below the 50-day Simple Moving Average (SMA) at $31.41, sponsored XAG’s leg down to test the 100-day SMA at $30.28. Indicators such as the Relative Strength Index (RSI) turned bearish, and drops further, an indication that if sellers clear the latest key support area between $30.00-$30.28, they would be in charge.
In that outcome, the next support would be the 200-day SMA at $28.55, followed by the September 6 low of $27.69
Conversely, if buyers reclaim $31.00, look for a test of the 50-day SMA. Once cleared, the next supply zone would be the November 7 high at $32.15.
Silver is a precious metal highly traded among investors. It has been historically used as a store of value and a medium of exchange. Although less popular than Gold, traders may turn to Silver to diversify their investment portfolio, for its intrinsic value or as a potential hedge during high-inflation periods. Investors can buy physical Silver, in coins or in bars, or trade it through vehicles such as Exchange Traded Funds, which track its price on international markets.
Silver prices can move due to a wide range of factors. Geopolitical instability or fears of a deep recession can make Silver price escalate due to its safe-haven status, although to a lesser extent than Gold’s. As a yieldless asset, Silver tends to rise with lower interest rates. Its moves also depend on how the US Dollar (USD) behaves as the asset is priced in dollars (XAG/USD). A strong Dollar tends to keep the price of Silver at bay, whereas a weaker Dollar is likely to propel prices up. Other factors such as investment demand, mining supply – Silver is much more abundant than Gold – and recycling rates can also affect prices.
Silver is widely used in industry, particularly in sectors such as electronics or solar energy, as it has one of the highest electric conductivity of all metals – more than Copper and Gold. A surge in demand can increase prices, while a decline tends to lower them. Dynamics in the US, Chinese and Indian economies can also contribute to price swings: for the US and particularly China, their big industrial sectors use Silver in various processes; in India, consumers’ demand for the precious metal for jewellery also plays a key role in setting prices.
Silver prices tend to follow Gold’s moves. When Gold prices rise, Silver typically follows suit, as their status as safe-haven assets is similar. The Gold/Silver ratio, which shows the number of ounces of Silver needed to equal the value of one ounce of Gold, may help to determine the relative valuation between both metals. Some investors may consider a high ratio as an indicator that Silver is undervalued, or Gold is overvalued. On the contrary, a low ratio might suggest that Gold is undervalued relative to Silver.
Spot Gold fell throughout the Asian and European sessions as demand for the US Dollar continues following last week’s United States (US) events. Former President Donald Trump’s victory in the 2024 election and signs that Republicans will take full control of Congress fueled the USD amid hopes the upcoming government will strengthen the local currency. Even further, the Federal Reserve (Fed) announced a modest 25 basis points (bps) interest rate cut, sticking to its path without showing concerns about the economy’s performance.
Beyond US developments, market players are paying close attention to what’s happening in China. Inflation, as measured by the Consumer Price Index (CPI) resulted negative in October, posting a -0.3% MoM. Furthermore, the annualized Producer Price Index (PPI) declined 2.9% in October, fueling deflation-related concerns.
Data-wise, the macroeconomic calendar had nothing relevant to offer, with investors awaiting the US October CPI, scheduled for release next Wednesday. US inflation, at this point, may be irrelevant, considering investors are looking at whatever the new government will bring to the world’s largest economy.
From a technical point of view, XAU/USD is poised to extend its slump. The bright metal trades near the $2,600 mark and at fresh one-month lows. In the mentioned time frame, Gold develops well below a now flat 20 Simple Moving Average (SMA), while the 100 and 200 SMAs head firmly north far below the current level. Additionally, technical indicators head south almost vertically, well below their midlines, reflecting the strong selling interest.
The near-term technical picture suggests XAU/USD will extend its slide. In the 4-hour chart, a bearish 20 SMA accelerated south after crossing below a flat 200 SMA while providing intraday resistance around the daily high. At the same time, the Momentum indicator heads south almost vertically, while the Relative Strength Index (RSI) indicator maintains its downward slope at around 23 without signs of downward exhaustion.
Support levels: 2,601.90 2,588.70 2,572.45
Resistance levels: 2,627.10 2,639.05 2,651.00
Silver price (XAG/USD) slides below the key support of $31.00 in Monday’s North American session. The white metal weakens as the US Dollar (USD) rallies on optimism over Republican Donald Trump’s victory in the United States (US) presidential elections.
Trump vowed to raise import tariffs by 10% universally and lower corporate taxes in his election campaign, a scenario that would boost fiscal deficit and inflationary pressures. This would force the Federal Reserve (Fed) to turn hawkish on interest rates. The impact will be favorable for the US Dollar (USD) and bond yields. Usually, higher yields on interest-bearing assets increase the opportunity cost of holding an investment in non-yielding assets, such as Silver.
At the time of writing, the US Dollar Index (DXY), which tracks the Greenback’s value against six major currencies, surges above 105.60. 10-year US Treasury yields soar to 4.37%. This week, investors will be focused on speeches from a slew of Fed officials for fresh interest rate guidance. According to the CME FedWatch tool, the Fed is expected to cut interest rates by 25 basis points (bps) again to 4.25%-4.50% in the December meeting.
Meanwhile, an absence of China’s stimulus package allocation has also weighed on the Silver. Silver, as a metal, has applications in various industries such as power, Electric Vehicles, and mining, etc, and a smaller-than-expected stimulus boost has weakened Silver’s appeal.
On Friday, the National People’s Congress (NPC) unveiled a 10 trillion yuan debt package to stabilize economic growth.
“It may be disappointing for those who were expecting the NPC meeting to approve a massive fiscal package, but the expectation is unrealistic because the policy goal is to achieve the GDP growth target and reduce tail risks, not to reflate the economy in any meaningful way,” analysts at Macquarie said.
Silver price declines toward the upward-sloping trendline around $29.00, plotted from the February 28 low of $22.30. The white metal weakened after breaking below the horizontal support plotted from May 21 high of $32.50.
The near-term trend of the Silver price has weakened as it establishes below the 50-day Exponential Moving Average (EMA), which trades around $31.60.
The 14-day Relative Strength Index (RSI) slides to near 40.00. A bearish momentum will trigger if the RSI (14) drops below the same.
Silver is a precious metal highly traded among investors. It has been historically used as a store of value and a medium of exchange. Although less popular than Gold, traders may turn to Silver to diversify their investment portfolio, for its intrinsic value or as a potential hedge during high-inflation periods. Investors can buy physical Silver, in coins or in bars, or trade it through vehicles such as Exchange Traded Funds, which track its price on international markets.
Silver prices can move due to a wide range of factors. Geopolitical instability or fears of a deep recession can make Silver price escalate due to its safe-haven status, although to a lesser extent than Gold’s. As a yieldless asset, Silver tends to rise with lower interest rates. Its moves also depend on how the US Dollar (USD) behaves as the asset is priced in dollars (XAG/USD). A strong Dollar tends to keep the price of Silver at bay, whereas a weaker Dollar is likely to propel prices up. Other factors such as investment demand, mining supply – Silver is much more abundant than Gold – and recycling rates can also affect prices.
Silver is widely used in industry, particularly in sectors such as electronics or solar energy, as it has one of the highest electric conductivity of all metals – more than Copper and Gold. A surge in demand can increase prices, while a decline tends to lower them. Dynamics in the US, Chinese and Indian economies can also contribute to price swings: for the US and particularly China, their big industrial sectors use Silver in various processes; in India, consumers’ demand for the precious metal for jewellery also plays a key role in setting prices.
Silver prices tend to follow Gold’s moves. When Gold prices rise, Silver typically follows suit, as their status as safe-haven assets is similar. The Gold/Silver ratio, which shows the number of ounces of Silver needed to equal the value of one ounce of Gold, may help to determine the relative valuation between both metals. Some investors may consider a high ratio as an indicator that Silver is undervalued, or Gold is overvalued. On the contrary, a low ratio might suggest that Gold is undervalued relative to Silver.
Gold price has opened a new week on the back foot below $2,700, looking to extend its three-week losing streak. Rebounding US Treasury bond yields and China’s economic concerns offset a pause in the US Dollar( USD) upsurge, exerting additional downside pressure on Gold price.
US Treasury bond yields stage a comeback in Asian trading on Monday after a dovish US Federal Reserve (Fed) interest-rate cut decision-led retracement late last week.
Meanwhile, the market’s disappointment with China’s 10 trillion yuan ($1.4 trillion) debt package and softening inflation raised concerns over the dragon nation’s economic prospects, rendering negative for Gold price. China is the world’s biggest Gold consumer.
China’s CPI rose 0.3% last month from a year earlier, slowing from September’s 0.4% rise and the lowest since June, data from the National Bureau of Statistics (NBS) showed on Saturday, missing a 0.4% increase estimated.
Further, investors remain wary of the more profound economic consequences of potential tariffs that US President-elect Donald Trump will impose once he returns to office in January of next year. This nervousness remains a drag on the bright metal even as USD buyers take a breather following the previous week’s relentless rise.
Gold traders also resort to position adjustments heading into the all-important US Consumer Price Index (CPI) inflation data due for release on Wednesday. However, a Veterans Day holiday in the US could exaggerate the Gold price action in the upcoming sessions.
Looking ahead, the broader market sentiment will play a pivotal role in influencing the value of the USD and the Gold price amid holiday-thinned trading conditions.
As observed on the daily chart, Gold price breached support at $2,673, the 61.8% Fibonacci Retracement (Fibo) level of the latest record rally from the October 10 low of $2,604 to the new all-time high of $2,790, as it witnessed a fresh leg down.
If the downside momentum gathers traction, sellers will attack $2,641 strong support again, which is the confluence of the 50-day Simple Moving Average (SMA) and the 78.6% Fibo level of the same advance.
The 14-day Relative Strength Index (RSI) points lower below the 50 level, having pierced that level from above on Friday. The leading indicator, therefore, suggests that more pain remains in the offing for Gold price.
On finding a solid foothold below the abovementioned critical support at $2,641, Gold sellers could flex their muscles toward the October 10 low of $2,604.
Conversely, Gold buyers need acceptance above the $2,700 barrier to test the healthy resistance at $2,718, where the 38.2% Fibo level and 21-day SMA converge.
A fresh uptrend would be initiated above that level as buyers aim for the previous static resistance near $2,745, where the 23.6% Fibo aligns.
Gold has played a key role in human’s history as it has been widely used as a store of value and medium of exchange. Currently, apart from its shine and usage for jewelry, the precious metal is widely seen as a safe-haven asset, meaning that it is considered a good investment during turbulent times. Gold is also widely seen as a hedge against inflation and against depreciating currencies as it doesn’t rely on any specific issuer or government.
Central banks are the biggest Gold holders. In their aim to support their currencies in turbulent times, central banks tend to diversify their reserves and buy Gold to improve the perceived strength of the economy and the currency. High Gold reserves can be a source of trust for a country’s solvency. Central banks added 1,136 tonnes of Gold worth around $70 billion to their reserves in 2022, according to data from the World Gold Council. This is the highest yearly purchase since records began. Central banks from emerging economies such as China, India and Turkey are quickly increasing their Gold reserves.
Gold has an inverse correlation with the US Dollar and US Treasuries, which are both major reserve and safe-haven assets. When the Dollar depreciates, Gold tends to rise, enabling investors and central banks to diversify their assets in turbulent times. Gold is also inversely correlated with risk assets. A rally in the stock market tends to weaken Gold price, while sell-offs in riskier markets tend to favor the precious metal.
The price can move due to a wide range of factors. Geopolitical instability or fears of a deep recession can quickly make Gold price escalate due to its safe-haven status. As a yield-less asset, Gold tends to rise with lower interest rates, while higher cost of money usually weighs down on the yellow metal. Still, most moves depend on how the US Dollar (USD) behaves as the asset is priced in dollars (XAU/USD). A strong Dollar tends to keep the price of Gold controlled, whereas a weaker Dollar is likely to push Gold prices up.
Gold price (XAU/USD) trades in negative territory near $2,680 during the early Asian session on Monday. The downtick of the precious metal is pressured by a stronger US Dollar (USD) due to Donald Trump’s victory.
Meanwhile, the US Dollar Index (DXY), an index of the value of the USD measured against a basket of six world currencies, extends its upside to around 105.00, the four-month high.
Trump’s victory has fuelled questions about whether the US Federal Reserve (Fed) may proceed to cut rates at a slower and smaller pace. This, in turn, boosts the Greenback and weighs on the USD-denominated Gold price.
“This rally in the dollar and yields has put pressure on gold, which traditionally falls as real interest rates rise, reflecting reduced demand for safe-haven assets in the short term,” noted Matthew Jones, precious metals analyst at London-based metals trader Solomon Global. “However, from a longer-term, macro perspective, the future is ‘as good as gold,” added Jones.
The upbeat US economic data on Friday contributes to the USD’s upside. The US Consumer Sentiment Index rose to 73.0 in November from 70.5 in October, according to the preliminary reading by the University of Michigan. This figure came in better than the market expectation of 71.0.
On the other hand, the global economic uncertainty and the ongoing geopolitical tensions in the Middle East might help limit the yellow metal’s losses. Israeli army Chief of Staff Herzi Halevi approved the expansion of the ground invasion of southern Lebanon, state broadcaster Kan reports.
Gold has played a key role in human’s history as it has been widely used as a store of value and medium of exchange. Currently, apart from its shine and usage for jewelry, the precious metal is widely seen as a safe-haven asset, meaning that it is considered a good investment during turbulent times. Gold is also widely seen as a hedge against inflation and against depreciating currencies as it doesn’t rely on any specific issuer or government.
Central banks are the biggest Gold holders. In their aim to support their currencies in turbulent times, central banks tend to diversify their reserves and buy Gold to improve the perceived strength of the economy and the currency. High Gold reserves can be a source of trust for a country’s solvency. Central banks added 1,136 tonnes of Gold worth around $70 billion to their reserves in 2022, according to data from the World Gold Council. This is the highest yearly purchase since records began. Central banks from emerging economies such as China, India and Turkey are quickly increasing their Gold reserves.
Gold has an inverse correlation with the US Dollar and US Treasuries, which are both major reserve and safe-haven assets. When the Dollar depreciates, Gold tends to rise, enabling investors and central banks to diversify their assets in turbulent times. Gold is also inversely correlated with risk assets. A rally in the stock market tends to weaken Gold price, while sell-offs in riskier markets tend to favor the precious metal.
The price can move due to a wide range of factors. Geopolitical instability or fears of a deep recession can quickly make Gold price escalate due to its safe-haven status. As a yield-less asset, Gold tends to rise with lower interest rates, while higher cost of money usually weighs down on the yellow metal. Still, most moves depend on how the US Dollar (USD) behaves as the asset is priced in dollars (XAU/USD). A strong Dollar tends to keep the price of Gold controlled, whereas a weaker Dollar is likely to push Gold prices up.
Silver retreated from two-day highs of $32.00 and tumbled below the 50-day Simple Moving Average (SMA) at $31.37 late in the North American session. This was weighed down by a strong US Dollar underpinned by former President Donald Trump’s victory. At the time of writing, the XAG/USD trades at $31.29, down 2.29%.
Silver’s price uptrend remains in play despite posting solid losses. The fall of US Treasury yields kept the grey metal from falling further, but a decisive break below the November 6 low of $30.84 could exacerbate a deeper pullback. In that outcome, the next support would be the 100-day SMA at $30.27, followed by the September 5 high turned support at $29.17.
For a bullish resumption, the XAG/USD must close above the $31.50 area. This could pave the way to challenge the July 11 high at $31.75. A breach of the latter will expose $32.00, followed by May’s 20 peak at $32.51.
Momentum is bearish in the near term, as shown by the Relative Strength Index (RSI), breaching its neutral line into the seller’s area.
Silver is a precious metal highly traded among investors. It has been historically used as a store of value and a medium of exchange. Although less popular than Gold, traders may turn to Silver to diversify their investment portfolio, for its intrinsic value or as a potential hedge during high-inflation periods. Investors can buy physical Silver, in coins or in bars, or trade it through vehicles such as Exchange Traded Funds, which track its price on international markets.
Silver prices can move due to a wide range of factors. Geopolitical instability or fears of a deep recession can make Silver price escalate due to its safe-haven status, although to a lesser extent than Gold’s. As a yieldless asset, Silver tends to rise with lower interest rates. Its moves also depend on how the US Dollar (USD) behaves as the asset is priced in dollars (XAG/USD). A strong Dollar tends to keep the price of Silver at bay, whereas a weaker Dollar is likely to propel prices up. Other factors such as investment demand, mining supply – Silver is much more abundant than Gold – and recycling rates can also affect prices.
Silver is widely used in industry, particularly in sectors such as electronics or solar energy, as it has one of the highest electric conductivity of all metals – more than Copper and Gold. A surge in demand can increase prices, while a decline tends to lower them. Dynamics in the US, Chinese and Indian economies can also contribute to price swings: for the US and particularly China, their big industrial sectors use Silver in various processes; in India, consumers’ demand for the precious metal for jewellery also plays a key role in setting prices.
Silver prices tend to follow Gold’s moves. When Gold prices rise, Silver typically follows suit, as their status as safe-haven assets is similar. The Gold/Silver ratio, which shows the number of ounces of Silver needed to equal the value of one ounce of Gold, may help to determine the relative valuation between both metals. Some investors may consider a high ratio as an indicator that Silver is undervalued, or Gold is overvalued. On the contrary, a low ratio might suggest that Gold is undervalued relative to Silver.