The main tag of Gold Today Price Articles.
You can use the search box below to find what you need.
[wd_asp id=1]
The main tag of Gold Today Price Articles.
You can use the search box below to find what you need.
[wd_asp id=1]
Gold price is finding some fresh demand near $2,570 early Wednesday, as buyers look to fight back control following the previous day’s correction from record highs of $2,590. Traders, however, could refrain from placing fresh directional bets on Gold price in the lead-up to all-important US Federal Reserve (Fed) monetary policy announcements.
On the Fed day, markets continue to price in a 65% probability of 50 basis points (bps) interest rate cut, the CME Group’s FedWatch Tool showed, reviving the selling interest around the US Dollar (USD), as the US Treasury bond yields also turn defensive amidst the market caution.
Thus. Gold price attempts to retake the all-time-high just shy of the $2,600 mark, with eyes on the Fed verdict, Chairman Jerome Powell’s press conference and the Dot Plot chart, all of which will help gauge the US central bank’s future policy action.
If the Fed delivers a 25 bps rate cut later this Wednesday, it could fuel a knee-jerk US Dollar upswing. However, the immediate reaction to the Fed announcements could be overshadowed by the implications of the Fed’s projections and Powell’s words. Gold price, therefore, remains subject to intense volatility during the Fed event.
An outrightly dovish outcome and rate projections by the world’s most powerful central bank could prompt Gold price to refresh record highs at the expense of the US Dollar. “A dovish Fed on a substantial easing path should generally lead to a weaker dollar,” said Nathan Swami, head of currency trading at Citi in Singapore.
In contrast, should the Fed acknowledge potential upside risks to inflation and maintain a cautious tone, it could bring the hawks back in the game, weighing negatively on the non-interest-bearing Gold price.
Gold price corrected briefly from record highs on Tuesday, courtesy of a profit-taking spree in the US Dollar ahead of the Fed event while strong US Retail Sales data also contributed to the resurgent USD demand. US Retail Sales rebounded by 0.1% MoM in August, data showed on Tuesday, against expectations for a 0.2% contraction. Data somewhat eased fears over a potential US ‘hard-landing’.
Gold buyers regain control, as the 14-day Relative Strength Index (RSI) remains comfortably above the 50 level, having eased off from near the overbought territory.
The optimism prevails so long as they defend the one-and-a-half-month-old symmetrical triangle target now support at $2,560.
That said, the immediate resistance is seen at the record high of $2,590, above which the $2,600 level will be tested.
Acceptance above that level will call for a test of the $2,650 psychological barrier.
If the Fed disappoints the doves, Gold price could witness a fresh sell-off, which could challenge the August 20 high of $2,532.
Additional declines will threaten the 21-day Simple Moving Average (SMA) at $2,522, below which the $2,500 mark will be on sellers’ radars.
The Federal Reserve (Fed) deliberates on monetary policy and makes a decision on interest rates at eight pre-scheduled meetings per year. It has two mandates: to keep inflation at 2%, and to maintain full employment. Its main tool for achieving this is by setting interest rates – both at which it lends to banks and banks lend to each other. If it decides to hike rates, the US Dollar (USD) tends to strengthen as it attracts more foreign capital inflows. If it cuts rates, it tends to weaken the USD as capital drains out to countries offering higher returns. If rates are left unchanged, attention turns to the tone of the Federal Open Market Committee (FOMC) statement, and whether it is hawkish (expectant of higher future interest rates), or dovish (expectant of lower future rates).
Next release: Wed Sep 18, 2024 18:00
Frequency: Irregular
Consensus: 5.25%
Previous: 5.5%
Source: Federal Reserve
Silver price consolidates for the second straight day, prints back-to-back doji’s a sign that neither buyers nor sellers control the grey’s metal price action. At the time of writing, XAG/USD trades at $30.69, virtually unchanged, as the Wednesday Asian session commences.
Silver has been subdued during the last few days as traders brace for the Fed’s decision.
Momentum remains bullish, as portrayed by the Relative Strength Index (RSI), but its slope turned flat, hitting indecision amongst investors.
If XAG/USD clears the current week’s high of $31.09, this could underpin Siver’s to challenge the July 11 high at $31.75 ahead of the year-to-date (YTD) high of $32.51. On the other hand, if Silver drops below the September 17 daily low of $30.52, it would expose the September 13 low of $29.86, followed by the 100-day moving average (DMA) at $29.36, followed by the 50-DMA at $28.98.
Silver is a precious metal highly traded among investors. It has been historically used as a store of value and a medium of exchange. Although less popular than Gold, traders may turn to Silver to diversify their investment portfolio, for its intrinsic value or as a potential hedge during high-inflation periods. Investors can buy physical Silver, in coins or in bars, or trade it through vehicles such as Exchange Traded Funds, which track its price on international markets.
Silver prices can move due to a wide range of factors. Geopolitical instability or fears of a deep recession can make Silver price escalate due to its safe-haven status, although to a lesser extent than Gold’s. As a yieldless asset, Silver tends to rise with lower interest rates. Its moves also depend on how the US Dollar (USD) behaves as the asset is priced in dollars (XAG/USD). A strong Dollar tends to keep the price of Silver at bay, whereas a weaker Dollar is likely to propel prices up. Other factors such as investment demand, mining supply – Silver is much more abundant than Gold – and recycling rates can also affect prices.
Silver is widely used in industry, particularly in sectors such as electronics or solar energy, as it has one of the highest electric conductivity of all metals – more than Copper and Gold. A surge in demand can increase prices, while a decline tends to lower them. Dynamics in the US, Chinese and Indian economies can also contribute to price swings: for the US and particularly China, their big industrial sectors use Silver in various processes; in India, consumers’ demand for the precious metal for jewellery also plays a key role in setting prices.
Silver prices tend to follow Gold’s moves. When Gold prices rise, Silver typically follows suit, as their status as safe-haven assets is similar. The Gold/Silver ratio, which shows the number of ounces of Silver needed to equal the value of one ounce of Gold, may help to determine the relative valuation between both metals. Some investors may consider a high ratio as an indicator that Silver is undervalued, or Gold is overvalued. On the contrary, a low ratio might suggest that Gold is undervalued relative to Silver.
If a deeper pullback comes before new trend highs, natural gas should find support at or above its 200-Day MA, which is now at 2.24. A bullish breakout of the 200-Day line triggered last Wednesday, and it was confirmed the following day by a daily close above the line. Previously, natural gas had traded below the 200-Day MA since July 2. Since the price of natural gas moved away from the line following the breakout, it is the market’s way of confirming subsequent strength.
Therefore, the first real pullback to test support around the 200-Day line should be successful. If it is not, and natural gas falls below the 200-Day line, it will likely find support around the 20-Day and 50-Day MAs, from 2.18 to 2.16, respectively. However, that would be a deeper pullback that negates some of the strength indicated by the bullish breakout above the 200-Day line.
There are several higher targets yet to be tested. The first target zone is from 2.52 to 2.54. It is derived by the 50% retracement at 2.52, and an initial target for a rising ABCD pattern at 2.54. That price range is followed by a range from 2.65 to 2.72. The top of the range is significant is it marks an initial target derived from measuring the recent double bottom. A bull breakout of the double bottom triggered last Wednesday on a rally above 2.30. The 61.8% Fibonacci retracement is also contained within the price zone at 2.67.
Dynamics seen in the monthly chart confirm a bullish outlook. A bull breakout on the monthly time frame triggered at the same time the double bottom triggered as the prior swing high of 2.30 was also a monthly high. Since it covers a larger time frame it is given greater significance than the shorter weekly and daily charts. It just triggered last week and continues to point to higher prices for natural gas.
For a look at all of today’s economic events, check out our economic calendar.
Gold price is marginally lower on Tuesday, with XAU/USD trading in the $2,560 region in the American session. The US Dollar gathered modest strength ahead of Wall Street’s opening amid better-than-anticipated United States (US) data. Local indexes hold on to modest gains, reflecting the optimistic mood that undermines demand for the safe-haven metal.
Still, financial boards’ activity is limited ahead of major central banks’ announcements. The Federal Reserve (Fed) will kick-start the wave of announcements on Wednesday, followed by the Bank of England (BoE) on Thursday and the Bank of Japan (BoJ) on Friday. The Fed is widely anticipated to trim interest rates for the first time in years, a movement that has been priced in long ago. The BoE, on the other hand, will likely remain on hold while speculative interest sees the BoJ hiking rates.
In anticipation of the Fed, speculative interest has priced in a 25 basis points (bps) rate cut, although there are some hopes the central bank will go for a wider trim of 50 bps. The level of aggressiveness from US officials will determine what will happen with Greenback on Wednesday. The more dovish the decision, meaning a 50 bps trim and anticipation of more cuts coming, the more will suffer the USD. The US Dollar, on the other hand, can recover sharply should the central bank deliver a more hawkish stance.
The daily chart for the XAU/USD pair shows the slide seems corrective. The pair keeps developing above all its moving averages, with the 20 Simple Moving Average (SMA) partially losing its bullish strength but well above the longer ones, at around $2,520. Technical indicators, in the meantime, remain well above their midlines, although lacking clear directional strength. The Relative Strength Index (RSI) indicator eases from near overbought readings but not enough to anticipate a steeper decline.
In the near term, however, the risk skews to the downside. In the 4-hour chart, XAU/USD has broken below a bullish 20 SMA, while the 100 and 200 SMAs aim marginally higher, far below the current level. Finally, technical indicators aim south almost vertically, currently challenging their midlines and hinting at another leg south, particularly if Gold pierces the intraday low at $2,561.65.
Support levels: 2,561.65 2,550.00 2,542.40
Resistance levels: 2,574.80 2,590.00 2,605.00
Silver (XAG/USD) trades with a positive bias around the $30.80-$30.85 area during the Asian session on Tuesday and remains well within the striking distance of a two-month peak touched the previous day.
From a technical perspective, Friday’s convincing breakout through the $30.00 psychological mark barrier, which coincided with a short-term descending trend line, was seen as a fresh trigger for bullish traders. Moreover, oscillators on the daily chart have just started gaining positive traction and support prospects for a further near-term appreciating move for the XAG/USD.
Acceptance above the $31.00 mark will reaffirm the constructive outlook and lift the white metal to the next relevant hurdle near the $31.45-$31.50 supply zone. Some follow-through buying should allow bulls to aim back to reclaim the $32.00 mark. The momentum should allow the XAG/USD to aim back to challenge a one-decade high, around mid-$32.00s touched in May.
On the flip side, any meaningful corrective slide below the $30.50 immediate support is likely to attract fresh buyers and remain cushioned near the aforementioned descending trend-line resistance breakpoint, now turned support, near the $30.00 mark. The latter could act as a key pivotal point, which if broken might prompt some technical selling and make the XAG/USD vulnerable.
The subsequent fall could get extended towards the $29.40-$29.35 intermediate support en route to the $29.00 round figure. Some follow-through selling could drag the XAG/USD to the next relevant support near the $28.20-$28.15 zone. This is followed by the $28.00 mark and the monthly low, around the $27.70 area, which if broken might shift the bias back in favor of bearish traders.
Silver is a precious metal highly traded among investors. It has been historically used as a store of value and a medium of exchange. Although less popular than Gold, traders may turn to Silver to diversify their investment portfolio, for its intrinsic value or as a potential hedge during high-inflation periods. Investors can buy physical Silver, in coins or in bars, or trade it through vehicles such as Exchange Traded Funds, which track its price on international markets.
Silver prices can move due to a wide range of factors. Geopolitical instability or fears of a deep recession can make Silver price escalate due to its safe-haven status, although to a lesser extent than Gold’s. As a yieldless asset, Silver tends to rise with lower interest rates. Its moves also depend on how the US Dollar (USD) behaves as the asset is priced in dollars (XAG/USD). A strong Dollar tends to keep the price of Silver at bay, whereas a weaker Dollar is likely to propel prices up. Other factors such as investment demand, mining supply – Silver is much more abundant than Gold – and recycling rates can also affect prices.
Silver is widely used in industry, particularly in sectors such as electronics or solar energy, as it has one of the highest electric conductivity of all metals – more than Copper and Gold. A surge in demand can increase prices, while a decline tends to lower them. Dynamics in the US, Chinese and Indian economies can also contribute to price swings: for the US and particularly China, their big industrial sectors use Silver in various processes; in India, consumers’ demand for the precious metal for jewellery also plays a key role in setting prices.
Silver prices tend to follow Gold’s moves. When Gold prices rise, Silver typically follows suit, as their status as safe-haven assets is similar. The Gold/Silver ratio, which shows the number of ounces of Silver needed to equal the value of one ounce of Gold, may help to determine the relative valuation between both metals. Some investors may consider a high ratio as an indicator that Silver is undervalued, or Gold is overvalued. On the contrary, a low ratio might suggest that Gold is undervalued relative to Silver.
Silver price (XAG/USD) continues its winning streak that began on September 9, trading around $31.00 per Troy ounce during Monday’s Asian session. The non-yielding Silver extends its upside due to growing speculation that the US Federal Reserve (Fed) will opt for a jumbo 50 basis points rate cut at its upcoming monetary policy meeting.
The demand for Silver is gaining traction due to a weaker US Dollar (USD), driven by lower Treasury yields. As Silver is a dollar-denominated commodity, it becomes cheaper for buyers using other currencies, which helps support increased demand for the precious metal.
The US Dollar Index (DXY), which measures the value of the US Dollar (USD) against its six major peers, trades around 100.81, with 2-year and 10-year yields on US Treasury bonds standing at 3.58% and 3.65%, respectively, at the time of writing.
The market is divided over the scale of the rate cut by the Fed on Wednesday. According to the CME FedWatch Tool, markets anticipate 41.0% odds of a 25 basis point (bps) rate cut by the Fed at its September meeting. The likelihood of a 50 bps rate cut has increased to 59.0%, up from 50.0% a day ago.
Additionally, markets are evaluating demand prospects in China after mixed economic indicators. Silver is essential in various industrial applications, such as electronics, solar panels, and automotive components. Given China’s status as one of the world’s largest manufacturing hubs, the country’s industrial demand for Silver is significant.
Silver is a precious metal highly traded among investors. It has been historically used as a store of value and a medium of exchange. Although less popular than Gold, traders may turn to Silver to diversify their investment portfolio, for its intrinsic value or as a potential hedge during high-inflation periods. Investors can buy physical Silver, in coins or in bars, or trade it through vehicles such as Exchange Traded Funds, which track its price on international markets.
Silver prices can move due to a wide range of factors. Geopolitical instability or fears of a deep recession can make Silver price escalate due to its safe-haven status, although to a lesser extent than Gold’s. As a yieldless asset, Silver tends to rise with lower interest rates. Its moves also depend on how the US Dollar (USD) behaves as the asset is priced in dollars (XAG/USD). A strong Dollar tends to keep the price of Silver at bay, whereas a weaker Dollar is likely to propel prices up. Other factors such as investment demand, mining supply – Silver is much more abundant than Gold – and recycling rates can also affect prices.
Silver is widely used in industry, particularly in sectors such as electronics or solar energy, as it has one of the highest electric conductivity of all metals – more than Copper and Gold. A surge in demand can increase prices, while a decline tends to lower them. Dynamics in the US, Chinese and Indian economies can also contribute to price swings: for the US and particularly China, their big industrial sectors use Silver in various processes; in India, consumers’ demand for the precious metal for jewellery also plays a key role in setting prices.
Silver prices tend to follow Gold’s moves. When Gold prices rise, Silver typically follows suit, as their status as safe-haven assets is similar. The Gold/Silver ratio, which shows the number of ounces of Silver needed to equal the value of one ounce of Gold, may help to determine the relative valuation between both metals. Some investors may consider a high ratio as an indicator that Silver is undervalued, or Gold is overvalued. On the contrary, a low ratio might suggest that Gold is undervalued relative to Silver.
Gold price reached a fresh record high of $2,589.50 a troy ounce on Monday, retreating just modestly from the level and now trading at around $2,582.00 in the American session. XAU/USD surged during Asian trading hours, helped by a resurgent Japanese Yen (JPY), which put pressure on the US Dollar against all major rivals.
The USD/JPY pair fell to its lowest in over a year as investors keep an eye on the interest rate difference between the United States (US) and Japan, as both central banks are meant to announce their monetary policies this week. The Federal Reserve (Fed) is widely anticipated to cut the benchmark interest rate by 25 basis points (bps) on Wednesday, while the Bank of Japan (BoJ) will likely move in the opposite direction on Friday. The US Dollar also fell in anticipation of the Fed’s announcement, as there is a chance the central bank will go for a larger rate cut.
Meanwhile, US Treasury yields trade near fresh multi-month lows. The 10-year note currently offers 3.63%, while the 2-year note yields 3.55%, its lowest in two years.
The XAU/USD pair holds on to modest intraday gains, and technical readings in the daily chart show the risk skews to the upside, although the momentum receded. The pair finally detached from a bullish 20 Simple Moving Average (SMA), currently at around $2,517. The 100 and 100 SMAs gain upward traction far below the shorter one, reflecting persistent buying interest. Finally, technical indicators have turned flat, although they hold well into positive territory.
In the near term, and according to the 4-hour chart, XAU/USD seems poised to correct overbought conditions. Technical indicators are retreating from extreme levels with modest downward slopes, not enough to anticipate a steeper decline. Meanwhile, a firmly bullish 20 SMA heads firmly higher in the $2,550 region, far above the longer ones, which also advance.
Support levels: 2,575.20 2,563.60 2,550.00
Resistance levels: 2,590.00 2,605.00 2,620.00
Silver (XAG/USD) builds on its recent strong upward trajectory witnessed over the past week or so and climbs to a nearly two-month top on Monday. The white metal sticks to its intraday gains through the first half of the European session and currently trades just below the $31.00 mark, up 0.70% for the day.
Looking at the broader picture, Friday’s breakout through a short-term descending trend-line was seen as a fresh trigger for bullish traders. The subsequent move up, along with the fact that oscillators on the daily chart have just started gaining positive traction, suggests that the path of least resistance for the XAG/USD is to the upside and supports prospects for additional gains.
Hence, some follow-through strength towards testing the next relevant hurdle, around the $31.45-$31.50 supply zone, looks like a distinct possibility. The momentum could extend further towards reclaiming the $32.00 mark, above which the XAG/USD could climb back towards challenging a one-decade high, around mid-$32.00s touched in May.
On the flip side, the $30.50-$30.45 horizontal zone now seems to protect the immediate downside. Any further decline could be seen as a buying opportunity and remain cushioned near the aforementioned descending trend-line resistance breakpoint, now turned support, currently near the $30.00 psychological mark. The latter could act as a key pivotal point for short-term traders.
A convincing break below might prompt aggressive technical selling and make the XAG/USD vulnerable to accelerate the fall towards the $29.40-$29.35 region en route to the $29.00 round figure. Some follow-through selling might shift the bias in favor of bears and expose the $27.70 area, or the monthly low, with some intermediate support near the $28.20-$28.15 zone.
Silver is a precious metal highly traded among investors. It has been historically used as a store of value and a medium of exchange. Although less popular than Gold, traders may turn to Silver to diversify their investment portfolio, for its intrinsic value or as a potential hedge during high-inflation periods. Investors can buy physical Silver, in coins or in bars, or trade it through vehicles such as Exchange Traded Funds, which track its price on international markets.
Silver prices can move due to a wide range of factors. Geopolitical instability or fears of a deep recession can make Silver price escalate due to its safe-haven status, although to a lesser extent than Gold’s. As a yieldless asset, Silver tends to rise with lower interest rates. Its moves also depend on how the US Dollar (USD) behaves as the asset is priced in dollars (XAG/USD). A strong Dollar tends to keep the price of Silver at bay, whereas a weaker Dollar is likely to propel prices up. Other factors such as investment demand, mining supply – Silver is much more abundant than Gold – and recycling rates can also affect prices.
Silver is widely used in industry, particularly in sectors such as electronics or solar energy, as it has one of the highest electric conductivity of all metals – more than Copper and Gold. A surge in demand can increase prices, while a decline tends to lower them. Dynamics in the US, Chinese and Indian economies can also contribute to price swings: for the US and particularly China, their big industrial sectors use Silver in various processes; in India, consumers’ demand for the precious metal for jewellery also plays a key role in setting prices.
Silver prices tend to follow Gold’s moves. When Gold prices rise, Silver typically follows suit, as their status as safe-haven assets is similar. The Gold/Silver ratio, which shows the number of ounces of Silver needed to equal the value of one ounce of Gold, may help to determine the relative valuation between both metals. Some investors may consider a high ratio as an indicator that Silver is undervalued, or Gold is overvalued. On the contrary, a low ratio might suggest that Gold is undervalued relative to Silver.
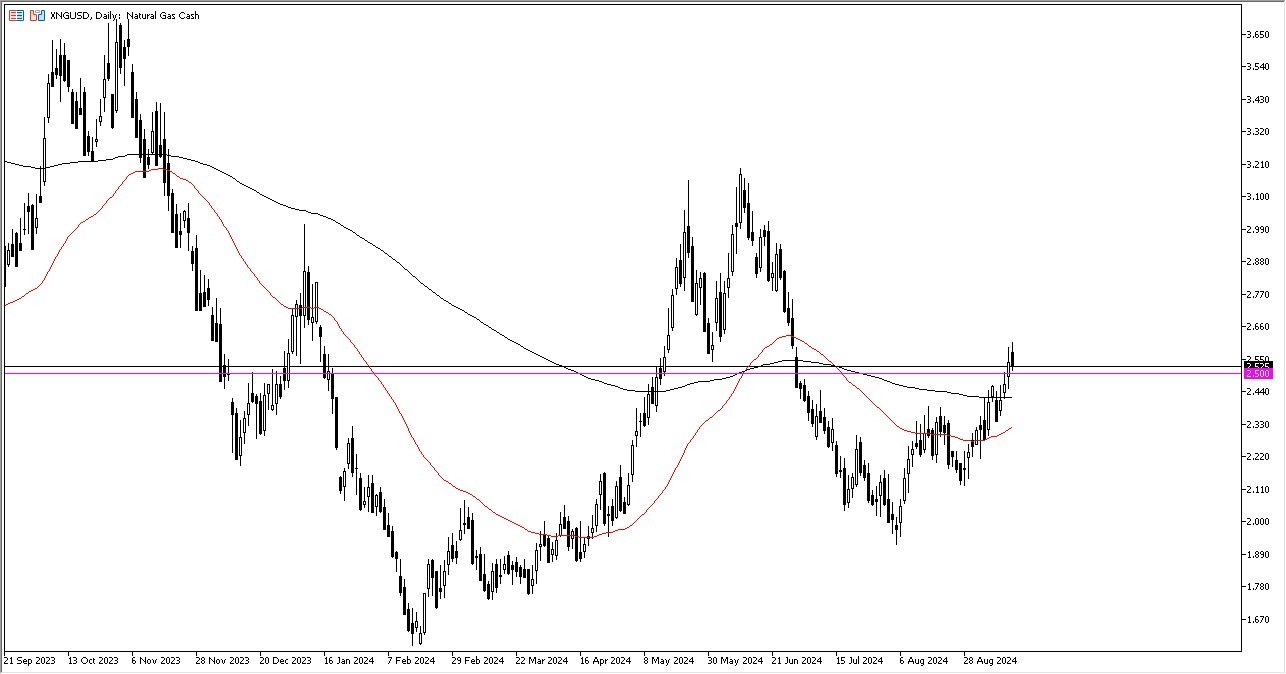
Overall, this is a scenario that not only sees market memory at the $2.50 level, but we also see the 200 day EMA sitting underneath it that should offer support as well. On the other hand, if we turn around and take off to the upside, then we could see a market move that should go much higher, perhaps reaching the $2.80 level. This is a market that I think could be rather explosive, pardon the pun over the next several weeks.

On the other hand, if we turn around and break down below the 200 day EMA, then it’s possible that we could go down to the $2.30 level where we currently see the 50 day EMA. In general, I think this is a market that probably finds its way to the $3 level given enough time. And I am a buyer of this market on dips. Those positions that I’m buying though are small. They’re not huge because I understand how much trouble there is in the natural gas market for those who get over levered. So with this, I remain bullish, but I also recognize that this is just a trade for this time of year. And then once we get into the middle of winter, I tend to dump it and just simply forget about it for a while.
Ready to trade daily Forex analysis? We’ve shortlisted the best commodity brokers in the industry for you.
Gold price (XAU/USD) gains momentum around $2,580 during the early Asian session on Monday. The precious metal reached a fresh all-time high at $2,586 on Friday amid rising expectations of a significant Federal Reserve (Fed) rate cut. The Federal Open Market Committee (FOMC) meeting on Wednesday will be in the spotlight.
The growing speculation of an interest rate cut by the Fed after US economic data signaled a slowing of the economy has boosted the yellow metal as lower interest rates reduce the opportunity cost of holding non-yielding Gold. Financial markets are now pricing in a 48% chance of a 25 basis points (bps ) US rate cut at its upcoming meeting on September 17-18, while the odds of a 50 bps cut stand at 52%, according to the CME FedWatch tool.
“We are headed towards a lower interest rate environment, so gold is becoming a lot more attractive… I think we could potentially have a lot more frequent cuts as opposed to a bigger magnitude,” said Alex Ebkarian, chief operating officer at Allegiance Gold.
Additionally, the ongoing geopolitical tensions in the Middle East provide further support to the safe-haven Gold price. Israeli Prime Minister Benjamin Netanyahu said on Sunday that Yemen’s Houthis will pay a “heavy price” after a missile fired by the group landed in central Israel, per the BBC.
Nonetheless, the sluggish economy and the concerns about the economic slowdown in China might cap the upside for precious metals as China is the world’s biggest producer and consumer. The Chinese Retail Sales and Industrial Production were weaker than the expectation in August. Industrial output grew at the slowest pace since March, while Retail Sales had their second-slowest month of the year.
Gold has played a key role in human’s history as it has been widely used as a store of value and medium of exchange. Currently, apart from its shine and usage for jewelry, the precious metal is widely seen as a safe-haven asset, meaning that it is considered a good investment during turbulent times. Gold is also widely seen as a hedge against inflation and against depreciating currencies as it doesn’t rely on any specific issuer or government.
Central banks are the biggest Gold holders. In their aim to support their currencies in turbulent times, central banks tend to diversify their reserves and buy Gold to improve the perceived strength of the economy and the currency. High Gold reserves can be a source of trust for a country’s solvency. Central banks added 1,136 tonnes of Gold worth around $70 billion to their reserves in 2022, according to data from the World Gold Council. This is the highest yearly purchase since records began. Central banks from emerging economies such as China, India and Turkey are quickly increasing their Gold reserves.
Gold has an inverse correlation with the US Dollar and US Treasuries, which are both major reserve and safe-haven assets. When the Dollar depreciates, Gold tends to rise, enabling investors and central banks to diversify their assets in turbulent times. Gold is also inversely correlated with risk assets. A rally in the stock market tends to weaken Gold price, while sell-offs in riskier markets tend to favor the precious metal.
The price can move due to a wide range of factors. Geopolitical instability or fears of a deep recession can quickly make Gold price escalate due to its safe-haven status. As a yield-less asset, Gold tends to rise with lower interest rates, while higher cost of money usually weighs down on the yellow metal. Still, most moves depend on how the US Dollar (USD) behaves as the asset is priced in dollars (XAU/USD). A strong Dollar tends to keep the price of Gold controlled, whereas a weaker Dollar is likely to push Gold prices up.