The main tag of Gold Today Price Articles.
You can use the search box below to find what you need.
[wd_asp id=1]
The main tag of Gold Today Price Articles.
You can use the search box below to find what you need.
[wd_asp id=1]
Weaker Chinese oil demand, high inventories, and rising U.S. shale production have prompted Goldman Sachs to reduce its expected range for Brent oil prices by $5 to $70-$85 per barrel.
Commercial inventories have been stable in the peak summer demand season, contrary to expectations of drawdowns, analysts at the Wall Street bank wrote in a note carried by Investing.com.
Higher U.S. supply has been offsetting some of the seasonal demand, according to Goldman Sachs.
Efficiency gains among U.S. producers have raised shale supply by 200,000 barrels per day (bpd) above the investment bank’s expectations.
Higher supply from America, and possibly from OPEC+ later this year and in 2025, has led Goldman Sachs to forecast that Brent Crude prices would average below $80 per barrel next year.
The current forecast is now Brent to average $77 a barrel, as OPEC+ could opt for a strategic move to add supply and punish non-OPEC+ growth, according to Goldman’s note carried by Bloomberg.
OPEC+ could decide to add supply on the market in a move that could be “strategically disciplining non-OPEC supply,” Goldman Sachs’s analysts wrote.
“Prices could significantly undershoot in the short term, especially if OPEC were to strategically discourage US shale growth more forcefully, or if a recession were to reduce oil demand,” the bank’s analysts noted, referring to a scenario in which Brent could trade lower than its price forecast.
Morgan Stanley has also recently revised its oil price forecasts downward, reflecting expectations of increased supply from OPEC and non-OPEC producers amid signs of weakening global demand. The bank now anticipates that while the crude oil market will remain tight through the third quarter, it will begin to stabilize in the fourth quarter and potentially move into a surplus by 2025.
Morgan Stanley has cut its forecast for the fourth quarter to $80 per barrel, down from $85, and now expects prices to gradually decline to $75 per barrel by the end of 2025, slightly lower than their previous estimate of $76.
By Charles Kennedy for Oilprice.com
More Top Reads From Oilprice.com
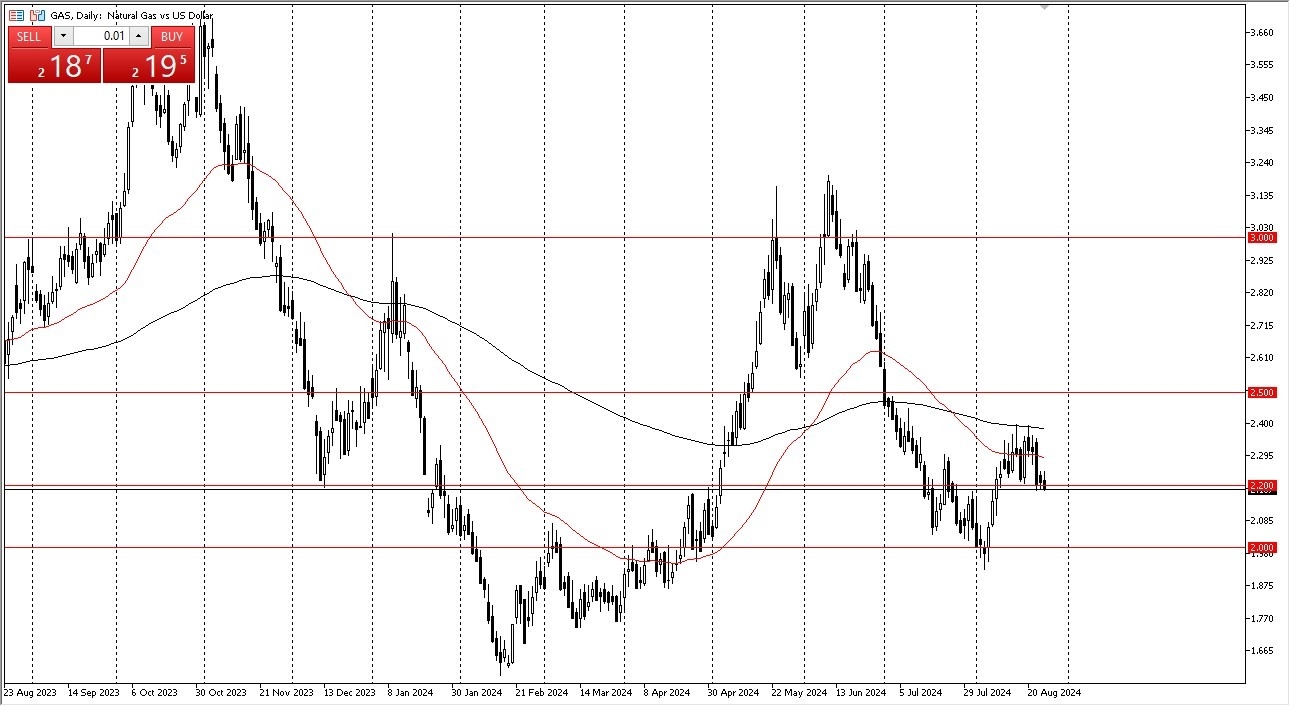
All things being equal, the market were to continue breaking down from here, it could very easily drop to the $2.00 level, which is a large, round, psychologically significant figure, and therefore I think it would make a lot of sense for us to test that area. The $2.00 level is an area that I think will continue to be crucial, as we had bounce from there and of course it is a large, round, psychologically significant figure, and an area where think you would see a lot of options barriers, and of course a lot of traders willing to “step in and pick up value.”

Cyclical trade at this point in time is obvious, and therefore I think a lot of people have to pay close attention to it. The market is likely to continue to see a lot of volatility, but I think at this point in time it’s also worth paying close attention to the idea that we are in the slowest part of the year as far as demand is concerned. That being said, as we get later in the year, it’s likely that natural gas will rally again, as we have seen time and time again. After all, as temperatures drop in the northeastern part of the United States, that does drive up the price and demand of natural gas in general. All things being equal, this is a market that I think is still in the process of bottoming out in trying to find enough support to turn things around.
Ready to trade daily Forex forecast? Here’s a list of some of the best commodities brokers to check out.
(MENAFN– Daily Forex)
In my daily analysis of the natural gas markets, the first thing I notice is that this asset is struggling overall, as every time we have rallied over the last couple of weeks, we’ve seen the Natural gas markets fall.
In fact, when you look at the weekly chart, the past 2 weeks have seen shooting stars form, and I think that does suggest that it is probably only a matter of time before we drop.
All things being equal, the market were to continue breaking down from here, it could very easily drop to the $2.00 level, which is a large, round, psychologically significant figure, and therefore I think it would make a lot of sense for us to test that area. The $2.00 level is an area that I think will continue to be crucial, as we had bounce from there and of course it is a large, round, psychologically significant figure, and an area where think you would see a lot of options barriers, and of course a lot of traders willing to“step in and pick up value.”Cyclical TradeTop Forex Brokers1 Get Started 74% of retail CFD accounts lose money Cyclical trade at this point in time is obvious, and therefore I think a lot of people have to pay close attention to it. The market is likely to continue to see a lot of volatility, but I think at this point in time it’s also worth paying close attention to the idea that we are in the slowest part of the year as far as demand is concerned. That being said, as we get later in the year, it’s likely that natural gas will rally again, as we have seen time and time again. After all, as temperatures drop in the northeastern part of the United States, that does drive up the price and demand of natural gas in general. All things being equal, this is a market that I think is still in the process of bottoming out in trying to find enough support to turn things around.Ready to trade daily Forex forecast? Here’s a list of some of the best commodities brokers to check out.MENAFN27082024000131011023ID1108604642

Gold price has entered a phase of upside consolidation above $2,500, as buyers await fresh catalysts for a fresh leg higher. The focus now shifts to the mid-tier US housing and sentiment data, as the Middle East tensions seem to ease.
Gold price retreats in Asian trading on Tuesday, having faced rejection once again near the $2,530 level. Fears over a broader Middle East conflict seem to have eased, which is weighing on the traditional safe-haven Gold price even though the US Dollar has stalled its overnight recovery alongside the US Treasury bond yields.
US Air Force General C.Q. Brown, chairman of the Joint Chiefs of Staff, said early Tuesday that fears of a near-term broader Middle East conflict have ebbed after Israel and Lebanon’s Hezbollah exchanged fire without further escalation.
These comments came after Israel launched a preemptive airstrike on Hezbollah in southern Lebanon on Sunday, as Hezbollah was said to launch a large-scale missile and rocket attack on northern and central Israel with the intended target being Mossad, the Israeli spy agency.
Meanwhile, traders snap their short-covering spree in the US Dollar, triggered by a strong headline US Durable Goods Orders print for July, which jumped by 9.9% against a rise of 4.0% expected. Encouraging US data tempered expectations that the US Federal Reserve (Fed) could lower interest rates by 50 basis points (bps) in September, thus helping the US Dollar stage a comeback from yearly troughs.
Markets are currently pricing in a 28% probability of a 50 bps rate reduction in September while the odds of a 25 bps cut jump to 72%, the CME Group’s FedWatch Tool showed on Tuesday.
The next direction in Gold price appears north, as it remains underpinned by the increased Fed rate-cut bets and looming Mid-East geopolitical risks. Further, hopes of improvement in physical Gold demand from India and China are likely to keep any downside limited in Gold price.
Sachin Jain, CEO of the World Gold Council’s (WGC) Indian operations said that “the primary beneficiaries of the reduced duty cut will be retail consumers.” Demand during the upcoming festival season will be very strong, Jain told Reuters on the sidelines of the India Gold Conference.
“Gold demand in China is expected to improve in coming months as consumers adjust to higher prices, industry officials said, with economic uncertainty and concerns about currency weakness driving investment flows,” according to Reuters.
Looking ahead, Gold traders will take cues from the upcoming US CB Consumer Confidence and housing data while speeches from Fed policymakers will be also scrutinized for fresh policy hints.
The short-term technical outlook for Gold price remains more or less the same, with the upside risks intact so long as buyers defend the triangle resistance-turned-support at $2,468.
The 21-day Simple Moving Average (SMA) closes in on that level, making it a strong support.
It’s worth mentioning that Gold price consolidates its upside break from a symmetrical triangle confirmed a couple of weeks ago.
Meanwhile, the 14-day Relative Strength Index (RSI) turns lower but holds comfortably above 50, currently near 61, justifying the bullish outlook.
Gold buyers need to recapture the record high of $2,532 to take on the next key barrier at the $2,550 level.
Acceptance above the latter could challenge the $2,600 round level en route to the triangle target, measured at $2,660.
On the flip side, the initial demand area is seen at the $2,500 threshold for Gold buyers, below which Friday’s low of $2,485 will be challenged.
A sustained breach of the latter could expose the downside toward the abovementioned triangle resistance-turned-support at $2,468.
Gold has played a key role in human’s history as it has been widely used as a store of value and medium of exchange. Currently, apart from its shine and usage for jewelry, the precious metal is widely seen as a safe-haven asset, meaning that it is considered a good investment during turbulent times. Gold is also widely seen as a hedge against inflation and against depreciating currencies as it doesn’t rely on any specific issuer or government.
Central banks are the biggest Gold holders. In their aim to support their currencies in turbulent times, central banks tend to diversify their reserves and buy Gold to improve the perceived strength of the economy and the currency. High Gold reserves can be a source of trust for a country’s solvency. Central banks added 1,136 tonnes of Gold worth around $70 billion to their reserves in 2022, according to data from the World Gold Council. This is the highest yearly purchase since records began. Central banks from emerging economies such as China, India and Turkey are quickly increasing their Gold reserves.
Gold has an inverse correlation with the US Dollar and US Treasuries, which are both major reserve and safe-haven assets. When the Dollar depreciates, Gold tends to rise, enabling investors and central banks to diversify their assets in turbulent times. Gold is also inversely correlated with risk assets. A rally in the stock market tends to weaken Gold price, while sell-offs in riskier markets tend to favor the precious metal.
The price can move due to a wide range of factors. Geopolitical instability or fears of a deep recession can quickly make Gold price escalate due to its safe-haven status. As a yield-less asset, Gold tends to rise with lower interest rates, while higher cost of money usually weighs down on the yellow metal. Still, most moves depend on how the US Dollar (USD) behaves as the asset is priced in dollars (XAU/USD). A strong Dollar tends to keep the price of Gold controlled, whereas a weaker Dollar is likely to push Gold prices up.
Spot Gold retains its bullish bias at the beginning of the week, extending Friday’s gains towards the record high posted last week at $2,531.60. The US Dollar trades mixed across the FX board but was overall weak after Federal Reserve (Fed) Chairman Jerome Powell said that the time has come for monetary policy to adjust, speaking at the Jackson Hole Symposium. Once again, Powell conditioned an interest rate cut to incoming data, but market participants are confident the Fed will deliver a rate cut in the upcoming September meeting.
Other than that, the United States (US) released Durable Goods Orders on Monday, which unexpectedly rose by 9.9% in July, much better than the previous 6.9% or the 4% anticipated. Also, the Dallas Fed Manufacturing Index improved in August to -9.7 from the previous -17.5.
In the meantime, action across financial boards remains limited ahead of critical US data. The country will release next Friday the July Personal Consumption Expenditures (PCE) Price Index, the Fed’s favorite inflation gauge. At the time being, the annual increase is foreseen at 2.5%, matching the June reading, while monthly inflation is expected at 0.2%, slighly higher than the previous 0.1%.
The daily chart for XAU/USD shows the bright metal hovers around Friday’s high and aims to extend gains. Technical indicators have partially lost their upward strength but hold well above their midlines, far from suggesting bullish exhaustion. At the same time, Gold stands above all its moving averages, with the 20 Simple Moving Average (SMA) heading firmly north at around $2,458.75.
For the near term, technical readings in the 4-hour chart suggest a corrective decline may develop in the next few sessions. Technical indicators have retreated from their recent lows and head firmly lower, although within positive levels. At the same time, the 20 SMA remains directionless, just below the intraday low, while the 100 and 200 SMAs maintain their bullish slopes below the shorter one, limiting the case for a steeper decline.
Support levels: 2,508.80 2,496.40 2,485.10
Resistance levels: 2,523.50 2,531.60 2,542.00
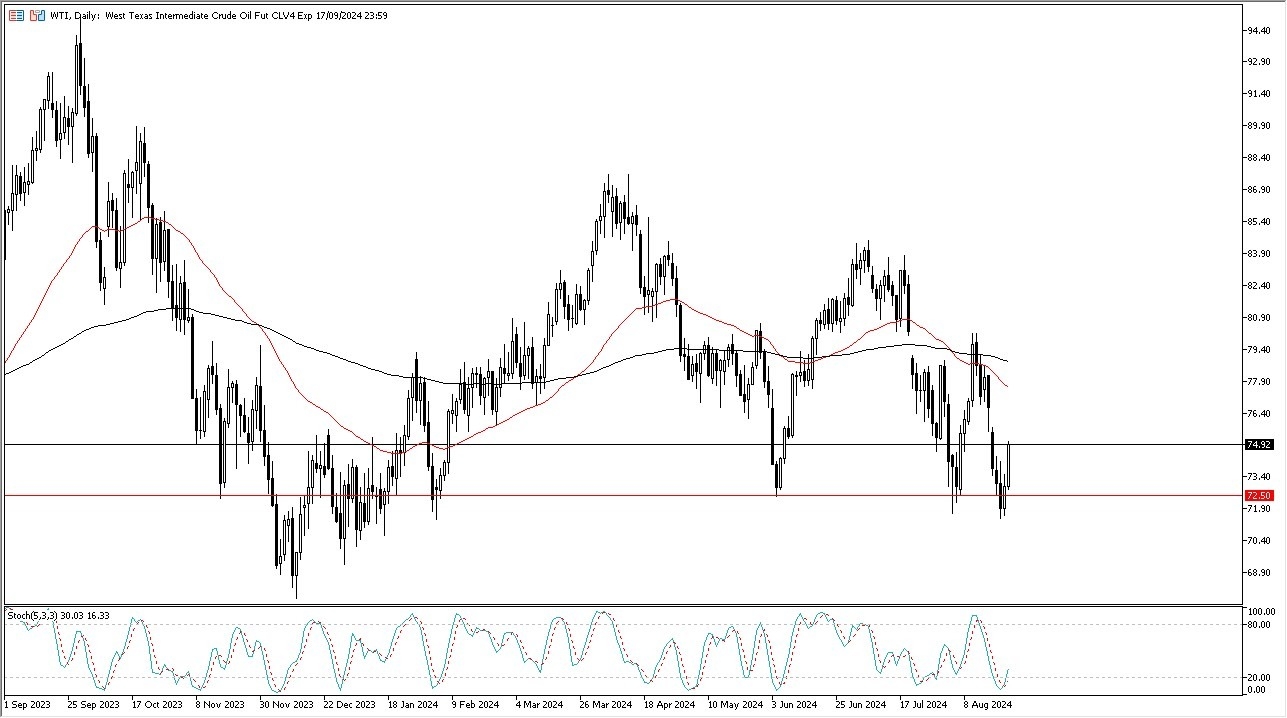
With that, I think short-term pullbacks continue to be buying opportunities. It’s likely that the West Texas intermediate crude oil market goes looking to the $79.50 level. That’s basically where the 200 day EMA is hanging around. And therefore, I think you’ve got a situation where a lot of technical traders will be paying attention.
The market is also going to have to deal with the fact that the overall demand picture is still a question as we have to wonder whether or not the markets are going to see enough demand. Is the economy slowing down? If it is, then we could get a situation where traders will look at this through the prism of perhaps a market that will maybe go sideways going forward or potentially break down, but it’s really not until we break down below the $69 level that I would be concerned.
In general, I do think that eventually we try to sort things out, but right now it just looks like more chaos, which is all we’ve had in the markets as of late. I don’t see the oil market being any different than the other noisy markets that we have seen, and with this I am cautious about being “too big” in this market, as there are a lot of factors that will come into play when it comes to pricing the oil market
Want to trade the oil markets? Get our most recommended Forex brokers for oil trading here.
Gold price (XAU/USD) holds positive near $2,515 an ounce during the early Asian session on Monday amid the weaker US Dollar (USD) and dovish comments from the Federal Reserve (Fed). The uptick of the yellow metal is bolstered by the speech by Fed Chair Jerome Powell, signalling that time has come for interest rate cuts starting this September.
Fed Chair Jerome Powell delivered the dovish message at the Kansas City Fed’s annual economic symposium in Jackson Hole on Friday, which has weighed on the USD broadly. Fed’s Powell said that “the time has come” for the central bank to begin lowering interest rates. Powell acknowledged recent softness in the labor market in his speech and stated that the Fed did not “seek or welcome further cooling in labor market conditions.”
Financial markets have fully priced in a 25 basis points (bps) rate cut, while the chance for a deeper cut stands at 36.5%, up from 24% last week, according to the CME FedWatch Tool. The growing expectations of easing monetary policy by the Fed might further support the precious metal as it makes gold more attractive for other currency holders.
Furthermore, Hezbollah launched hundreds of rockets and drones at Israel early on Sunday, as Israel’s military said it carried out a wave of pre-emptive strikes across southern Lebanon to thwart a large-scale rocket and drone attack by Hezbollah, per Reuters. The ongoing geopolitical tensions in the Middle East might boost the safe-haven asset demand, benefiting the Gold price.
Gold has played a key role in human’s history as it has been widely used as a store of value and medium of exchange. Currently, apart from its shine and usage for jewelry, the precious metal is widely seen as a safe-haven asset, meaning that it is considered a good investment during turbulent times. Gold is also widely seen as a hedge against inflation and against depreciating currencies as it doesn’t rely on any specific issuer or government.
Central banks are the biggest Gold holders. In their aim to support their currencies in turbulent times, central banks tend to diversify their reserves and buy Gold to improve the perceived strength of the economy and the currency. High Gold reserves can be a source of trust for a country’s solvency. Central banks added 1,136 tonnes of Gold worth around $70 billion to their reserves in 2022, according to data from the World Gold Council. This is the highest yearly purchase since records began. Central banks from emerging economies such as China, India and Turkey are quickly increasing their Gold reserves.
Gold has an inverse correlation with the US Dollar and US Treasuries, which are both major reserve and safe-haven assets. When the Dollar depreciates, Gold tends to rise, enabling investors and central banks to diversify their assets in turbulent times. Gold is also inversely correlated with risk assets. A rally in the stock market tends to weaken Gold price, while sell-offs in riskier markets tend to favor the precious metal.
The price can move due to a wide range of factors. Geopolitical instability or fears of a deep recession can quickly make Gold price escalate due to its safe-haven status. As a yield-less asset, Gold tends to rise with lower interest rates, while higher cost of money usually weighs down on the yellow metal. Still, most moves depend on how the US Dollar (USD) behaves as the asset is priced in dollars (XAU/USD). A strong Dollar tends to keep the price of Gold controlled, whereas a weaker Dollar is likely to push Gold prices up.
Defense Secretary Lloyd Austin ordered a carrier strike group, including F-35 warplanes, to accelerate its deployment to the region. Austin also ordered a guided-missile submarine to the Middle East.
Israel has put its military on high alert, a person familiar with the matter told The Wall Street Journal.
Here are Monday’s closing energy prices:
Israel has been preparing for strikes by Iran and the Hezbollah militia for nearly two weeks, after the assassination of a Hamas leader in Tehran. Israeli intelligence has assessed Iran is likely to respond directly to the killing within days, two sources with direct knowledge told Axios Sunday.
“We see allocations to oil and gold as the main means to add some protection to portfolios against a further escalation in geopolitical tensions,” UBS analysts told clients in a Monday research note.
U.S. crude oil is trading higher even as OPEC lowered its global demand growth forecast by 135,000 barrels per day, citing softening consumption in China.
“The oil markets reacted strongly to the increased geopolitical risk even as OPEC has shown some concern about its demand growth,” said Phil Flynn, senior market analyst at the Price Futures Group, though he said the market is still on track for a deficit as inventories fall.
U.S. crude oil finished last week more than 4% higher, snapping a 4-week decline, as the stock market recovered most of its losses from a flash sell-off caused by mounting fear of a recession and after the Bank of Japan lifted interest rates a fraction.
Silver price (XAG/USD) retraces its recent gains, trading around $30.90 per troy ounce during the European hours on Wednesday. The grey metal faces challenges due to a slowing Chinese economy, the world’s largest manufacturing hub. China’s industrial demand for Silver is significant, as it is essential in various applications such as electronics, solar panels, and automotive components.
China’s Gross Domestic Product (GDP) grew 4.7% year-over-year in the second quarter, compared to a 5.3% expansion in the first quarter and an expected 5.1%. This marks the slowest growth since the first quarter of 2023.
The third plenum of the Chinese Communist Party’s 20th National Congress, held from July 15 to 18, has so far indicated no major changes in the economic strategy of top consumer China. President Xi Jinping urged the Communist Party to maintain “unwavering faith and commitment” to its strategic agenda.
Standard Chartered anticipates that the People’s Bank of China (PBoC) will implement cuts in both interest rates and the reserve requirement ratio (RRR) as GDP growth decelerates in the second quarter. China’s growth drivers remain uneven, and trade tensions are escalating, with the US and EU imposing new tariffs on Chinese electric vehicles (EVs).
Additionally, Silver prices struggle due to the emergence of the hawkish sentiment surrounding the Federal Reserve (Fed) policy stance after the speech from Federal Reserve (Fed) Board of Governors member Dr. Adriana Kugler on Tuesday. Dr. Kugler indicated that if upcoming data does not confirm that inflation is moving toward the 2% target, it may be appropriate to maintain current rates for a while longer.
Silver is a precious metal highly traded among investors. It has been historically used as a store of value and a medium of exchange. Although less popular than Gold, traders may turn to Silver to diversify their investment portfolio, for its intrinsic value or as a potential hedge during high-inflation periods. Investors can buy physical Silver, in coins or in bars, or trade it through vehicles such as Exchange Traded Funds, which track its price on international markets.
Silver prices can move due to a wide range of factors. Geopolitical instability or fears of a deep recession can make Silver price escalate due to its safe-haven status, although to a lesser extent than Gold’s. As a yieldless asset, Silver tends to rise with lower interest rates. Its moves also depend on how the US Dollar (USD) behaves as the asset is priced in dollars (XAG/USD). A strong Dollar tends to keep the price of Silver at bay, whereas a weaker Dollar is likely to propel prices up. Other factors such as investment demand, mining supply – Silver is much more abundant than Gold – and recycling rates can also affect prices.
Silver is widely used in industry, particularly in sectors such as electronics or solar energy, as it has one of the highest electric conductivity of all metals – more than Copper and Gold. A surge in demand can increase prices, while a decline tends to lower them. Dynamics in the US, Chinese and Indian economies can also contribute to price swings: for the US and particularly China, their big industrial sectors use Silver in various processes; in India, consumers’ demand for the precious metal for jewellery also plays a key role in setting prices.
Silver prices tend to follow Gold’s moves. When Gold prices rise, Silver typically follows suit, as their status as safe-haven assets is similar. The Gold/Silver ratio, which shows the number of ounces of Silver needed to equal the value of one ounce of Gold, may help to determine the relative valuation between both metals. Some investors may consider a high ratio as an indicator that Silver is undervalued, or Gold is overvalued. On the contrary, a low ratio might suggest that Gold is undervalued relative to Silver.
Morgan Stanley has revised its oil price forecasts downward, reflecting expectations of increased supply from OPEC and non-OPEC producers amid signs of weakening global demand, the bank said in a report this week. The firm now anticipates that while the crude oil market will remain tight through the third quarter, it will begin to stabilize in the fourth quarter and potentially move into a surplus by 2025.
The adjustment comes as Morgan Stanley lowers its global oil demand growth estimate to 1.1 million barrels per day (bpd) for 2024, down slightly from its previous forecast of 1.2 million bpd. This revision is driven by multiple factors, including a slowdown in production growth from key non-OPEC countries such as the U.S. and Brazil. However, despite the downward revision in demand, the firm notes that these adjustments have actually marginally tightened the overall supply-demand balance for the remainder of the year.
Morgan Stanley had expected Brent crude prices to remain in the mid-$80s per barrel throughout the third quarter of 2024. However, recent market dynamics suggest that traders are already pricing in anticipated supply increases and demand softness expected in 2025. Consequently, the firm has cut its Brent price forecast for the fourth quarter to $80 per barrel, down from $85, and now expects prices to gradually decline to $75 per barrel by the end of 2025, slightly lower than their previous estimate of $76.
China’s economic slowdown has been a significant factor in this revised demand outlook. Morgan Stanley highlights several contributing elements, such as a surge in sales of LNG-powered trucks, which are displacing traditional diesel fuel, alongside the growing adoption of electric vehicles. Additionally, the firm points to slower growth in demand for petrochemical feedstocks as another reason for the lower demand growth estimate.
While current spot market conditions remain tight, Morgan Stanley’s analysis indicates that oil market participants are increasingly looking ahead to the anticipated softening in the latter part of 2024 and beyond. This shift in market sentiment underscores the cautious approach being taken by investors and industry stakeholders, who are preparing for a potential rebalancing of supply and demand dynamics in the coming years.
In summary, Morgan Stanley’s latest outlook suggests that while the immediate future may still see some tightness in the oil market, the longer-term trajectory points towards a more balanced market with potential price declines as supply increases and demand growth continues to slow.
By Julianne Geiger for Oilprice.com
More Top Reads From Oilprice.com