The main tag of Gold Today Price Articles.
You can use the search box below to find what you need.
[wd_asp id=1]
The main tag of Gold Today Price Articles.
You can use the search box below to find what you need.
[wd_asp id=1]
Microsoft has been publicly traded for almost 40 years. Its stock has risen consistently, reaching a $1 trillion market cap in 2019. Today, the tech giant has a market cap of more than $3 trillion.
Here’s what you need to know about MSFT stock.
Microsoft is one of the original tech giants. Its stock has had decades to weather various storms.
Take the turn of the 21st century, for example. On a split-adjusted basis, MSFT climbed as high as $59.97 in December 1999 during the dot-com bubble. But it dropped as low as $14.87 in 2009 during the Great Recession. It took the stock nearly 17 years to return to its dot-com bubble highs in October 2016.
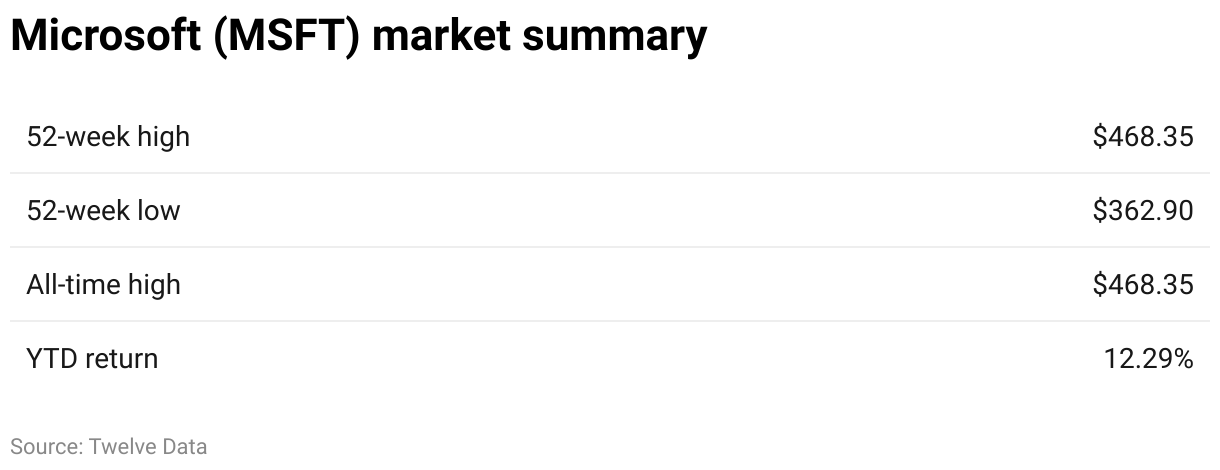
Since then, it has been on a tear. Shares reached nearly $350 in late 2021. The 2022 tech sector sell-off dropped the stock price to under $215. It rallied in 2023, hitting above $384 per share in November. The climb continued in 2024, with MSFT reaching a split-adjusted high of $446.50 on June 17, 2024.
The average target among 58 Wall Street analysts covering MSFT is $485.82.
MSFT has performed very well since its 1986 initial public offering.
Over the past 20 years ending June 13, Microsoft shares have generated returns of more than 1,400%.
Microsoft has increased its earnings over time. For fiscal 2023, revenue was $211.9 billion, up 7% from the previous year. Net income was $73.3 billion, a 6% increase. Gross margin increased $10.4 billion, or roughly 8%.
Research and development costs also increased by over $2.6 billion. Operating expenses increased by $5.3 billion, or 10%. Microsoft cited factors such as employee severance packages, acquisitions, investments in cloud engineering and LinkedIn.
Microsoft maintains a consistent net profit, with margins above 35% in the past four quarters. After seeing a decline in its cash and cash equivalents in 2021 and 2022, those figures increased in 2023.
In its early days, Microsoft focused on developing an operating system for IBM. The system, MS-DOS, was released in 1981 with IBM’s first personal computer. By the early 1990s, Microsoft had sold over 100 million copies of MS-DOS. It released its groundbreaking Windows operating system in 1985. But Windows didn’t gain traction until the 1990s.
Over the next 20 years, the company focused on shifting its business to a subscription model. It invested in its cloud services segment and expanded its presence in the gaming market.
Microsoft acquired the video collaboration application Skype in 2011. In 2016, it added LinkedIn to its portfolio. In 2020, the company bought game developer and publisher ZeniMax. It acquired cloud and artificial intelligence software company Nuance Communications the following year. In 2022, it bought Activision Blizzard, maker of “Call of Duty” and “World of Warcraft.”
The tech giant made a big splash in the AI world in 2019 when it invested $1 billion in ChatGPT maker OpenAI. That same year, it secured a deal with OpenAI to build Azure AI technologies. Microsoft announced another $10 billion investment in OpenAI in January 2023. About a month later, it integrated OpenAI technology into its Bing search engine.
Microsoft has been the subject of several controversies. In the late 1990s, the Department of Justice brought an antitrust lawsuit against the company. It alleged that Microsoft held monopoly power, citing its dominant PC market share and a high barrier to entry. As a result, customers lacked viable alternatives to Windows. The two parties later reached a settlement that restricted Microsoft’s conduct.
Microsoft has been criticized for its labor practices. In 2000, it paid $97 million to settle a lawsuit brought by temporary workers denied benefits.
The tech giant has also been accused of using its complex corporate structure to avoid paying taxes.
Microsoft is the subject of the largest audit in IRS history. The agency says the company owes $28.9 billion in back taxes, plus penalties and interest. Microsoft disputes that figure.
With an initial public offering in 1986, MSFT was priced at $21 per share. The company netted a valuation of $777 million. Before the close of the first trading day, shares reached $35.50. About 2.5 million shares were sold that day, raising $61 million.
During the IPO, co-founder Bill Gates, then 30 years old, sold $1.6 million in shares. He retained a 45% stake worth $350 million.
Purchasing MSFT during its IPO was one of the best investments of the 1990s. At the height of the dot-com bubble in 2000, its market cap reached nearly $600 billion.
The company’s most recent stock split was a 2-for-1 split in February 2003. The stock has split nine times. Today, a single share of Microsoft’s IPO stock represents 288 shares.
Microsoft is well positioned to continue outperforming. But it faces several potential stumbling blocks.
Public cloud computing is one of the largest growth markets in the tech world. Microsoft’s Azure is a leading provider in that market. The Microsoft 365 productivity software suite creates upselling opportunities and tremendous cash flow. This can help the company invest in Azure and other growth initiatives. A ChatGPT service is now on the market as ChatGPT Azure OpenAI Service. Microsoft’s relationship with OpenAI could give it a first-mover advantage in AI technology.
Unfortunately, Microsoft Office is a mature product and likely has limited growth opportunities. The company also faces competition for cloud services from other tech companies, such as Amazon.com (AMZN) and Alphabet (GOOG).
Developing AI technology is expensive. But Microsoft risks falling behind Google’s Gemini and other AI leaders if it doesn’t stay on the cutting edge of development.
MSFT is one of the top stocks in the Nasdaq composite index, with a weight of 11.78% as of March 28, 2024.
The table below orders the 10 stocks with the greatest weighting in the Nasdaq by market cap. It’s reordered daily at market close.
Analysts are generally optimistic about Microsoft’s business and stock price in 2024. The analysts covering MSFT project full-year adjusted earnings per share of $11.80 in fiscal 2024.
Microsoft’s fiscal 2024 already looks rosy. The company reported 20% net income growth in its fiscal third quarter. Revenue was $61.9 billion, increasing by 17%.
Microsoft’s revenue is expected to grow in 2025, with an average estimated $280.03 billion. That represents about a 14.3% increase from the 2024 estimate. Earnings are also expected to grow, with an estimated $13.27 per share in 2025.
AI technology is the biggest wild card for Microsoft investors in the next several years. The company is off to a strong start with its initial wave of AI product launches and investment in OpenAI.
Investors should monitor how the company integrates Activision Blizzard into its gaming business and its long-term strategy for the gaming segment.
The provided chart illustrates WTI crude’s bullish trend since June. The price has broken through several key resistance levels, including the $80.22 mark. The current price of $83.16 is approaching the next significant resistance at $86.24. A breakthrough could potentially push prices towards the $92.02 level, which represents a major resistance point from September-October 2023.
This week’s primary price driver was a significant reduction in U.S. crude inventories. Weekly data showed a 12.2 million barrel decrease in crude stocks and a 2.2 million barrel drop in gasoline inventories. The American Petroleum Institute reported an even larger weekly crude inventory draw of 9.163 million barrels, surpassing analysts’ expectations.
The American Automobile Association’s forecast of a 5.2% increase in Independence Day travel compared to last year supports the bullish sentiment for this week’s gasoline demand. This aligns with analysts’ predictions of a tighter market in the coming weeks as summer fuel consumption rises.
This week saw Middle East tensions reintroduce a geopolitical risk premium to oil prices. Meanwhile, OPEC+ continues to support prices through production cuts, despite slight output increases from Nigeria and Iran in June.
Recent weeks have witnessed hedge funds and money managers increasing their petroleum purchases, moving from bearishness to a more neutral stance. This shift provided additional support to this week’s prices.
Looking ahead, UBS projects global oil demand growth of 1.5 million barrels per day this year. Both UBS and JPMorgan have set Brent crude price targets at $90 per barrel in the coming months, with UBS expecting this level to be reached this quarter.
I do get asked short term analysis all the time about natural gas, but the reality is, unless you know transmission, uh, rates in the United States through the lines, weather patterns in the Northeastern United States and a whole litany of geopolitical issues, you really don’t have much of a chance trying to figure out what the next day or two is going to be.
Granted, we could bounce to the $2.50 level and that would not surprise me at all. But I also think that could offer a little bit of resistance. Either way, this is a market that I think you need to build up a position. This is a swing trader’s market, not a scalper’s market.
For a look at all of today’s economic events, check out our economic calendar.
Natural Gas (NG) is trading at $2.354, down 1.26%. On the 2-hour chart, the pivot point is $2.39. Immediate resistance levels are $2.44, $2.47, and $2.51, while support levels are $2.34, $2.31, and $2.27.
Technical indicators show the 50 EMA at $2.46 and the 200 EMA at $2.64, indicating a bearish trend below $2.39. A break above this level could shift the bias to bullish.
Asia Pacific specialty coffee market will grow by 14.7% annually with a total addressable market cap of $266.39 billion over 2024-2033. The growth is driven by rising disposable income and urbanization, growing demand for on-the-go coffee, strengthening premium coffee shops, and rising preferences for specialty coffee and green coffee.
Read the Market Summary Here:-https://reportocean.com/industry-verticals/sample-request?report_id=GMD1871
Highlighted with 48 tables and 57 figures, this 127-page report ?Asia Pacific Specialty Coffee Market 2023-2033 by Grade (80-84.99, 85-89.99, 90-100), Product Type, Application (Home, Commercial), Consumer Age, Roast (Regular, Artisanal), Distribution Channel, and Country: Trend Forecast and Growth Opportunity? is based on comprehensive research of the entire Asia Pacific specialty coffee market and all its sub-segments through extensively detailed classifications. Profound analysis and assessment are generated from premium primary and secondary information sources with inputs derived from industry professionals across the value chain. The report is based on studies on 2021-2023 and provides forecast from 2024 till 2033 with 2023 as the base year. (Please note: The report will be updated before delivery so that the latest historical year is the base year, and the forecast covers at least 5 years over the base year.)
In-depth qualitative analyses include identification and investigation of the following aspects:
? Market Structure
? Growth Drivers
? Restraints and Challenges
? Emerging Product Trends & Market Opportunities
? Porter?s Fiver Forces
For an in-depth analysis, you can refer sample copy of the report @-https://reportocean.com/industry-verticals/sample-request?report_id=GMD1871
The trend and outlook of Asia Pacific market is forecast in optimistic, balanced, and conservative view by taking into account of COVID-19 and Russia-Ukraine conflict. The balanced (most likely) projection is used to quantify Asia Pacific specialty coffee market in every aspect of the classification from perspectives of Grade, Product Type, Application, Consumer Age, Roast, Distribution Channel, and Country.
Based on Grade, the Asia Pacific market is segmented into the following sub-markets with annual revenue ($ mn) for 2023-2033 included in each section.
? Coffee with 80-84.99 Points
? Coffee with 85-89.99 Points
? Coffee with 90-100 Points
Based on Product Type, the Asia Pacific market is segmented into the following sub-markets with annual revenue ($ mn) for 2023-2033 included in each section.
? Instant Coffee
? Ground Coffee
? Whole Beans
? Single-Cup
? Other Products
By Application, the Asia Pacific market is segmented into the following sub-markets with annual revenue ($ mn) for 2023-2033 included in each section.
? Home Use
? Commercial Use
Get a Free Sample PDF copy of the report @-https://reportocean.com/industry-verticals/sample-request?report_id=GMD1871
By Consumer Age, the Asia Pacific market is segmented into the following sub-markets with annual revenue ($ mn) for 2023-2033 included in each section.
? 18-24-Year-Old Consumers
? 25-34-Year-Old Consumers
? 35-44-Year-Old Consumers
? 45-54-Year-Old Consumers
? >55-Year-Old Consumers
By Roast, the Asia Pacific market is segmented into the following sub-markets with annual revenue ($ mn) for 2023-2033 included in each section.
? Regular Roast
? Artisanal Roast
By Distribution Channel, the Asia Pacific market is segmented into the following sub-markets with annual revenue ($ mn) for 2023-2033 included in each section.
? Food Service
? Specialty Stores
? Supermarkets and Hypermarkets
? Online Stores
? Retail and Grocery Stores
Get an Exclusive Sample Copy of the Report at:-https://reportocean.com/industry-verticals/sample-request?report_id=GMD1871
Geographically, the following national/local markets are fully investigated:
? Japan
? China
? South Korea
? Australia
? India
? Rest of APAC (further segmented into Malaysia, Singapore, Indonesia, Thailand, New Zealand, Vietnam, Taiwan, and Philippines)
For each key country, detailed analysis and data for annual revenue ($ mn) are available for 2023-2033. The breakdown of national markets by Grade, Application, and Distribution Channel over the forecast years are also included.
The report also covers the current competitive scenario and the predicted trend; and profiles key vendors including market leaders and important emerging players.
Selected Key Players:
Blue Bottle
Bulletproof
Caff? Nero Group Ltd.
Caribou Coffee Company
Costa Coffee
Don Francisco?s Coffee
Dunkin’ Donuts LLC
Download Sample Report, SPECIAL OFFER (Avail an Up-to 30% discount on this report) @-https://reportocean.com/industry-verticals/sample-request?report_id=GMD1871
Eight O?Clock Coffee
JAB Holding Company
Luigi Lavazza S.p.A.
Starbucks Corporation
Strauss Group Ltd.
Reasons to buy this report –
Analyze market outlook with recent trends and SWOT analysis.
Dynamic market scenario along with market growth opportunities for the coming years.
Market segmentation analysis, including qualitative and quantitative research incorporating the impact of economic and non-economic aspects.
Regional and national analyzes integrating supply and demand forces that are influencing market growth.
Market value (millions of dollars) and volume (millions of units) data for each segment and sub-segment
Competitive scenario involving the market share of the main players, along with the new projects and strategies adopted by the players in recent years.
Access Full Report Description, TOC, Table of Figure, Chart, etc.-https://reportocean.com/industry-verticals/sample-request?report_id=GMD1871
About Report Ocean:
Report Ocean is a renowned provider of market research reports, offering high-quality insights to clients in various industries. Their goal is to assist clients in achieving their top line and bottom line objectives, thereby enhancing their market share in today’s competitive environment. As a trusted source for innovative market research reports, Report Ocean serves as a comprehensive solution for individuals, organizations, and industries seeking valuable market intelligence.
Contact Information:
Email:[email protected]
Address: 500 N Michigan Ave, Suite 600, Chicago, Illinois 60611, United States
Telephone: +1 888 212 3539 (US – Toll-Free)
For more information and to explore their offerings, visit their website at:https://www.reportocean.com/
Gold showed no signs of life on Thursday, trading just below the $2,360 mark. A holiday in the United States (US) exacerbated the quietness in the second half of the day, leaving the bright metal consolidating weekly gains.
The US Dollar turned south after Federal Reserve (Fed) Chairman Jerome Powell cooled down his words on inflation. Despite maintaining a cautious tone, Powell said that the disinflationary trend seems to be resuming in an event organized by the European Central Bank (ECB) in Sintra. His words put pressure on the Greenback ahead of key US employment-related data.
The Bureau of Labor Statistics (BLS) will release the Nonfarm Payrolls (NFP) report on Friday, and market participants expect the US economy to have added 190K new positions in June, below the 272K gained in May. The Unemployment Rate is expected to remain steady at 4%, while Average Hourly Earnings are foreseen to be up 3.9% YoY, easing from the previous 4.1%. The figures, if confirmed, may fuel speculation of a September rate cut and push the US Dollar further south across the FX board.
Technically, the daily chart shows XAU/USD has remained confined to a tight range near its weekly high of $2,364.83, losing momentum but with the risk still skewed to the upside. The pair is developing above a flat 20 Simple Moving Average (SMA) while the 100 and 200 SMAs keep advancing below it. Technical indicators, in the meantime, remain within positive levels, although without directional strength.
In the near term, and according to the 4-hour chart, chances are of another leg north. XAU/USD develops above all its moving averages, with the 20 SMA maintaining an upward slope after crossing above the 100 and 200 SMAs. Finally, technical indicators have turned flat but hold near overbought readings without signs of upward exhaustion.
Support levels: 2,341.50 2,329.20 2,313.60
Resistance levels: 2,368.60, 2,387.60 2,400.00
Certainly, an argument can be made that the selling is overdone and that a bounce is overdue. However, as it looks now, the week may end with a fourth consecutive weekly wide range red candle with a close near the low of the week’s trading range. This shows sellers dominating to the end of the session and therefore they may continue to do so heading into next week.
There is still time for that to change, but not much, especially given the lower activity levels due to the Independence Day holiday in the United States. If this scenario is correct, then the price of natural gas remains at risk of testing the next lower target zone before a notable bounce.
Nonetheless, the retracement low of 2.335 completed a falling ABCD pattern and is shown on the chart. Once price symmetry between the AB and CD legs of the pattern match, or are close to each other, a potential pivot level has been identified. That could lead to a reversal as either support or resistance shows up, depending on the direction of the pattern. Or a breakout through the price area and a continuation of the trend triggers instead.
For natural gas, the current retracement low completed the initial target for the ABCD pattern. Also, a 50% trend retracement was completed during the decline at 2.37. Together, the two price levels can be watched as a support zone. So far, that is the case but there is little indication that the support zone can do more than slow the descent. Natural gas fell below the 200-Day MA two days ago and it continues to fall. This is bearish behavior.
A decisive drop below 2.335 could lead to a decline to the next lower potential support zone from around 2.23 to 2.18. The 61.8% Fibonacci retracement is at 2.18, while an extended lower target for the ABCD pattern completes at 2.20. A prior swing ow at 2.23 begins the support zone.
For a look at all of today’s economic events, check out our economic calendar.
You have reached your limit of 5 free articles for this month.
Access all our articles, insights, and analysts.
Your coupon code
Gold showed no signs of life on Thursday, trading just below the $2,360 mark. A holiday in the United States (US) exacerbated the quietness in the second half of the day, leaving the bright metal consolidating weekly gains.
The US Dollar turned south after Federal Reserve (Fed) Chairman Jerome Powell cooled down his words on inflation. Despite maintaining a cautious tone, Powell said that the disinflationary trend seems to be resuming in an event organized by the European Central Bank (ECB) in Sintra. His words put pressure on the Greenback ahead of key US employment-related data.
The Bureau of Labor Statistics (BLS) will release the Nonfarm Payrolls (NFP) report on Friday, and market participants expect the US economy to have added 190K new positions in June, below the 272K gained in May. The Unemployment Rate is expected to remain steady at 4%, while Average Hourly Earnings are foreseen to be up 3.9% YoY, easing from the previous 4.1%. The figures, if confirmed, may fuel speculation of a September rate cut and push the US Dollar further south across the FX board.
Technically, the daily chart shows XAU/USD has remained confined to a tight range near its weekly high of $2,364.83, losing momentum but with the risk still skewed to the upside. The pair is developing above a flat 20 Simple Moving Average (SMA) while the 100 and 200 SMAs keep advancing below it. Technical indicators, in the meantime, remain within positive levels, although without directional strength.
In the near term, and according to the 4-hour chart, chances are of another leg north. XAU/USD develops above all its moving averages, with the 20 SMA maintaining an upward slope after crossing above the 100 and 200 SMAs. Finally, technical indicators have turned flat but hold near overbought readings without signs of upward exhaustion.
Support levels: 2,341.50 2,329.20 2,313.60
Resistance levels: 2,368.60, 2,387.60 2,400.00
Gold showed no signs of life on Thursday, trading just below the $2,360 mark. A holiday in the United States (US) exacerbated the quietness in the second half of the day, leaving the bright metal consolidating weekly gains.
The US Dollar turned south after Federal Reserve (Fed) Chairman Jerome Powell cooled down his words on inflation. Despite maintaining a cautious tone, Powell said that the disinflationary trend seems to be resuming in an event organized by the European Central Bank (ECB) in Sintra. His words put pressure on the Greenback ahead of key US employment-related data.
The Bureau of Labor Statistics (BLS) will release the Nonfarm Payrolls (NFP) report on Friday, and market participants expect the US economy to have added 190K new positions in June, below the 272K gained in May. The Unemployment Rate is expected to remain steady at 4%, while Average Hourly Earnings are foreseen to be up 3.9% YoY, easing from the previous 4.1%. The figures, if confirmed, may fuel speculation of a September rate cut and push the US Dollar further south across the FX board.
Technically, the daily chart shows XAU/USD has remained confined to a tight range near its weekly high of $2,364.83, losing momentum but with the risk still skewed to the upside. The pair is developing above a flat 20 Simple Moving Average (SMA) while the 100 and 200 SMAs keep advancing below it. Technical indicators, in the meantime, remain within positive levels, although without directional strength.
In the near term, and according to the 4-hour chart, chances are of another leg north. XAU/USD develops above all its moving averages, with the 20 SMA maintaining an upward slope after crossing above the 100 and 200 SMAs. Finally, technical indicators have turned flat but hold near overbought readings without signs of upward exhaustion.
Support levels: 2,341.50 2,329.20 2,313.60
Resistance levels: 2,368.60, 2,387.60 2,400.00
The natural gas market has fallen again during, I would say thin holiday trading on Thursday as the Americans were away for Independence Day. That being said, we are now below the support and we have formed a large M pattern. At this point, we could send the market down to the $2 level, so be cognizant of this. I’m a buyer of this, but not here. Let it fall. Typically speaking, late in the summer, we start to pick up momentum again due to the autumn coming. $2, of course, is a large round psychologically significant figure. And as you know, I’ve been long of this market for some time.
I went ahead and pulled the ripcord today, so now I’m flat. I made some money on the ETF. Didn’t make anywhere near as much as I could, but I wanted to give it as much room as I could. At this point, the closer we get to $2, the more likely I will be to start building up an ETF position again, but ETF because it doesn’t have leverage. That way I can hang on to this for a while. I don’t care what happens day to day. It’s very stress-free.