The main tag of Gold Today Price Articles.
You can use the search box below to find what you need.
[wd_asp id=1]
The main tag of Gold Today Price Articles.
You can use the search box below to find what you need.
[wd_asp id=1]
Upcoming U.S. crude inventory data is also in focus, with expectations of a decrease in stockpiles, further influencing oil forecasts.
Coffee prices this morning recovered from 2-week lows and are moderately higher. Short covering emerged in coffee futures today after updated weather forecasts reduced the chances for rain in Brazil next week.
Dryness in Brazil that could reduce coffee yields supports prices after Somar Meteorologia reported Monday that Brazil’s Minas Gerais region received no rainfall or 0% of the historical average in the past week. Minas Gerais accounts for about 30% of Brazil’s arabica crop.
On April 18, arabica coffee posted a new 2-year high, and nearest-futures (K24) robusta coffee posted a new all-time high last Thursday. Coffee prices have surged over the past two months due to crop concerns in Brazil and Vietnam. Robusta coffee continues to surge to new record highs on fears that excessive dryness in Vietnam will limit the country’s robusta coffee production.
Tight robusta coffee supplies from Vietnam, the world’s largest producer of robusta coffee beans, are a major bullish factor. On March 26, Vietnam’s agriculture department projected that Vietnam’s coffee production in the 2023/24 crop year would drop by -20% to 1.472 MMT, the smallest crop in four years, due to drought. Also, the Vietnam Coffee Association said that Vietnam’s 2023/24 coffee exports would drop -20% y/y to 1.336 MM. In addition, Marex Group Plc forecasts a global 2024/25 robusta coffee deficit of -2.7 million bags due to reduced output in Vietnam.
Coffee inventories have rebounded from historically low levels. ICE-monitored robusta coffee inventories on February 21 fell to a record low of 1,958 lots, although they recovered to a 5-month high today of 3,945 lots. Also, ICE-monitored arabica coffee inventories fell to a 24-year low of 224,066 bags on November 30, but they recovered to an 11-1/2 month high last Thursday of 661,492 bags.
There has recently been some bearish export news. Cecafe reported on April 10 that Brazil’s Mar green coffee exports jumped +41% y/y to 3.9 million bags. Brazil is the world’s largest producer of arabica coffee beans. Also, Brazil’s exporter group Comexim, on February 1, raised its Brazil 2023/24 coffee export estimate to 44.9 million bags from a previous estimate of 41.5 million bags. The International Coffee Association (ICO) on April 15 reported that global coffee exports in Feb rose +6.8% y/y to 11.33 million bags, and total 2023/24 global coffee exports from Oct-Feb rose +11.1% y/y to 56.2 million bags. In a bearish factor for robusta, Vietnam’s General Statistics Office on Monday reported that Vietnam’s Apr coffee exports rose +3.9% y/y to 170,000 MT, and Vietnam’s Jan-Apr coffee exports are up +5.4% y/y to 756,000 MT.
This past year’s El Nino weather event has been bullish for coffee prices. An El Nino pattern typically brings heavy rain to Brazil and drought to India, negatively impacting coffee crop production. The El Nino event has brought drought to Vietnam’s coffee areas this year, according to an official from Vietnam’s Institute of Meteorology, Hydrology, and Climate Change.
In a bearish factor, the International Coffee Organization (ICO) projected on December 5 that 2023/24 global coffee production would climb +5.8% y/y to 178 million bags due to an exceptional off-biennial crop year. ICO also projects global 2023/24 coffee consumption will rise +2.2% y/y to 177 million bags, resulting in a 1 million bag coffee surplus.
The USDA’s Foreign Agriculture Service (FAS), in its biannual report released on December 21, projected that world coffee production in 2023/24 will increase +4.2% y/y to 171.4 million bags, with a +10.7% increase in arabica production to 97.3 million bags, and a -3.3% decline in robusta production to 74.1 million bags. The USDA’s FAS forecasts that 2023/24 ending stocks will fall by -4.0% to 26.5 million bags from 27.6 million bags in 2022-23. The USDA’s FAS projects that Brazil’s 2023/24 arabica production would climb +12.8% y/y to 44.9 mln bags due to higher yields and increased planted acreage. The USDA’s FAS also forecasts that 2023/24 coffee production in Colombia, the world’s second-largest arabica producer, will climb +7.5% y/y to 11.5 mln bags.
More Coffee News from Barchart
On the date of publication, Rich Asplund did not have (either directly or indirectly) positions in any of the securities mentioned in this article. All information and data in this article is solely for informational purposes. For more information please view the Barchart Disclosure Policy here.
The views and opinions expressed herein are the views and opinions of the author and do not necessarily reflect those of Nasdaq, Inc.
You have reached your limit of 5 free articles for this month.
Access all our articles, insights, and analysts.
Your coupon code
Spot Gold turned positive at the beginning of the week, with XAU/USD reaching an intraday high of $2,331.88. The US Dollar weakened throughout the first half of the day, although trading conditions were thin amid holidays in Japan and the United Kingdom. The market mood remained upbeat in Asia and Europe, undermining demand for the American currency. After Wall SStreet’sopening, however, the mood temporarily soured, leading to some modest USD gains.
XAU/USD picked up following mixed comments from Federal Reserve (Fed) officials, as Richmond Fed President Thomas Barkin, voting member of the Federal Open Market Committee (FOMC), said inflation this year has been disappointing, adding policymakers’ job is not yet done. Furthermore, he said that given the strong labor market, the Fed has time to gain confidence that inflation will fall. Finally, he said he does not see the economy overheating but added the central bank knows how to respond if it does.
Then, it was the turn of John C. Williams, President of the Federal Reserve Bank of New York. His words were mostly dovish. He said that indeed, the Fed eventually will cut rates, adding that the central bank is looking at the totality of economic data. Finally, he noted that job growth is moderating, while the Fed balance sheet’s drawdown has not affected markets.
The macroeconomic calendar will remain scarce in the United States (US) this week, although multiple Fed speakers could set the tone after last week’s moderately hawkish monetary policy announcement.
From a technical point of view, XAU/USD has made little progress, although the odds for a downward acceleration diluted. The daily chart shows the pair trades around a critical Fibonacci level, the 23.6% retracement of the April/May rally at $2,326.50. The daily chart shows the 20 Simple Moving Average (SMA) remains directionless at around $2,340.15, providing near-term resistance. The longer moving averages, in the meantime, maintain their bullish slopes far below the current level. Finally, technical indicators have turned marginally higher, but the Momentum indicator develops within negative levels, while the Relative Strength Index (RSI) indicator stands at around 54, not enough to confirm another leg higher.
In the near term, and according to the 4-hour chart, XAU/USD is losing its early strength. Technical indicators remain within positive levels but are turning flat. At the same time, the pair continues to develop within moving averages, with a bearish 100 SMA providing dynamic resistance in the $2,340 region. On a positive note, the 20 SMA keeps grinding higher below the current level, skewing the risk to the upside.
Support levels: 2,310.40 2,291.20, 2,276.50
Resistance levels: 2,340.15 2,356.90 2,372.85
View Live Chart for XAU/USD
Spot Gold turned positive at the beginning of the week, with XAU/USD reaching an intraday high of $2,331.88. The US Dollar weakened throughout the first half of the day, although trading conditions were thin amid holidays in Japan and the United Kingdom. The market mood remained upbeat in Asia and Europe, undermining demand for the American currency. After Wall SStreet’sopening, however, the mood temporarily soured, leading to some modest USD gains.
XAU/USD picked up following mixed comments from Federal Reserve (Fed) officials, as Richmond Fed President Thomas Barkin, voting member of the Federal Open Market Committee (FOMC), said inflation this year has been disappointing, adding policymakers’ job is not yet done. Furthermore, he said that given the strong labor market, the Fed has time to gain confidence that inflation will fall. Finally, he said he does not see the economy overheating but added the central bank knows how to respond if it does.
Then, it was the turn of John C. Williams, President of the Federal Reserve Bank of New York. His words were mostly dovish. He said that indeed, the Fed eventually will cut rates, adding that the central bank is looking at the totality of economic data. Finally, he noted that job growth is moderating, while the Fed balance sheet’s drawdown has not affected markets.
The macroeconomic calendar will remain scarce in the United States (US) this week, although multiple Fed speakers could set the tone after last week’s moderately hawkish monetary policy announcement.
From a technical point of view, XAU/USD has made little progress, although the odds for a downward acceleration diluted. The daily chart shows the pair trades around a critical Fibonacci level, the 23.6% retracement of the April/May rally at $2,326.50. The daily chart shows the 20 Simple Moving Average (SMA) remains directionless at around $2,340.15, providing near-term resistance. The longer moving averages, in the meantime, maintain their bullish slopes far below the current level. Finally, technical indicators have turned marginally higher, but the Momentum indicator develops within negative levels, while the Relative Strength Index (RSI) indicator stands at around 54, not enough to confirm another leg higher.
In the near term, and according to the 4-hour chart, XAU/USD is losing its early strength. Technical indicators remain within positive levels but are turning flat. At the same time, the pair continues to develop within moving averages, with a bearish 100 SMA providing dynamic resistance in the $2,340 region. On a positive note, the 20 SMA keeps grinding higher below the current level, skewing the risk to the upside.
Support levels: 2,310.40 2,291.20, 2,276.50
Resistance levels: 2,340.15 2,356.90 2,372.85
View Live Chart for XAU/USD
Following today’s close, a bull trend continuation signal will be generated on a rally above today’s high and confirmed on a daily close above it. However, given that the ascent has stalled within a target zone, the potential for a pullback prior to a continuation higher has increased. This would be healthy for the advance and provide better risk reward opportunities for the next rally.
Last week’s pullback was shallow, indicating underlying strength in demand. A somewhat similar short-term pullback may occur off today’s high. Significant potential support is noted at last week’s low of 1.91 and it marks the maximum decline anticipated for the near-term bullish outlook to be maintained. But support should be seen higher. Watch the 2.17 price zone (resistance and now potential support from February 1 high) and today’s low of 2.13.
The current upswing in natural gas has exceeded the three previous rallies of 22.3%, 32%, and 24.8%, reflecting improving demand. As of today’s high, it was up by 42.9% from the most recent swing low at 1.58 (C). The relative performance confirms that the buyers are back in charge. Analysis of time provides additional supporting evidence for the bull move as the current advance was faster than the prior three.
This is another way to confirm strength as the current advance is only on its seventh day and the three prior rallies completed in three to 11 days. So, based on time there could be further upside. Also, taking a measured move of the fourth most recent rally, that began from the December 13 swing low, further supports a bullish scenario. That rally was 51.8% in 20 trading days. Similar performance in the current move would occur around a 2.40 target zone.
For a look at all of today’s economic events, check out our economic calendar.

Natural gas markets have pulled back from the $2.90 level rather stringently, showing signs of negativity. If we can break down to a fresh, new low, the market should then go down to the $2.80 level, and eventually the $2.70 level after that. The market has been consolidating for quite some time, and we had gotten a bit too close to the highs recently to continue going to the upside. At this point, I think that the $2.90 level will continue to bring in a lot of fresh selling, and even bullish inventory numbers won’t do much to hold the market up for the longer-term as the $3.00 level has been extraordinarily resistive.
The $2.70 level underneath is massive support though, so I think that’s about as low as we go. I intend to continue to play the range going forward, unless of course it gets smashed somehow. It’s been very reliable for quite some time now, so I don’t have any interest in trying to front run any type of major move. I believe that more of the same as in store, and for those who can take the longer-term outlook, this is a great market to trade. The day-to-day operations of the natural gas pits are a bit more nauseating though, but at the end of the day there are clear boundaries if you step back and look at the weekly charts.
This article was originally posted on FX Empire
The West Texas Intermediate Crude Oil market initially tried to rally a bit during the trading session, and even managed to peak above the 200-Day EMA at one point. However, it could not continue that momentum and it looks as if the drop was almost instantaneous. At this point, we reach down to the $70 level, which is an area where we have seen a lot of noise previously. At this point, you have to wonder whether or not we will have buyers coming back into the market?

If the market were to turn around and jump above the last couple of candlestick, then it could open up the possibility of taking out the $80 level above, which obviously would put a lot of bullish attitude into this market and perhaps give a little bit of relief for those who are bit cautious about the crude oil market in and of itself.

Brent initially tried to rally during the trading session as well, but it looks as if the $84.50 level is going to offer a significant amount of resistance. The 200-Day EMA is in this general vicinity, therefore I think you get a situation where we are going to see a lot of noisy behavior. Underneath, we have a lot of support, but at this point in time there is not much driving the market and at this point that suggests that we are ready to go higher. That being said, it’s not necessarily easy to go higher in this type of environment, but geopolitical noise could come into the picture in turn things around almost instantly.
That being said, keep in mind that cyclically speaking, this is typically a very bullish time of year as well. What does the oil market tell us about the overall economy? That could be the real question to ask at this point in time.
Ready to trade our WTI Crude Oil Forex? We’ve made a list of the best Forex Oil trading platforms worth trading with.
Last week, oil prices saw significant declines, with Brent crude dropping over 7%. This reflects the market’s reaction to weaker U.S. job data and anticipation of Federal Reserve policy adjustments. The reduction in the number of U.S. oil rigs also suggests a tightening supply, further impacting future oil and natural gas price forecasts.
The stronger U.S. Dollar helped limit purchased by foreign buyers. Mixed signals from China’s economy is weighing on demand. Nickel prices hit their lowest level in more than six weeks on Tuesday dragging down copper prices.

The main trend is up according to the daily swing chart. However, Tuesday’s steep sell-off triggered a shift in momentum to down.
A trade through $3.1985 will signal a resumption of the uptrend. A move through $3.0550 will change the main trend to down.
The main range is $2.9135 to $3.2790. Its retracement zone at $3.0960 to $3.0530 is the primary downside target. This zone is controlling the longer-term direction of the market.
The intermediate range is $3.2790 to $3.0550. Its retracement zone at $3.1670 to $3.1935 stopped the rally on November 24 and provided resistance on Monday.
The short-term range is $3.0550 to $3.1985. Tuesday’s close below its retracement zone at $3.1270 to $3.1100 is a sign of short-term weakness.

Based on Tuesday’s close at $3.0985, the direction of copper futures today will be determined by trader reaction to the major 50% level at $3.0960.
A sustained move over $3.0960 will indicate the presence of buyers. However, an early rally will be labored because of potential resistance at $3.1100 and $3.1270. Taking out $3.1270 with strong buying could trigger an acceleration into $3.1670 to $3.1935.
A sustained move under $3.0960 could trigger an acceleration into $3.0550 and $3.0530. The daily chart indicates there is plenty of room to the downside if $3.0530 fails as support.
This article was originally posted on FX Empire
The early weakness could be a reaction to overnight comments from the European Commission on Thursday that said gas supply is not at risk from a Ukraine transit issue.
If you recall, Ukraine announced on Tuesday that it would suspend the flow of gas through a transit point bringing Russian fuel to Europe. Traders saw this as a bullish sign. However, earlier today, the EU said it does not present a gas supply issue. Instead, it blamed Moscow for the disruption.
At 10:19 GMT, June natural gas futures are trading $7.311, down $0.329 or -4.31%. On Wednesday, the United States Natural Gas Fund ETF (UNG) settled at $26.37, up $1.58 or +6.37%.
U.S. natural gas futures gained about 4% on Wednesday on a big drop in daily output over the past three days and forecasts for more demand this week than previously expected. The shutdown of a pipeline carrying Russian gas through Ukraine also helped support U.S. gas futures by temporarily lifting European prices.
According to NatGasWeather for May 12-18, “Texas and the South Plains remain very warm to hot with highs of 80s and 90s, while the West into the Northern Plains remains mild & unsettled as weather systems track through.
It’s also warm from the Southern Great Lakes to the South as high pressure rules with highs of 80s to lower 90s.
The East will be nice with 70s and 80s despite a weather system off the coast that’s slowly tracking into the Southeast with showers.
For late this week through mid-next week, the northern U.S. will be comfortable with highs of 60s and 70s as late season weather systems track through, while the southern U.S. remains very warm to hot with highs of 80s and 90s, besides 100s in the Southwest deserts into West Texas.”
According to survey averages, today’s EIA storage report is expected to show an injection of 80 Bcf for the week-ending May 6. This is slightly below the 5-year average of 82 Bcf.
Natural Gas Intelligence (NGI) is reporting that analysts are expecting an injection in the low 80s Bcf. Bloomberg’s survey showed estimates of 64 Bcf to 85 Bcf, with a median of 81 Bcf.
Last year the report showed an injection of 70 Bcf during the same week last year and a five-year average increase of 82 Bcf.
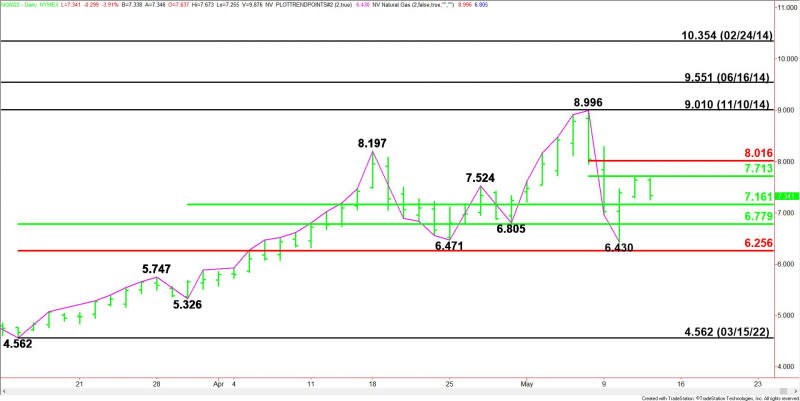
June natural gas futures are currently trading between retracement zone resistance at $7.713 to $8.016 and retracement zone support at $6.779 to $6.256.
Since the longer-term trend is up and expected to be supported by strong fundamentals, we’re looking for bullish traders to continue to support the market on breaks back into support.
On the upside, a sustained move over $8.016 could bring in aggressive traders willing to buy strength.
Excessive heat over the next two weeks will make it difficult to close the current storage deficit even if output increases. This is supportive for higher prices.
For a look at all of today’s economic events, check out our economic calendar.
This article was originally posted on FX Empire

Natural gas markets have dropped a bit during the trading session on Friday to break down below the $2.50 level, and now it looks as if we are ready to go much lower. At this point, if we continue to see any negativity, it’s likely that the $2.00 level could be a target. The $2.00 level is a large, round, psychologically significant figure and an area that has been important in the past, and of course will attract a lot of attention. At this point, this is a situation where things have gotten so out of control you cannot chase the market all the way down here.
The only thing I think you can think about doing at this point is waiting for some type of bear market rally that you can start fading at the first signs of exhaustion. If you are short-term day trader, then you can fade short-term rallies, but you need to keep in mind that this is a market that is way oversold at this point, and seemingly is right for some type of bear market rally that could rip the face off of sellers.
The 50-Day EMA is near the $4.14 level and is dropping, so I think it’s likely that we could see that offer a bit of resistance on a rally, and I think at this point it’s very likely that we would see some type of cold snap cause this, but quite frankly the cold snap that is going on right now in the United States has not moved the needle, so we will have to wait and see how this plays out.
For a look at all of today’s economic events, check out our economic calendar.
This article was originally posted on FX Empire