The main tag of Gold Today Price Articles.
You can use the search box below to find what you need.
[wd_asp id=1]
The main tag of Gold Today Price Articles.
You can use the search box below to find what you need.
[wd_asp id=1]
The article covers the following subjects:
Consider long positions from corrections above 67.00 with a target of 91.80–105.17.
Breakout and consolidation below 67.00 will allow the asset to continue declining to the levels of 62.00–58.50.
A descending correction appears to have formed as the second wave of larger degree (2) on the weekly chart, with wave C of (2) completed as its part. On the daily time frame, an ascending third wave (3) is likely developing. Within it, the first wave of smaller degree 1 of (3) has formed, and a downward correction has been completed as the second wave 2 of (3). Wave 3 of (3) has presumably started developing on the H4 time frame, with wave (i) of i of 3 forming as its part. If the presumption is correct, WTI will continue to rise to 91.80–105.17. The level of 67.00 is critical in this scenario as a breakout below it will enable the asset to continue declining to the levels of 62.00–58.50.
This forecast is based on the Elliott Wave Theory. When developing trading strategies, it is essential to consider fundamental factors, as the market situation can change at any time.
The content of this article reflects the author’s opinion and does not necessarily reflect the official position of LiteFinance broker. The material published on this page is provided for informational purposes only and should not be considered as the provision of investment advice for the purposes of Directive 2014/65/EU.
According to copyright law, this article is considered intellectual property, which includes a prohibition on copying and distributing it without consent.
The EURJPY pair repeated providing negative closes below the barrier at 185.85, forcing it to delay the bullish trend, to activate the bearish corrective trend by reaching 184.75.
Suffering new negative pressure makes us resume the corrective attempts, attempting to reach 184.55, to press on the support at 184.20 to find an exit to resume the negative trading, while breaching the barrier will confirm its readiness to record new gains by its rally towards 186.20 and 186.60.
The expected trading range for today is between 184.20 and 185.60
Trend forecast: Bearish
Copper price failed to break $2.9500 level, affected by the stability of the moving average 55 near it, forcing it to delay the corrective decline and forming some bullish waves, to settle near $6.2000.
The current bullish rally doesn’t affect the bearish corrective trend due to the stability below $6.3000 barrier, which makes us wait for gathering the negative momentum again, which allows it to renew the pressure on the barrier at $5.9500 to find an exit for targeting new bearish stations that begin at $5.8100, while breaching the barrier and holding above it will open the way for recording extra gains that might begin at $6.4600.
The expected trading range for today is between $5.9500 and $6.3000
Trend forecast: Bearish
Domestic coffee prices today
Coffee prices today in the domestic market simultaneously increased very strongly in key production areas. The average price was recorded at 98,300 VND/kg, an increase of 6,000 VND/kg compared to the previous update.
In Dak Lak, coffee prices increased by 6,000 VND/kg, to 98,200 VND/kg. In Gia Lai, coffee prices reached 98,300 VND/kg, also increasing by 6,000 VND/kg.
In Lam Dong, coffee prices today increased by 6,100 VND/kg, to 97,900 VND/kg. This is still the lowest level among the surveyed areas.
The old Dak Nong area recorded the highest purchase price, reaching 98,400 VND/kg, an increase of 6,100 VND/kg compared to the previous update.
Thus, domestic coffee prices currently fluctuate from 97. 900-98. 400 VND/kg. The gap between the region with the highest and lowest prices is 500 VND/kg.
After a strong increase session, the domestic coffee price level has approached the threshold of 100,000 VND/kg. This is a notable increase after two previous deep decline sessions.
The USD/VND exchange rate according to Vietcombank is recorded at 26,074 VND/USD.
World coffee prices
World coffee prices simultaneously increased sharply in the most recent trading session. Both Robusta on the London exchange and Arabica on the New York exchange recorded large increases.
On the London exchange, the September 2026 Robusta futures contract increased by 302 USD/ton, equivalent to 8.07%, to 4,043 USD/ton.
During the session, this contract at one point increased to 4,066 USD/ton. Trading volume reached 14,265 lots.
Robusta for November 2026 delivery increased by 290 USD/ton, equivalent to 7.81%, to 4,002 USD/ton.
The January and March 2027 terms increased by 285 USD/ton and 282 USD/ton respectively, to 3,967 USD/ton and 3,933 USD/ton.
The July 2026 Robusta contract reached 4,603 USD/ton, up 171 USD/ton. However, this term has low trading volume because it is close to maturity, so the September contract reflects the market trend more clearly.
On the New York exchange, Arabica increased very strongly. September 2026 Arabica futures contract increased by 38.10 US cents/lb, equivalent to 12.30%, to 347.90 US cents/lb.
During the session, this contract at one point increased to 348.55 US cents/lb. Trading volume reached 34,370 lots.
Arabica December 2026 futures increased by 30.95 US cents/lb, equivalent to 10.41%, to 328.20 US cents/lb.
The March and May 2027 terms increased by 28.80 US cents/lb and 27.85 US cents/lb respectively, to 321.00 US cents/lb and 318.30 US cents/lb.
The July 2026 Arabica contract increased by 32.70 US cents/lb, to 356.95 US cents/lb. However, this term has lower volume than long-term contracts because it is close to maturity.
Coffee price assessment
Domestic coffee prices surged sharply after two consecutive deep declines. This development is accompanied by a very strong recovery of Robusta and Arabica prices in the world market.
In the short term, the coffee market is fluctuating strongly due to the intertwined impact between profit-taking activities, buying force returning after deep declines and cautious psychology in the face of weather risks in large production areas.
The fact that Arabica prices increased by more than 12% and Robusta increased by more than 8% shows that buying power has returned quite strongly on the two exchanges. With the domestic market, the upward momentum of world prices often quickly affects buying and selling sentiment, especially when the price level has fluctuated strongly in recent sessions.
However, it should be noted that too strong uptrends often come with technical correction risks. After coffee prices increase rapidly, profit-taking activities may appear in the market, causing prices to continue to fluctuate strongly in the following sessions.
From a global supply-demand perspective, a report by the International Coffee Organization (ICO) shows that the market previously reacted to the prospect of improved supply. This is a factor that may limit the upward momentum of coffee prices in the medium term.
For Brazil, the Foreign Agricultural Services Agency of the US Department of Agriculture (USDA/FAS) said that the Brazilian National Supply Company (CONAB) forecasts Brazil’s coffee production in the 2026-2027 crop year to reach 66.7 million bags, an increase of 18% compared to 2025.
Brazil is the world’s largest Arabica producer. Therefore, the prospect of a large crop in this country is still an important factor that could put pressure on Arabica prices, although the short-term market is still sensitive to weather risks and harvest progress.
Rabobank of the Netherlands also assessed that the expectation of a large coffee crop in Brazil may put pressure on global prices, in the context of generally favorable weather conditions for crop development.
With Robusta, supply from our country continues to be a noteworthy factor. The USDA/FAS report in Vietnam forecasts that Vietnam’s coffee production in the 2026-2027 crop year will increase to 32.5 million bags converted to green beans, thanks to production expansion after a period of high coffee prices.
Our country is the world’s largest Robusta producer, so the prospect of increased production may put pressure on Robusta in the medium term. However, in the short term, prices may still fluctuate sharply due to export demand, inventory and developments on international exchanges.
TradingKey – As of the Asian session on July 9, after WTI ( USOIL) crude oil prices rebounded sharply for two consecutive trading days, oil prices hovered and adjusted around $73.30 today. From the technical chart, due to the recent deterioration of the US-Iran situation and the resumption of fire between the two sides, oil prices were driven to rebound significantly for two consecutive trading days, with a cumulative rebound of nearly 11%. However, yesterday oil prices failed to stand firmly above the resistance level of $75, causing oil prices to enter an adjustment phase today.
From a fundamental perspective, the core factor dominating recent oil price trends remains the situation between the US and Iran.
The latest news indicates that the US has launched a new round of military strikes against Iran, targeting missiles, drones, radar, and naval-related facilities. This has significantly cooled market expectations for a ceasefire and negotiations between the US and Iran, while reigniting investor concerns over supply disruptions in the Middle East.
Trump’s latest remarks have further amplified bullish sentiment in the market. He stated that the ceasefire between the US and Iran has ended and remarked that dealing with Iran is a waste of time. This stance implies that the US government’s attitude toward Iran has shifted back to a hawkish stance, leaving the market concerned that it will be difficult for both sides to return to a stable negotiation framework in the short term.
Iran has also taken retaliatory action. According to reports, Iran launched attacks on US military bases in the Gulf region, targeting US facilities in places like Bahrain and Kuwait. This means the conflict is no longer confined to the Iranian mainland and single military targets, but has begun to spill over into the broader Gulf region. As the Gulf region concentrates major global crude oil export routes, any spread of military risk will directly impact tanker shipping, insurance costs, and export stability.
In the short term, as long as the US-Iran conflict does not de-escalate, WTI is likely to maintain high-level volatility and may even continue to challenge higher resistance levels. However, if both sides send signals of resuming negotiations, or if navigation through the Strait of Hormuz recovers faster than expected, the risk premium in oil prices could rapidly recede.
WTI crude oil daily chart, Source: TradingView
Looking at the daily chart of WTI crude oil, the oil price has successfully established a foothold above the $70 threshold during its strong rebound over the past two trading days. Previously, the oil price had been consistently suppressed below $70, and the overall market sentiment was weak. As the oil price broke through the two resistance levels of $70 and $73, long sentiment in the market was significantly amplified.
However, it is worth noting that although the oil price briefly broke through the $75 resistance level yesterday, reaching a high of $76.08, yesterday’s closing price remained below the $75 resistance level. The oil price exhibited a false breakout pattern, which in turn put downward pressure on the oil price today.
As things stand, the oil price faces a resistance level at $75 above. If it can break through and hold above this level, the upside space for the oil price will open up, with the next target testing the $80 mark. On the downside, it faces a support level at $73; if the oil price falls below this level, it may decline further toward the $70 mark.
This content was translated using AI and reviewed for clarity. It is for informational purposes only.
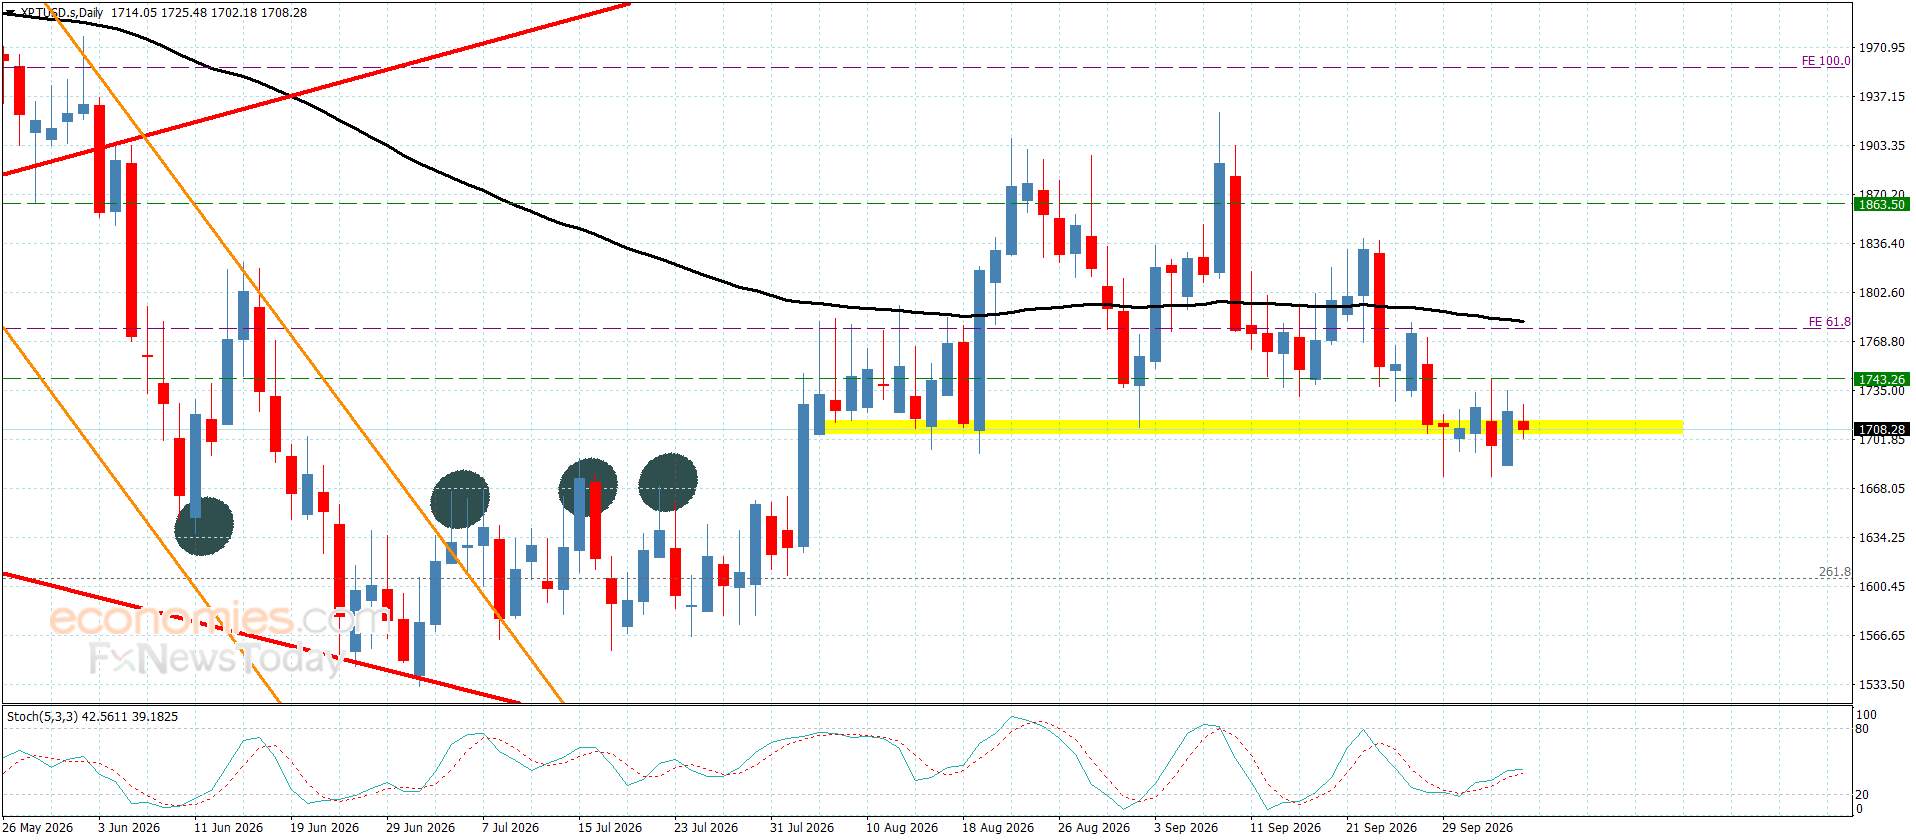
Platinum price formed some bearish waves, to settle below $1605.00 level, attempting to settle again within the minor bearish channel’s levels, to confirm the continuation of the previously suggested bearish scenario, recording initial negative target at $1570.00.
Providing negative momentum by the main indicators will increase the chances of attacking $1530.00 barrier, and surpassing it will open the way for reaching extra stations that are represented by $1510.00 reaching $1445.00
The expected trading range for today is between $1510.00 and $1630.00
Trend forecast: Bearish
Platinum price updates for Amravati show the current rates as ₹48,770 (10g),
₹4,87,700 (100g), and ₹48,77,000 (1kg). Over July, prices changed
frequently. The 100g rate peaked at ₹5,07,100 and dropped to
₹4,66,700. For 1kg, it fluctuated between
₹46,67,000 and ₹50,71,000.
The cost of platinum is influenced by mining output, global market demand, and
geopolitical stability. Industrial reliance—mainly in cars and electronics—drives
additional volatility. Shifts in currency, especially the US dollar, as well as
macroeconomic indicators like inflation and interest rate policies, strongly shape its
pricing.
Silver price (XAG/USD) is up over 1% to near $59.00 during the European trading session on Thursday. The white metal gains as the US Dollar (USD) faces selling pressure despite multiple tailwinds.
At press time, the US Dollar Index (DXY), which tracks the Greenback’s value against six major currencies, trades 0.25% lower to near 100.80.
The table below shows the percentage change of US Dollar (USD) against listed major currencies today. US Dollar was the weakest against the New Zealand Dollar.
| USD | EUR | GBP | JPY | CAD | AUD | NZD | CHF | |
|---|---|---|---|---|---|---|---|---|
| USD | -0.24% | -0.28% | -0.18% | -0.10% | -0.18% | -0.58% | -0.33% | |
| EUR | 0.24% | -0.04% | 0.04% | 0.13% | 0.09% | -0.31% | -0.09% | |
| GBP | 0.28% | 0.04% | 0.07% | 0.17% | 0.12% | -0.27% | -0.04% | |
| JPY | 0.18% | -0.04% | -0.07% | 0.07% | 0.05% | -0.38% | -0.13% | |
| CAD | 0.10% | -0.13% | -0.17% | -0.07% | -0.04% | -0.44% | -0.21% | |
| AUD | 0.18% | -0.09% | -0.12% | -0.05% | 0.04% | -0.39% | -0.17% | |
| NZD | 0.58% | 0.31% | 0.27% | 0.38% | 0.44% | 0.39% | 0.23% | |
| CHF | 0.33% | 0.09% | 0.04% | 0.13% | 0.21% | 0.17% | -0.23% |
The heat map shows percentage changes of major currencies against each other. The base currency is picked from the left column, while the quote currency is picked from the top row. For example, if you pick the US Dollar from the left column and move along the horizontal line to the Japanese Yen, the percentage change displayed in the box will represent USD (base)/JPY (quote).
Technically, a lower US Dollar makes the Silver price a favorable risk-reward bet for investors.
The US Dollar struggles to get support despite renewed high United States (US) inflation concerns amid the restart of the war in the Middle East.
Rising oil prices due to the exchange of attacks between the US and Iran, and strikes on Iranian infrastructure have refreshed global upside inflation risks.
In the FOMC minutes of the June policy meeting, released on Wednesday, the bottom line was that policymakers see inflation as dominant risk and favored monetary tightening moving ahead.
Going forward, the next major trigger for the US Dollar will be the US Consumer Price Index (CPI) data for June, which will be released on Tuesday.
XAG/USD trades higher at around $59; however, it retains a bearish near-term bias as spot holds beneath the 20-day exponential moving average (EMA) at $62.38. The downside tilt is reinforced by the Relative Strength Index (14) hovering around 37, which stays below the neutral 50 line but above oversold territory, suggesting persistent selling pressure without capitulation.
On the topside, initial resistance is the round-level of $60.00, followed by the 20-day EMA at $62.38. Looking down, the Silver price could enter a fresh downside leg if it declines below the June 24 low at $55.63.
(The technical analysis of this story was written with the help of an AI tool. Know more.)
Silver is a precious metal highly traded among investors. It has been historically used as a store of value and a medium of exchange. Although less popular than Gold, traders may turn to Silver to diversify their investment portfolio, for its intrinsic value or as a potential hedge during high-inflation periods. Investors can buy physical Silver, in coins or in bars, or trade it through vehicles such as Exchange Traded Funds, which track its price on international markets.
Silver prices can move due to a wide range of factors. Geopolitical instability or fears of a deep recession can make Silver price escalate due to its safe-haven status, although to a lesser extent than Gold’s. As a yieldless asset, Silver tends to rise with lower interest rates. Its moves also depend on how the US Dollar (USD) behaves as the asset is priced in dollars (XAG/USD). A strong Dollar tends to keep the price of Silver at bay, whereas a weaker Dollar is likely to propel prices up. Other factors such as investment demand, mining supply – Silver is much more abundant than Gold – and recycling rates can also affect prices.
Silver is widely used in industry, particularly in sectors such as electronics or solar energy, as it has one of the highest electric conductivity of all metals – more than Copper and Gold. A surge in demand can increase prices, while a decline tends to lower them. Dynamics in the US, Chinese and Indian economies can also contribute to price swings: for the US and particularly China, their big industrial sectors use Silver in various processes; in India, consumers’ demand for the precious metal for jewellery also plays a key role in setting prices.
Silver prices tend to follow Gold’s moves. When Gold prices rise, Silver typically follows suit, as their status as safe-haven assets is similar. The Gold/Silver ratio, which shows the number of ounces of Silver needed to equal the value of one ounce of Gold, may help to determine the relative valuation between both metals. Some investors may consider a high ratio as an indicator that Silver is undervalued, or Gold is overvalued. On the contrary, a low ratio might suggest that Gold is undervalued relative to Silver.