The main tag of Gold News Today Articles.
You can use the search box below to find what you need.
[wd_asp id=1]

25 12, 2025

Copper’s Record Run, China Iron Ore Tensions, and What Analysts Forecast for 2026

By |2025-12-25T08:08:25+02:00December 25, 2025|Forex News, News|0 Comments


BHP Group Ltd (ASX: BHP; NYSE: BHP) is heading into the year-end holiday stretch with a familiar “big miner” cocktail: copper is surging to historic highs, iron ore remains the profit engine but is tangled in tough China-facing commercial politics, and investors are still weighing whether BHP’s next leg of growth comes from disciplined project delivery—or the temptation of headline-grabbing M&A.

With markets thinned by Christmas-week trading, the most actionable inputs for BHP stock right now are not dramatic one-day price moves, but the underlying drivers that will shape cash flow and dividends across 2026: copper pricing and supply tightness, iron ore volumes and realized pricing, and BHP’s ability to execute major growth projects (and fund them smartly).

Where BHP stock stands heading into Christmas week

In U.S. trading, BHP’s NYSE-listed ADR closed around $60.87 in the latest session available (Dec. 24, 2025) and implies a market capitalization near $155 billion. [1]

In Australia, BHP has been back on investor radar after a late-2025 rebound, with one widely followed valuation note pointing to roughly a 12% one-month lift and a share price around A$45 (Dec. 23). [2]

That bounce matters because BHP is often traded as a “macro + dividends + China” proxy. When metals prices rip higher, BHP tends to benefit—but the market also tends to ask, immediately and relentlessly: Will the company actually convert this cycle into sustainable free cash flow and shareholder returns?

The biggest tailwind right now: copper—and the AI/grid demand story

The most obvious, loudest tailwind into Dec. 25 is copper.

Copper prices pushed into record territory this week, breaking above $12,000 per tonne amid a mix of supply disruptions, tariff fears, and tightening availability outside the U.S. [3] The broader market narrative is that copper is being pulled in two directions at once:

  • structurally rising long-term demand (electrification, grid upgrades, EVs, data centers), and
  • short-term trade dislocation (tariff uncertainty shifting physical flows and inventories)

Reuters’ metals coverage has repeatedly highlighted the “dislocation” angle—where the threat of tariffs can be as market-moving as tariffs themselves, reshaping where copper sits and who feels “short” of metal. [4]

The other piece: analysts have been modeling persistent deficits. A Reuters roundup of copper market dynamics cited expectations for a 124,000-tonne deficit in 2025 and 150,000 tonnes in 2026, alongside a demand story increasingly tied to power infrastructure and AI-era electricity buildouts. [5]

Why this matters specifically for BHP shares

BHP is not “a copper pure play,” but copper is one of the company’s most important levers for growth and narrative momentum—and BHP’s own operational readouts have leaned into that.

In its operational review for the quarter ended Sept. 30, 2025 (reported in October), BHP said group copper production rose 4% and highlighted record concentrator throughput at Escondida. The company also reiterated FY2026 copper production guidance of 1,800–2,000 kt, with Escondida guidance 1,150–1,250 kt. [6]

When copper is printing all-time highs, markets usually do two things at once:

  1. reward near-term earnings torque, and
  2. re-rate long-dated copper optionality (projects, expansions, districts)

BHP is trying to be in both camps.

Iron ore is still BHP’s cash-flow core—now with China-facing friction

Even with copper stealing the spotlight, iron ore remains the heavy gravitational mass in BHP’s earnings universe. And right now, the iron ore story has two layers:

Layer 1: Operations look solid

BHP reported quarterly iron ore production of 64.1 Mt, with FY2026 guidance unchanged at 258–269 Mt (equity basis). WAIO (Western Australia Iron Ore) shipments and supply-chain execution were positioned as standouts, including the completion of the Car Dumper 3 rebuild at Port Hedland ahead of schedule. [7]

BHP also disclosed an average realized iron ore price around US$84.04/wmt for that quarter (Sept. 2025 quarter), up year-on-year in the same disclosure. [8]

Layer 2: China commercial politics are messy—and potentially market-moving

The more delicate layer is the ongoing negotiation tension between major miners and China’s centralised iron ore buying apparatus.

Reuters reported that a stand-off between China Mineral Resources Group (CMRG) and BHP tightened iron ore supplies, with market participants pointing to disrupted flows tied to contract negotiations. [9]

In a related Reuters report, several BHP cargoes were reportedly offered for sale in China amid “ban fear” headlines, with sources indicating at least one cargo traded—suggesting a complicated reality: pressure points exist, but trade in other grades can continue even while specific products are frozen. [10]

For BHP stock, this matters because iron ore isn’t just a commodity exposure—it’s also a relationship exposure. If negotiations snarl into prolonged disruptions (even if partial), the market will price in risk around volumes, realized pricing, and China channel access.

Project execution and asset quality: Samarco, grades, and “better iron ore”

One underappreciated theme for miners in 2026 is not just volume, but quality—especially as steelmakers and regulators push on emissions and efficiency.

An Argus analysis published Dec. 23, 2025 argued that new supply developments could lift average grades for major producers, specifically pointing to the ramp-up of BHP’s Samarco operations in Brazil as a potential support for BHP’s overall product quality. Argus noted BHP’s aim to produce 7–7.5 million tonnes of ~67% Fe pellets at Samarco in FY2025–26 and referenced longer-term ramp potential toward higher capacity by 2028. [11]

This dovetails with BHP’s own FY2026 Samarco guidance of 7–7.5 Mt (equity basis). [12]

If iron ore markets become more quality-sensitive over time, “better tons” can matter disproportionately—especially in tight markets where buyers pay up for consistency and performance.

Capital strategy in focus: the $2 billion infrastructure funding deal

BHP also gave markets a clear signal in December: it wants to fund growth while keeping balance sheet flexibility, and it’s willing to “recycle capital” from infrastructure-like assets to do it.

Reuters reported that BHP struck a $2 billion deal with Global Infrastructure Partners (GIP)—owned by BlackRock—linked to BHP’s WAIO inland power network. The structure involved a new entity with BHP holding 51% and GIP 49%, with BHP retaining operational control and paying a tariff over 25 years tied to usage. [13]

This kind of transaction tends to be read as:

  • a pragmatic funding move (freeing capital without giving up operating control), and
  • a quiet admission that the capex pipeline is large enough to justify creative financing

For BHP stock, it’s also a signal that management is actively trying to avoid a “dividends vs growth” zero-sum fight.

Dividends, profits, and the shareholder bargain

BHP investors—especially in Australia—treat the stock like a hybrid: part commodity exposure, part income vehicle.

On that front, Reuters’ coverage of BHP’s FY2025 results (year ended June 30, 2025) reported:

  • underlying profit of $10.16 billion (a five-year low in that metric, per the report),
  • a total FY dividend of $1.10 per share, with a final dividend of $0.60, and
  • a raised net debt target range of $10–$20 billion. [14]

This is the core bargain BHP stock keeps making with the market: You accept cyclicality, and in return you get scale, resilience, and a meaningful slice of cash when the cycle cooperates.

Copper strength helps that bargain. Iron ore stability protects it. Cost blowouts and project delays threaten it.

BHP stock forecast: what analysts are saying heading into 2026

Analyst forecasts are not prophecy; they’re structured guesses with assumptions wearing a suit and pretending they don’t sweat. Still, they matter because they influence institutional positioning.

One widely referenced compilation (MarketBeat) put BHP at a “Hold” consensus rating based on 10 analyst ratings, with an average 12‑month price target of $48.50 (range $44–$53), versus the then-current ADR price around $60.87. [15]

In Australia, a valuation-focused note (Simply Wall St) suggested BHP was trading very close to a “fair value” estimate around A$44.94 versus a recent price around A$45.07, framing the stock as near fully priced after the recent rebound. [16]

How to interpret these forecasts without losing your mind

If you’re trying to reconcile “copper at record highs” with “Hold ratings,” the missing link is usually one (or more) of these assumptions:

  • iron ore mean reversion (analysts often model conservative long-run iron ore pricing)
  • capex intensity (potash, copper expansions, decarbonisation)
  • China demand uncertainty (property, steel output, policy swings)
  • FX and rates (USD strength can hit commodity pricing and AUD revenue translation)

In other words: analysts can like the assets and still hesitate on timing, because miners are where macro confidence goes to be tested.

Technical sentiment check: momentum improved, but not a clean setup

For traders who follow technical indicators (and yes, even fundamental investors secretly peek), Investor’s Business Daily noted BHP’s ADR Relative Strength (RS) Rating rising to 81 from 78 in mid-December, a momentum signal often interpreted as bullish—while also cautioning the stock had moved beyond an “ideal” buy range after a breakout pattern. [17]

That’s basically the technical version of: “Nice move—now don’t chase it.”

What investors should watch next for BHP shares

Here are the highest-signal catalysts and risks as of Dec. 25, 2025—ranked by how directly they can hit BHP’s cash flow narrative:

Copper price structure (not just the headline):
Watch whether copper stays elevated because of real deficits and constrained mine supply, or whether trade-driven inventory relocation unwinds. Reuters’ reporting has emphasized how tariff uncertainty can distort prices and stock locations. [18]

China iron ore negotiations:
Pay attention to whether the CMRG-related stand-offs remain isolated to specific products or broaden into wider commercial disruption. [19]

FY2026 delivery vs guidance:
BHP’s FY2026 guidance ranges—especially copper (1.8–2.0 Mt) and iron ore (258–269 Mt)—set the bar. Markets usually punish misses more than they reward small beats, because miners are supposed to be boring in the execution layer. [20]

Jansen potash and capex discipline:
BHP continues to position Jansen as a major long-term growth pillar, with Stage 1 tracking toward production in 2027 in its operational commentary. [21] Any renewed cost pressure will matter for valuation.

Capital allocation moves like the GIP deal:
More “capital recycling” transactions could be read positively—unless investors start to suspect BHP is selling the family silver to fund overruns. [22]

Bottom line for BHP Group Ltd stock on Dec. 25, 2025

BHP stock is ending 2025 with momentum coming from two directions at once: a copper market that is screaming “scarcity” and “electrification,” and an iron ore business that is still operationally strong but increasingly entangled in China’s evolving approach to commodity purchasing power.

If copper stays structurally tight into 2026—and BHP executes on volume guidance and project milestones—the stock has a credible fundamental case as a diversified, cash-generative miner. If copper’s surge proves more trade-dislocation than durable deficit, or if iron ore negotiations create recurring disruptions, the market will likely revert to treating BHP as what it has always been at heart: a world-class portfolio living inside a cyclical pricing machine.

References

1. stockanalysis.com, 2. simplywall.st, 3. www.ft.com, 4. www.reuters.com, 5. www.reuters.com, 6. www.bhp.com, 7. www.bhp.com, 8. www.bhp.com, 9. www.reuters.com, 10. www.reuters.com, 11. www.argusmedia.com, 12. www.bhp.com, 13. www.reuters.com, 14. www.reuters.com, 15. www.marketbeat.com, 16. simplywall.st, 17. www.investors.com, 18. www.reuters.com, 19. www.reuters.com, 20. www.bhp.com, 21. www.bhp.com, 22. www.reuters.com


Source link

25 12, 2025

U.S. Futures Slide Toward $4.25 as Weather Models Ease Heating Demand; Europe’s TTF Ticks Higher

By |2025-12-25T06:06:40+02:00December 25, 2025|Forex News, News|0 Comments


Natural gas markets are ending Christmas Eve with a familiar mix of volatility and contradiction: U.S. Henry Hub-linked futures are retreating after a sharp rally, while Europe’s benchmark prices are firming modestly—all as traders juggle shifting temperature models, LNG headlines, and a holiday-altered flow of “must-watch” data releases.

As of today’s session on Wednesday, December 24, 2025, Natural Gas futures were around $4.249 per MMBtu, down about 3.6% on the day, after opening near $4.421 and trading in a $4.183–$4.589 range. [1]

In Europe, the TTF benchmark rose to roughly €28.09/MWh on Dec. 24, up about 1.37%. [2]

The big picture: markets are still pricing a winter that can change quickly, but the short-term narrative into the holiday weekend is being shaped by near-term warmth in parts of the U.S., regional cold risks, and the ever-present global LNG linkage that increasingly ties U.S. pricing to events well beyond North America.


Natural gas price action today: a pullback after a major pop

The most important context for today’s decline is what happened just before it.

On Tuesday, U.S. natural gas futures surged, and today’s selloff looks like a classic “giveback” in thin holiday liquidity, as traders reassessed the balance between near-term warmth and later-winter cold risk. One market commentary described the move as a drop that partly reversed Tuesday’s sharp rally, citing weather shifts that turned somewhat warmer for the U.S. East Coast in early January, even as colder risks persisted elsewhere. [3]

The day’s tape aligns with the broader pricing data: Dec. 24 shows a sharp down day after a strong up day, reinforcing that weather-driven re-pricing—rather than a single supply shock—is still the primary driver heading into year-end. [4]


Europe and the UK: firmer benchmarks even as global LNG stays competitive

While U.S. futures weakened today, European benchmarks moved the other way—at least modestly.

  • Dutch TTF: around €28.09/MWh, up ~1.37% on Dec. 24. [5]
  • Another price series shows TTF at ~€28.095 on Dec. 24, reinforcing the “slightly higher” tone. [6]
  • UK NBP (quarterly benchmark series) also strengthened on Dec. 24, printing around 71.84 and up roughly 1.33% in that series. [7]

This Europe-firmer/U.S.-softer split is one reason global gas watchers keep emphasizing spreads: when Europe’s benchmark holds up while Henry Hub swings around, LNG economics and destination competition can change quickly.


The weather factor: why forecasts still dominate every natural gas headline

If there’s a single “boss level” for natural gas traders, it’s weather—and that remains true on Dec. 24.

Near-term U.S. demand: warmth reduces immediate heating burn, but cold risks remain regional

A widely followed weather-oriented outlook indicated that warmer-than-normal temperatures were expected to dominate much of the U.S. over the next 7 days, with overall light demand (and only limited colder exceptions). [8]

At the same time, regional cold risks are clearly on the map:

  • In the U.S. Northeast, officials in Connecticut activated a severe cold weather protocol tied to an incoming arctic system, with forecasts including mid-teen temperatures and low wind chills. [9]
  • In Texas, meteorologists flagged a major cooldown early next week, with freeze potential in parts of the state—an important watch item because Texas is central to both U.S. production and LNG export feedgas flows. [10]

Put simply: national demand can look “light” while critical regions turn sharply colder, and that’s enough to keep volatility alive—especially when the market is already perched above $4 and reacting to every model update.

EIA’s winter framing: colder December assumptions and storage implications

The U.S. Energy Information Administration’s latest Short-Term Energy Outlook (released Dec. 9) underscored how strongly early December cold can re-shape expectations:

  • EIA forecast Henry Hub spot prices averaging around $4.30/MMBtu over the winter heating season (Nov–Mar), about 22% higher than last winter. [11]
  • Using NOAA data, EIA assumed December heating degree days (HDDs) about 8% above the 10‑year average, and said it lifted its estimate of gas used for space heating—raising December residential/commercial consumption expectations versus the prior month’s outlook. [12]
  • EIA also projected December inventory withdrawals of ~580 Bcf, materially above the typical five-year average for the month, and forecast end-of-winter stocks around 2,000 Bcf. [13]

Even if the next 7 days skew warmer for much of the country, these longer heating-season assumptions help explain why prices can stay elevated—and why rallies can return fast if colder risks reassert themselves in January and February.


Storage: the latest EIA report and why the next one matters even more

Because natural gas is seasonal and storage-dependent, the weekly storage report remains a central “gravity point” for pricing—even when holiday schedules disrupt the normal rhythm.

The latest EIA Weekly Natural Gas Storage Report available today shows:

  • Working gas in storage: 3,579 Bcf (Lower 48) as of Friday, Dec. 12, 2025
  • Weekly change: -167 Bcf
  • Stocks were 61 Bcf below the year-ago level and 32 Bcf above the five-year average (3,547 Bcf)
  • EIA noted inventories were within the five-year historical range [14]

Holiday schedule: next release date shifts the calendar

EIA’s storage page lists the next release as December 29, 2025, rather than the typical Thursday cadence. [15]
A market note also flagged that the storage report timing was rescheduled because of the Christmas holiday. [16]

For traders, that matters because weather volatility doesn’t pause for holidays—but some of the most market-moving confirmation data does. That mismatch can magnify price swings.


LNG and global headlines: Petronas–CNOOC deal highlights long-term demand signals

Beyond daily price moves, one of today’s most important structural developments is in LNG contracting.

On Dec. 24, Malaysia’s state energy firm Petronas announced it will supply 1 million metric tons per annum of LNG to CNOOC Gas and Power Singapore Trading & Marketing, deepening an existing relationship between the companies. [17]

Why this matters for “natural gas today,” not just LNG watchers:

  1. Long-term LNG contracting reduces spot-market exposure, but it also reinforces that Asian buyers are still willing to lock in supply.
  2. When long-term volumes are spoken for, the remaining “flex” supply can tighten quickly during cold snaps or outages—raising sensitivity for both Europe and the U.S.
  3. LNG deals are a reminder that U.S. Henry Hub is no longer merely a domestic story; it’s part of a connected global gas system.

Texas reliability focus: inspections and in-state storage levels in the spotlight

Another Dec. 24 development hits the reliability question directly.

Texas regulators said they are stepping up winter gas inspections, continuing post-Uri weatherization oversight into the 2025–26 cold season. The same update noted Texas working gas in storage reached 524.9 Bcf as of Nov. 30, 2025, described as the highest recorded in more than 25 years. [18]

For price-sensitive readers, the key point is not simply “more inspections,” but what it implies:

  • Texas remains a critical node for production, intrastate pipelines, power burn, and LNG feedgas.
  • Reliability measures and local storage buffers can reduce the odds of extreme dislocations during cold spells—though they do not eliminate them.

Forecasts into 2026: higher prices, higher exports, and production growth expectations

Forecasts published or reiterated today point to a market still wrestling with competing forces:

EIA: production growth moderates prices, but the baseline stays elevated

In its December STEO natural gas section, EIA said rising production is expected to moderate prices next year, while still forecasting:

  • U.S. dry gas production averaging ~109 Bcf/d in 2026 (about 1% higher than 2025 in that forecast) [19]
  • Henry Hub spot prices averaging almost $4.50/MMBtu in 4Q26 (notably described as down 5% from the prior month’s forecast) [20]

Consumer-facing outlook: natural gas prices expected higher in 2026

An energy-cost outlook published today pointed to natural gas prices rising in 2026, citing a combination of stagnant domestic production and increasing U.S. exports, with an estimate of about a 16% rise in 2026. [21]

The most practical takeaway: even if daily futures swing on short-term weather, the forward-looking consensus still assumes a structurally tighter market than the ultra-cheap gas era, largely because exports (especially LNG) keep expanding the demand base tied—directly or indirectly—to Henry Hub.


What to watch next: the short list that could move prices fast

Heading out of Christmas Eve, these are the biggest catalysts traders and consumers will track:

  1. Weather model shifts after the holiday
    National demand can look soft while regional cold spikes—especially in the Northeast, Midcontinent, and Texas—re-price the curve quickly. [22]
  2. EIA storage report timing and the next print
    With the next EIA storage release moved to Dec. 29, the next data point may carry extra weight if weather volatility persists. [23]
  3. LNG contracting and export economics
    New long-term supply agreements—like the Petronas–CNOOC deal—highlight demand durability and reinforce the globalization of gas pricing dynamics. [24]
  4. Reliability and infrastructure readiness
    Texas’ inspection push and storage levels signal preparation, but cold-weather performance remains a real-time test each winter. [25]

Bottom line for Dec. 24, 2025

Natural gas is closing Christmas Eve with U.S. prices easing to about $4.25/MMBtu, while European benchmarks are slightly higher, and the market narrative remains weather-first, data-scheduled-second, LNG-always. [26]

If you want, I can also tailor this article for a specific geography and audience (U.S. retail consumers vs. European industrial buyers vs. traders) while keeping it Google News/Discover-ready—without changing any of the core facts above.

References

1. www.investing.com, 2. tradingeconomics.com, 3. www.barchart.com, 4. www.investing.com, 5. tradingeconomics.com, 6. www.investing.com, 7. www.investing.com, 8. natgasweather.com, 9. www.ctinsider.com, 10. www.chron.com, 11. www.eia.gov, 12. www.eia.gov, 13. www.eia.gov, 14. ir.eia.gov, 15. ir.eia.gov, 16. www.barchart.com, 17. www.reuters.com, 18. www.mrt.com, 19. www.eia.gov, 20. www.eia.gov, 21. www.investopedia.com, 22. www.ctinsider.com, 23. ir.eia.gov, 24. www.reuters.com, 25. www.mrt.com, 26. www.investing.com


Source link

25 12, 2025

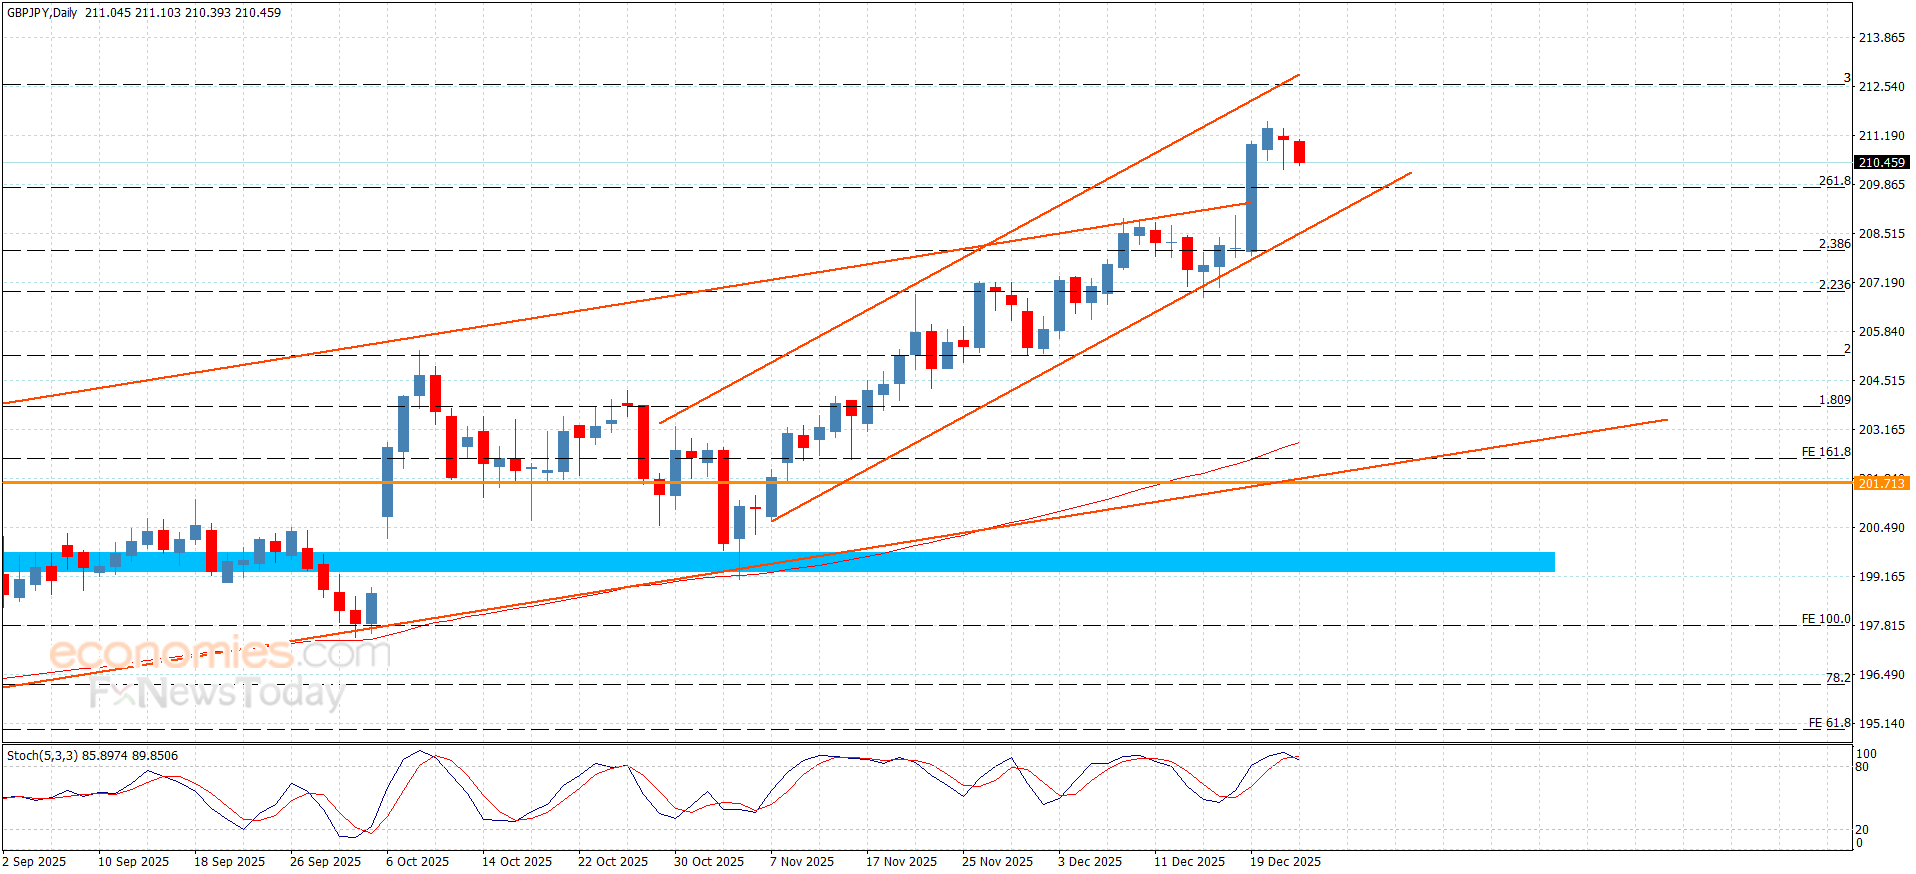
The GBPJPY repeats the corrective attempts– Forecast today – 24-12-2025

By |2025-12-25T04:05:30+02:00December 25, 2025|Forex News, News|0 Comments


Copper price activated with the main indicators again, surpassing the barrier at $5.5000, announcing its readiness to achieve extra gains on a near-term basis, therefore, we will keep our bullish expectations, reminding you that the extra target near $5.6300 and $5.7400 level.


Note that the price stability below the current barrier might force it to form mixed trading, and there is a chance of testing the support at $5.1500.


The expected trading range for today is between $5.3900 and $5.6300


Trend forecast: Bullish


Source link

25 12, 2025

XAG/USD Holds Near $72 After Record High as Forecasts Eye $75—and Beyond

By |2025-12-25T02:04:35+02:00December 25, 2025|Forex News, News|0 Comments


December 24, 2025 (Updated 5:01) — Silver prices are in sharp focus today after a historic run pushed the metal into fresh record territory. In global markets, spot silver hit an all-time high of $72.70 per ounce before easing slightly as traders locked in profits during holiday-thinned trade. Reuters last cited silver around $71.94/oz, still up about 0.7% on the day. [1]

That pullback doesn’t change the bigger picture: silver’s 2025 rally has been extraordinary. Reuters pegged silver’s year-to-date gain around 149%, highlighting how the “white metal” has outpaced gold’s rise this year. [2]

Below is what’s driving silver today (24.12.2025), what analysts and market watchers are saying, and the key levels traders are watching next.


Silver price today: where XAG/USD stands on December 24, 2025

Silver’s breakout has become the defining precious-metals story into year-end:

  • Record high: $72.70/oz (spot) [3]
  • Latest widely reported spot level: about $71.94/oz (Reuters) [4]
  • Intraday guide (spot chart feed): around $71.88, with a day range roughly $70.20–$72.71 (XAG/USD streaming feed). [5]

The message is clear: after a nearly vertical climb, silver is trying to consolidate, not collapse—yet the swings are getting bigger, and that cuts both ways for anyone trading it short-term.


Why silver is moving: the 4 biggest drivers behind today’s price action

1) Rate-cut expectations are doing the heavy lifting

Precious metals tend to benefit when markets expect lower interest rates—because lower yields reduce the opportunity cost of holding non-yielding assets like gold and silver.

Reuters pointed to a market backdrop where:

  • The U.S. central bank cut rates three times in 2025, and
  • Traders were pricing in two more cuts next year. [6]

That rate outlook has been reinforced by macro signals and investor positioning into year-end.

2) The U.S. dollar and yields are key “silent” catalysts

On a day when U.S. yields eased and the dollar’s tone remained an important macro input, precious metals stayed supported even as they cooled off from highs. Reuters described Treasury yields easing and noted that gold and silver “edged back from record levels.” [7]

In plain terms: silver didn’t need new buyers to keep levitating—it just needed the macro headwinds (yields/dollar) to stay contained.

3) Geopolitical headlines still matter

Safe-haven demand rarely has a single trigger, but it often builds when investors sense rising geopolitical risk. Reuters highlighted a geopolitical strand in today’s broader market narrative, including attention on a Venezuela-linked oil tanker situation involving the U.S. Coast Guard. [8]

Even when headlines don’t directly involve metals, they can keep risk premiums alive—especially late in the year.

4) Holiday liquidity is amplifying every move

One underappreciated force today: thin year-end volume. Investing.com’s analysis explicitly warned that holiday conditions can exaggerate volatility, pushing prices to extremes more easily than during normal liquidity. [9]

That helps explain why silver can spike to a new record and then fade—without a major change in fundamentals.


India check: domestic silver hits fresh records, too

Silver’s surge isn’t just a dollar story.

In India, The Times of India reported silver prices jumping to a fresh record in the national capital, with silver hitting ₹2,27,000 per kilogram in Delhi, citing the All India Sarafa Association. [10]

Meanwhile, The Economic Times tied the global move directly to Indian market action:

  • It noted silver moving above $72/oz,
  • Said MCX silver touched a new all-time high near ₹2,20,490/kg, and
  • Highlighted industrial demand themes (including solar/EVs/electronics), supply constraints, and expectations of looser U.S. policy as drivers. [11]

The rally even spilled into equities: The Economic Times reported Hindustan Zinc shares rising after silver crossed $72/oz, pointing to the company’s leverage to silver prices. [12]


Technical outlook: “price discovery” meets overbought warnings

Silver’s chart is flashing two truths at once:

  1. The trend is powerful, and
  2. The move is stretched enough to punish late entries.

FXEmpire: record high, but fatigue risk is rising

FXEmpire’s December 24 analysis captured the mood: silver set a fresh record at $72.70 but struggled to hold the top as traders paused into the holiday break. [13]

Crucially, FXEmpire warned the rally looked stretched: silver was cited as about $17.81 above its 50‑day moving average, raising the odds of a near-term pullback even if the bigger trend remains bullish. [14]

Investing.com: profit-taking risk and an intraday “sell zone”

Investing.com’s analysis went further, describing the environment as highly volatile and emphasizing intraday discipline. It flagged the $72.70–$72.80 area as an “intraday sell zone” with a stop above $73.50, while pointing to downside targets around $71.30, $71.00, and $70.00 if profit booking accelerates. [15]

Whether you agree with that trade setup or not, it underlines a widely shared view: the market is increasingly sensitive to profit-taking at record highs.

Barchart: strong buy trend—but RSI overbought, watch key levels

Barchart’s technical snapshot shows how “hot” this move has become:

  • Technical opinion: Strong buy, with long-term indicators supporting the trend
  • Relative Strength above 80, explicitly warning the market is in “extreme overbought territory” and to beware reversal risk [16]

Barchart also mapped clear reference levels traders may use as pivots:

  • Resistance: ~72.41, 73.34, 75.11
  • Support: ~69.71, 67.95, 67.02
  • Last price reference: ~71.91 [17]

These aren’t predictions—they’re decision points. In a market this fast, those levels can shape where stops cluster and where liquidity shows up.


Forecasts and targets: where analysts see silver heading next

Silver’s surge has kicked forecasting into a higher gear, especially because the market is now operating in “price discovery” mode.

Near-term target: $75 by year-end (Kitco via Reuters)

In Reuters’ reporting, Kitco Metals senior analyst Jim Wyckoff said the next upside target for silver is $75/oz by the end of the year, adding that the technicals remain bullish. [18]

That’s an ambitious target—but it’s also close enough that traders will treat it as a magnet level if momentum returns.

2026 outlook: banks at $56–$65, but technical models stretch higher

For the bigger horizon, IG’s commodities outlook (published Dec. 23 and circulating into today’s Dec. 24 conversation) summarized the next year’s debate:

  • It said the average of major banks places silver in the $56–$65 range for 2026 (a “conservative view”).
  • It also noted technical models that stretch toward $72 and $88, especially if the gold/silver ratio compresses further. [19]

IG also emphasized the structural backdrop supporting silver—tightening supply, rising industrial demand, and a breakout setup—and argued silver is still “cheap relative to gold” when viewed through the gold/silver ratio lens. [20]

One important nuance: these aren’t unanimous views. The same volatility that powered the upside can create sharp drawdowns—particularly if rate expectations shift or if positioning becomes crowded.


What to watch next: the catalysts that can move silver fast

With silver at record levels, it may not take much to trigger the next big leg—or the next sharp shakeout. Key items to watch:

  1. U.S. rates narrative: any change in how markets price 2026 rate cuts can quickly lift or cap precious metals. [21]
  2. Dollar and yields: a renewed dollar rally or a spike in real yields can pressure silver even if industrial fundamentals remain strong. [22]
  3. Holiday liquidity conditions: thin volumes can exaggerate both breakouts and pullbacks. [23]
  4. Profit-taking behavior: multiple analysts explicitly warn that extended rallies at “lifetime highs” often invite heavy profit booking. [24]
  5. Industrial-demand headlines: solar and electrification themes are increasingly part of the silver narrative, especially in coverage linking silver’s move to producer equities and MCX pricing. [25]

Bottom line at 5:01: silver’s trend is bullish, but the market is “stretched”

Silver’s price action on December 24, 2025 is the classic late-stage momentum setup: still trending higher, still supported by rates and risk narratives, but stretched enough to snap back hard.

  • The record high ($72.70/oz) is now the headline reference point. [26]
  • Analysts are openly discussing $75/oz as a near-term target, while longer-range outlooks debate whether 2026 is a consolidation year—or another breakout year. [27]
  • Overbought signals and profit-taking risk are rising, especially in thin liquidity. [28]

Market note: Prices can change quickly, especially around holidays. The levels above reflect figures and commentary reported on 24.12.2025 by the cited sources, not a fixed quote.

References

1. www.reuters.com, 2. www.reuters.com, 3. www.reuters.com, 4. www.reuters.com, 5. www.investing.com, 6. www.reuters.com, 7. www.reuters.com, 8. www.reuters.com, 9. www.investing.com, 10. timesofindia.indiatimes.com, 11. m.economictimes.com, 12. m.economictimes.com, 13. www.fxempire.com, 14. www.fxempire.com, 15. www.investing.com, 16. www.barchart.com, 17. www.barchart.com, 18. www.reuters.com, 19. www.ig.com, 20. www.ig.com, 21. www.reuters.com, 22. www.reuters.com, 23. www.investing.com, 24. www.fxempire.com, 25. m.economictimes.com, 26. www.reuters.com, 27. www.reuters.com, 28. www.barchart.com


Source link

25 12, 2025

Dollar Tree price seeks a supportive bottom – Forecast today

By |2025-12-25T00:03:32+02:00December 25, 2025|Forex News, News|0 Comments


Coca-Cola Company (KO) declined in its latest intraday trading, breaking below its 50-day SMA, which has increased near-term negative pressure on the stock. This move comes alongside the emergence of a negative crossover on the RSI, reinforcing short-term weakness. However, the main bullish trend still dominates the medium term, with price action continuing to move alongside a supportive upward trendline, which limits the downside risk for now.


Therefore we expect the stock price to move higher in the upcoming trading, as long as it remains stable above the support level at $68.80, to target the resistance level at $71.30.


Today’s price forecast: Neutral


Source link

24 12, 2025

XAU/USD trades below $4,500/all-time high

By |2025-12-24T22:02:40+02:00December 24, 2025|Forex News, News|0 Comments


Gold (XAU/USD) retreats slightly from a fresh all-time peak, around the $4,526 area touched earlier this Wednesday, and trades with a negative bias during the first half of the European session. The precious metal currently trades around the $4,485 region, down 0.25% for the day, though the downside seems limited amid a supportive fundamental backdrop.

Dovish US Federal Reserve (Fed) expectations might keep a lid on the US Dollar’s (USD) modest intraday bounce from its lowest level since early October and act as a tailwind for the non-yielding Gold. Apart from this, rising geopolitical uncertainties could benefit the safe-haven bullion and contribute to limiting the downside, warranting caution for aggressive bearish traders.

The Relative Strength Index (RSI) is flashing extremely overbought conditions on the daily chart. This, in turn, prompts some profit-taking around the XAU/USD, especially after the latest leg up to a series of new record highs since the beginning of this week. The broader technical setup, however, favors bullish traders and backs the case for the emergence of some dip-buyers around the Gold.

An ascending channel guides the uptrend, with price stretching above its upper boundary near $4,430.50. The 50-day Simple Moving Average (SMA) rises steadily, and the XAU/USD holds above it, reinforcing a bullish tone. The Moving Average Convergence Divergence (MACD) line stands above the Signal line in positive territory, and the widening histogram suggests strengthening momentum.

With the XAU/USD holding above the channel cap, pullbacks would be cushioned by the 50-day SMA at $4,167.09. As long as MACD remains above zero and its histogram stays positive, bulls would retain control. RSI remains elevated, highlighting stretched conditions, yet the broader trend stays higher while the price holds over dynamic support. Hence, a pause would not derail the uptrend.

(The technical analysis of this story was written with the help of an AI tool)

XAU/USD daily chart

Fed FAQs

Monetary policy in the US is shaped by the Federal Reserve (Fed). The Fed has two mandates: to achieve price stability and foster full employment. Its primary tool to achieve these goals is by adjusting interest rates.
When prices are rising too quickly and inflation is above the Fed’s 2% target, it raises interest rates, increasing borrowing costs throughout the economy. This results in a stronger US Dollar (USD) as it makes the US a more attractive place for international investors to park their money.
When inflation falls below 2% or the Unemployment Rate is too high, the Fed may lower interest rates to encourage borrowing, which weighs on the Greenback.

The Federal Reserve (Fed) holds eight policy meetings a year, where the Federal Open Market Committee (FOMC) assesses economic conditions and makes monetary policy decisions.
The FOMC is attended by twelve Fed officials – the seven members of the Board of Governors, the president of the Federal Reserve Bank of New York, and four of the remaining eleven regional Reserve Bank presidents, who serve one-year terms on a rotating basis.

In extreme situations, the Federal Reserve may resort to a policy named Quantitative Easing (QE). QE is the process by which the Fed substantially increases the flow of credit in a stuck financial system.
It is a non-standard policy measure used during crises or when inflation is extremely low. It was the Fed’s weapon of choice during the Great Financial Crisis in 2008. It involves the Fed printing more Dollars and using them to buy high grade bonds from financial institutions. QE usually weakens the US Dollar.

Quantitative tightening (QT) is the reverse process of QE, whereby the Federal Reserve stops buying bonds from financial institutions and does not reinvest the principal from the bonds it holds maturing, to purchase new bonds. It is usually positive for the value of the US Dollar.


Source link

24 12, 2025

NYMEX Slips Near $4.29 as Weather and LNG Signals Collide

By |2025-12-24T20:01:36+02:00December 24, 2025|Forex News, News|0 Comments


NEW YORK/LONDON/SINGAPORE — Dec. 24, 2025 — U.S. natural gas futures were softer in holiday-thinned Christmas Eve trading, giving back part of Tuesday’s sharp rebound as traders reassessed near-term weather forecasts, the durability of record LNG-driven demand, and the winter storage trajectory.

By late morning, NYMEX Henry Hub natural gas futures were trading around $4.29 per MMBtu, down from the prior close near $4.41, with prices moving inside a session range roughly spanning the low-$4.20s to the mid-$4.50s. [1]

That pullback comes after a dramatic “risk-on” reset earlier in the week. On Tuesday, front-month U.S. gas futures surged roughly 4% amid record-high feedgas flows to U.S. LNG export plants and expectations for higher demand in the next two weeks. [2]

Natural gas price action today: a post-rally breather in holiday trade

The story of natural gas on December 24, 2025 is less about a single headline and more about the market’s tug-of-war:

  • Bullish forces: LNG exports are running exceptionally strong, and the market is still digesting a winter that began with a meaningful cold push.
  • Bearish forces: Weather models have been prone to whiplash; even small shifts warmer can quickly reduce heating demand expectations—especially when trading liquidity is thin around the holidays.

The result: volatile, sometimes abrupt swings that can look outsized relative to the fundamental change on any one update—particularly in a shortened, lightly staffed session.

The big driver: weather forecasts are still the steering wheel

Weather remains the primary near-term catalyst because it changes residential and commercial heating demand faster than production can respond.

Recent industry tracking shows demand has already eased from early-December highs, with heating degree days (HDDs) down week-over-week in the latest readings—one reason futures have struggled to hold the most aggressive winter premium. [3]

At the same time, the U.S. government’s baseline forecast still leans firm for the winter as a whole. In its latest Short-Term Energy Outlook (released Dec. 9), the U.S. Energy Information Administration (EIA) raised its winter view and now expects the Henry Hub spot price to average around $4.30/MMBtu this winter (Nov–Mar), citing colder-than-expected December conditions. [4]

The EIA also notes it is assuming December HDDs are 8% above the 10-year average, a meaningful demand tailwind—though it also expects milder-than-normal weather in early 2026 to help cool prices after winter. [5]

LNG exports: the strongest pillar under U.S. prices, but not without limits

The modern U.S. gas market increasingly trades like a hybrid of domestic utility fuel and global seaborne commodity—and LNG is the bridge.

On Tuesday, Reuters-reported market coverage highlighted record flows to LNG export plants, with average feedgas flows to major facilities rising to about 18.5 Bcf/d so far this month, above the prior monthly record. [6]

EIA’s weekly market update underscores just how large the LNG channel has become: in the week ending Dec. 17, 33 LNG vessels departed U.S. ports with a combined capacity of about 126 Bcf. [7]

The risk traders are watching: shrinking LNG margins

Even with strong flows today, the market is increasingly focused on whether U.S. LNG economics remain compelling if domestic gas prices rise while global benchmark prices soften.

Reuters analysis earlier this month described a margin squeeze: Henry Hub prices have risen while European and Asian prices eased, narrowing the spread that supports U.S. LNG profitability. [8]

For now, LNG demand is still acting as a stabilizer for U.S. prices. But this margin discussion is important because it frames the key “next-level” risk: if the spread compresses far enough, exports become the release valve.

Storage: withdrawals are above normal, and the winter balance matters

Storage is the market’s scoreboard in winter. The latest EIA weekly update (covering the report week ending Dec. 17) showed:

  • Net withdrawals of 167 Bcf for the week ending Dec. 12, well above the five-year average withdrawal for that week.
  • Working gas inventories of 3,579 Bcf, slightly above the five-year average, but below year-ago levels. [9]

The EIA’s broader winter outlook expects December to be a heavy withdrawal month. It forecasts 580 Bcf withdrawn during December, about 28% above the five-year average for the month, and projects end-of-winter storage near 2,000 Bcf (about 9% above the five-year average). [10]

This is why even modest shifts in temperature guidance can move prices sharply: storage draws compound quickly during cold spells, and futures reprice the end-of-winter level in real time.

Production and rigs: supply is strong, but winter can still bite

Record or near-record production has been the market’s counterweight to winter weather risk.

One reason the supply story still looks resilient: U.S. drillers have not meaningfully pulled back activity in a way that would suggest imminent supply stress. In Baker Hughes’ holiday-adjusted rig count update, U.S. firms held gas rigs around 127, with total oil-and-gas rigs rising slightly week-over-week (though still down year-over-year). [11]

The EIA also expects U.S. output to remain high into next year: it projects dry natural gas production averaging about 109 Bcf/d in 2026, up from 2025 levels. [12]

That said, winter is the season when production can still surprise to the downside due to freeze-offs and operational interruptions—so the market continues to price some risk premium.

Europe today: TTF eases as colder risks moderate

Across the Atlantic, European gas pricing remains sensitive to weather, storage levels, and LNG arrivals—especially with the region still navigating the post-Russian pipeline era.

On Dec. 24, Europe’s benchmark Dutch TTF front-month eased to around €27.36/MWh (about $9.47/MMBtu) by mid-morning London time, as forecasts suggested a potentially quicker end to a cold spell and supply stayed stable. [13]

While Europe’s price level remains far above the ultra-cheap periods of the pre-2022 era, the market has become more two-sided: warm forecasts can soften prices quickly, while cold snaps still have the power to ignite rapid rallies.

The structural backdrop: policy shifts continue

Europe’s long-run gas architecture is also being reshaped by regulation. Reuters reported the European Parliament approved the EU plan to phase out Russian gas imports by late 2027, pushing the bloc toward longer-term reliance on LNG and alternative pipeline sources. [14]

Asia today: spot LNG edges up with South Korea demand in focus

In Asia, spot LNG prices have been supported by incremental winter buying, particularly where cold weather looks imminent.

A financial-market report citing Argus noted that South Korean buying interest emerged with temperatures expected to fall to two-year lows on Dec. 26, and that cargoes have been diverted from China to South Korea in recent weeks. [15]

This matters for U.S. gas because Asia is a major sink for Atlantic Basin LNG when economics work—supporting feedgas demand back in the United States.

Today’s LNG headline: Petronas signs new supply deal with China’s CNOOC

One of the most consequential “quiet” forces in gas markets is the steady accumulation of long-term LNG contracts—the contractual plumbing that underwrites new liquefaction capacity.

On Dec. 24, Reuters reported Malaysia’s Petronas signed an agreement to supply 1 million metric tons per annum of LNG to CNOOC Gas and Power in Singapore, deepening an existing relationship. [16]

Deals like this don’t usually move Henry Hub futures minute-by-minute, but they reinforce the macro reality: LNG remains a structural growth channel, even as short-term weather dominates the daily tape.

Natural gas forecast and outlook: what the market is pricing into early 2026

Putting today’s cross-currents together, the clearest near-term framework looks like this:

Base case: choppy but supported

  • Prices stay volatile into year-end due to thin holiday liquidity and frequent weather model revisions.
  • Strong LNG flows help put a floor under dips, unless global spreads compress sharply.

Bull case: sustained cold plus big draws

  • If colder-than-normal weather persists longer than expected, storage withdrawals can accelerate—consistent with the EIA’s view that December is already running cold relative to assumptions. [17]

Bear case: a warm turn plus strong production

  • If forecasts shift meaningfully warmer into early January, heating demand falls fast.
  • With production strong and rigs steady, the market can quickly shed winter risk premium. [18]

The 2026 anchor

EIA expects Henry Hub to moderate after winter with milder early-2026 weather and rising production, averaging around $4.00/MMBtu next year in its baseline outlook. [19]

What to watch next

Natural gas traders and energy consumers are likely to keep a close eye on:

  1. Weather model trends (especially late-December and early-January HDD forecasts). [20]
  2. Weekly storage dynamics and whether withdrawals remain above normal. [21]
  3. LNG feedgas flows and any terminal disruptions, given LNG’s outsized role in demand. [22]
  4. Global LNG contract news that signals longer-term demand growth (e.g., Petronas–CNOOC). [23]
  5. Policy and supply-chain developments that change global balances, such as Europe’s Russian gas phase-out timetable and other LNG-related regulation. [24]

If you want, I can tailor this same Dec. 24, 2025 update into (1) a shorter Google Discover-style “tight read” (400–600 words) or (2) a longer newsroom feature (1,800–2,200 words) while keeping it fully source-grounded and SEO-focused.

References

1. www.investing.com, 2. www.bairdmaritime.com, 3. www.aga.org, 4. www.eia.gov, 5. www.eia.gov, 6. www.bairdmaritime.com, 7. www.eia.gov, 8. www.reuters.com, 9. www.eia.gov, 10. www.eia.gov, 11. www.reuters.com, 12. www.eia.gov, 13. www.hellenicshippingnews.com, 14. www.reuters.com, 15. www.lse.co.uk, 16. www.reuters.com, 17. www.eia.gov, 18. www.reuters.com, 19. www.eia.gov, 20. www.aga.org, 21. www.eia.gov, 22. www.eia.gov, 23. www.reuters.com, 24. www.reuters.com


Source link

24 12, 2025

gold silver copper price prediction forecast: Why gold, silver, and copper are all surging together — here’s the 2026 price prediction and forecast

By |2025-12-24T18:00:32+02:00December 24, 2025|Forex News, News|0 Comments


Gold, silver, and copper are rallying together in a rare, synchronized surge that is reshaping global commodity markets. As of December 24, 2025, gold trades near $4,494 per ounce, silver around $72.11 per ounce, and copper at $5.51 per pound. All three are posting their strongest annual gains in decades. Gold is up more than 70% year to date. Silver has surged over 140%, its best performance since the early 1980s. Copper has climbed roughly 36%, marking its biggest annual rise since 2009. This rally is not driven by speculation alone. It reflects deep structural forces reshaping the global economy. Investors are rushing toward metals as inflation risks linger, interest rates trend lower, and geopolitical uncertainty remains high. At the same time, copper and silver are benefiting from a massive industrial demand wave tied to artificial intelligence, electric vehicles, renewable energy, and grid expansion.

The U.S. dollar is weakening at its fastest pace in years, boosting commodity prices worldwide. Central banks are aggressively accumulating gold to reduce reliance on dollar reserves. Supply disruptions, tariffs, and underinvestment in mining have tightened markets just as demand accelerates. Together, these forces explain why precious and industrial metals are rising in unison — and why the rally may not be over yet.

Why gold prices are hitting record highs in 2025

Gold’s rally is rooted in macroeconomic stress and policy shifts. The metal briefly touched $4,525 per ounce, a fresh all-time high, before consolidating near current levels. Monthly gains are nearing 9%, driven by expectations that the Federal Reserve will begin cutting interest rates in 2026.

Lower rates reduce the opportunity cost of holding gold, which pays no yield. At the same time, inflation concerns and rising government debt are fueling what traders call the “debasement trade.” A weaker U.S. Dollar has made gold cheaper for overseas buyers, amplifying global demand.

Central banks are another powerful force. Many have accelerated gold purchases to diversify reserves and hedge against financial instability. Analysts now project gold could dip modestly toward $4,350 near quarter-end before climbing toward $4,600 over the next 12 months, supported by sustained official-sector buying.

Why silver is outperforming gold this year

Silver’s surge is even more dramatic. Prices briefly topped $72.70 per ounce, and despite minor pullbacks, the metal remains up over 140% in 2025. Unlike gold, silver plays a dual role as both a safe-haven asset and a critical industrial material.

Demand from solar panel manufacturing, electric vehicles, and data centers has exploded. Each new energy or AI project consumes silver permanently, tightening supply. Monthly gains near 40% reflect how quickly inventories are being absorbed. With silver now classified as a strategic and critical mineral in several countries, analysts see prices holding above $70 into 2026, with forecasts pushing toward the mid-$70s.

Why copper demand is exploding from EVs, AI, and infrastructure

Copper’s rally tells the story of the energy transition. Prices are approaching $12,000 per metric ton, driven by soaring demand from electric vehicles, artificial intelligence data centers, and power grid expansion. A single electric vehicle can use up to four times more copper than a traditional gasoline car.

According to Goldman Sachs, grid expansion and power infrastructure could account for more than 60% of copper demand growth by 2030. Supply, however, is struggling to keep pace. Mining disruptions in Chile and Peru have constrained output, while new projects face long approval timelines.

Adding to the pressure, U.S. trade policy has reshaped the market. A 50% tariff on imported copper products triggered stockpiling and hoarding. J.P. Morgan expects tight supply conditions to persist well into 2026.

What futures markets are signaling about metals prices next

Looking ahead to 2026, analysts broadly expect gold, silver, and copper prices to stay elevated, with volatility driven by interest rates, global growth, and supply constraints. Forecasts suggest the metals rally is shifting from a momentum-driven surge to a structurally supported cycle. Gold price forecast for 2026
Gold is expected to remain well above historical averages. Most bank and commodities desk models see gold trading in a $4,300–$4,900 per ounce range through 2026. Central bank buying remains the anchor. If the Federal Reserve begins rate cuts, real yields could fall further, supporting upside risk toward the upper end of forecasts. Downside risk appears limited unless inflation cools sharply and the dollar strengthens materially.

Silver price forecast for 2026
Silver forecasts are more aggressive due to tight supply and industrial demand. Analysts project an average range of $68–$78 per ounce, with volatility likely. Solar installations, EV production, and data center expansion continue to absorb supply faster than mining output grows. Silver’s dual role as an investment metal and industrial input keeps it highly sensitive to both rate policy and global manufacturing trends.

Copper price forecast for 2026
Copper outlooks remain bullish but uneven. Consensus estimates place copper between $5.40 and $6.10 per pound, with some upside scenarios tied to grid expansion and AI infrastructure. Electric vehicles, renewable energy, and transmission upgrades drive demand, while mine supply growth remains constrained. Trade barriers and inventory rebuilding could keep prices near cycle highs.

Gold is expected to stabilize at historically high levels. Silver may remain the most volatile, with sharp rallies on demand shocks. Copper prices are likely to stay supported by long-term electrification trends. Together, forecasts suggest metals will remain a key inflation and growth hedge throughout 2026, rather than reverting to pre-2024 norms.


Source link

24 12, 2025

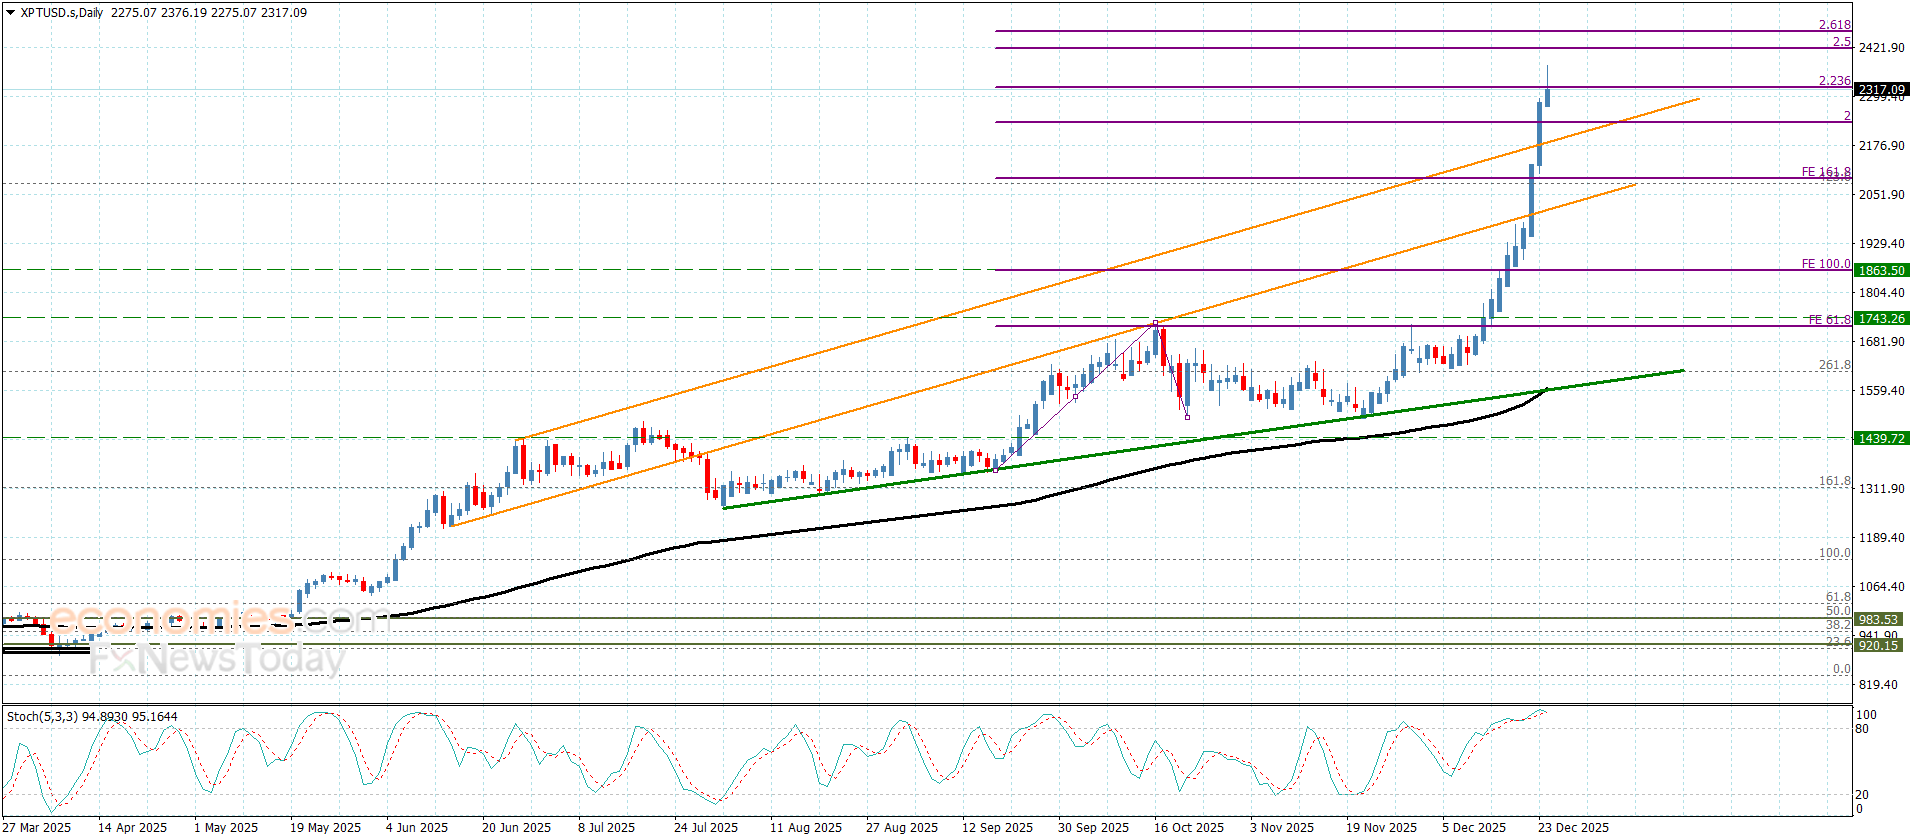
Platinum price keeps recording historical gains– Forecast today – 24-12-2025

By |2025-12-24T15:59:34+02:00December 24, 2025|Forex News, News|0 Comments


Copper price activated with the main indicators again, surpassing the barrier at $5.5000, announcing its readiness to achieve extra gains on a near-term basis, therefore, we will keep our bullish expectations, reminding you that the extra target near $5.6300 and $5.7400 level.


Note that the price stability below the current barrier might force it to form mixed trading, and there is a chance of testing the support at $5.1500.


The expected trading range for today is between $5.3900 and $5.6300


Trend forecast: Bullish


Source link

24 12, 2025

XAG/USD extends bull run to near $72.70 as Fed dovish bets remain steady

By |2025-12-24T13:58:33+02:00December 24, 2025|Forex News, News|0 Comments


Silver price (XAG/USD) rallies further to near $72.70 during the early European trading session on Wednesday. The white metal extends its bull run as Federal Reserve (Fed) dovish expectations for 2026 remain broadly firm, even as the United States (US) Q3 Gross Domestic Product (GDP) came in surprisingly higher.

According to the CME FedWatch tool, traders see a 70.6% that the Fed will reduce interest rates by at least 50 bps in 2026, signaling a higher scope of interest rate cuts than the Fed’s projections in its dot plot last week. The Fed’s dot plot showed that policymakers collectively see the Federal Funds Rate heading to 3.4% by the end of 2026, indicating that there won’t be more than one interest rate cut.

Theoretically, lower interest rates by the Fed bode well for non-yielding assets, such as Silver.

On Tuesday, the US GDP data showed that the economy grew at a robust pace of 4.3% year-on-year (YoY). Economists expect the US GDP growth to come in lower at 3.3% from 3.8% recorded in the second quarter of the year.

In Wednesday’s session, investors will focus on Initial Jobless Claims data, which will be published at 13:30 GMT. Individuals claiming jobless benefits for the first time are expected to have remained steady at 223K.

Silver technical analysis

In the daily chart, XAG/USD trades at $72.19. The 20-day exponential moving average is ascending, and price holds well above it, reinforcing a firm bullish bias. The average’s positive slope continues to support the advance. RSI (14) at 80.95 is overbought, signaling stretched momentum that could precede consolidation.

Should momentum cool, pullbacks could find support at the 20-day EMA around $63.07. The uptrend would remain intact while above this dynamic floor, whereas a loss of that level would expose a deeper retracement as overbought conditions unwind.

(The technical analysis of this story was written with the help of an AI tool.)

Silver FAQs

Silver is a precious metal highly traded among investors. It has been historically used as a store of value and a medium of exchange. Although less popular than Gold, traders may turn to Silver to diversify their investment portfolio, for its intrinsic value or as a potential hedge during high-inflation periods. Investors can buy physical Silver, in coins or in bars, or trade it through vehicles such as Exchange Traded Funds, which track its price on international markets.

Silver prices can move due to a wide range of factors. Geopolitical instability or fears of a deep recession can make Silver price escalate due to its safe-haven status, although to a lesser extent than Gold’s. As a yieldless asset, Silver tends to rise with lower interest rates. Its moves also depend on how the US Dollar (USD) behaves as the asset is priced in dollars (XAG/USD). A strong Dollar tends to keep the price of Silver at bay, whereas a weaker Dollar is likely to propel prices up. Other factors such as investment demand, mining supply – Silver is much more abundant than Gold – and recycling rates can also affect prices.

Silver is widely used in industry, particularly in sectors such as electronics or solar energy, as it has one of the highest electric conductivity of all metals – more than Copper and Gold. A surge in demand can increase prices, while a decline tends to lower them. Dynamics in the US, Chinese and Indian economies can also contribute to price swings: for the US and particularly China, their big industrial sectors use Silver in various processes; in India, consumers’ demand for the precious metal for jewellery also plays a key role in setting prices.

Silver prices tend to follow Gold’s moves. When Gold prices rise, Silver typically follows suit, as their status as safe-haven assets is similar. The Gold/Silver ratio, which shows the number of ounces of Silver needed to equal the value of one ounce of Gold, may help to determine the relative valuation between both metals. Some investors may consider a high ratio as an indicator that Silver is undervalued, or Gold is overvalued. On the contrary, a low ratio might suggest that Gold is undervalued relative to Silver.


Source link

Go to Top