The main tag of Gold News Today Articles.
You can use the search box below to find what you need.
[wd_asp id=1]

29 03, 2026

XAG/USD Braces for Third Consecutive Weekly Decline as Charts Signal Caution

By |2026-03-29T23:54:31+02:00March 29, 2026|Forex News, News|0 Comments


BitcoinWorld
BitcoinWorld
Silver Price Forecast: XAG/USD Braces for Third Consecutive Weekly Decline as Charts Signal Caution

Global silver markets face mounting pressure as the XAG/USD pair prepares for its third consecutive negative weekly close, according to technical chart analysis from major financial hubs on Friday, March 14, 2025. This persistent downward movement marks one of the longest weekly losing streaks for the precious metal this year, consequently prompting renewed analysis from commodity strategists and institutional traders. The current price action reflects broader macroeconomic shifts that are influencing precious metal valuations worldwide.

Silver Price Forecast: Analyzing the Technical Breakdown

Technical charts for XAG/USD reveal a clear pattern of sustained selling pressure. The weekly chart, a crucial tool for institutional investors, shows silver failing to hold above key support levels established earlier in the quarter. Furthermore, moving averages have begun to realign in a bearish configuration, with the 50-week average converging downward toward the 200-week average. This convergence often signals a potential shift in long-term momentum. Meanwhile, daily timeframes indicate that each rally attempt has met with immediate resistance, creating a series of lower highs and lower lows—a classic technical downtrend structure.

Volume analysis provides additional context for the price movement. Notably, trading volume has expanded during down days and contracted during minor recovery attempts. This volume profile suggests stronger conviction among sellers than buyers in the current environment. Key technical indicators also support the cautious outlook:

  • Relative Strength Index (RSI): The weekly RSI remains below the 50 midline, indicating bearish momentum.
  • Moving Average Convergence Divergence (MACD): The MACD histogram shows increasing negative values on weekly charts.
  • Support Zones: Critical support near the $24.50 level has been tested multiple times this week.

Macroeconomic Drivers Behind the Precious Metal Slide

The silver market does not operate in isolation. Consequently, several interconnected economic factors are contributing to the current pressure on XAG/USD. Primarily, shifting expectations around central bank policy, particularly from the U.S. Federal Reserve, have reduced the appeal of non-yielding assets like silver. As interest rate expectations firm, the opportunity cost of holding precious metals increases for institutional portfolios. Simultaneously, the U.S. dollar index (DXY) has shown resilience, creating natural headwinds for dollar-denominated commodities.

Industrial demand considerations also play a significant role in silver’s unique dual identity as both a monetary and industrial metal. Recent manufacturing data from major economies, including Purchasing Managers’ Index (PMI) reports, have shown mixed signals. While certain technology sectors maintain steady demand for silver in components, broader industrial slowdown concerns in some regions are tempering bullish forecasts. The following table summarizes recent influential data points:

Factor Current Influence Market Impact
U.S. Treasury Yields Rising 10-year yields Negative for precious metals
Dollar Strength (DXY) Consolidating near highs Downward pressure on XAG/USD
Global PMI Data Mixed regional signals Neutral to slightly negative
ETF Holdings Moderate outflows recorded Reflective of investor caution

Expert Analysis on Market Structure and Sentiment

Market analysts from leading commodity research firms point to structural changes in trader positioning. According to recent Commitments of Traders (COT) reports published by regulatory authorities, managed money accounts have reduced their net-long positions in silver futures for four consecutive weeks. This systematic reduction in speculative interest often precedes or accompanies sustained price declines. Meanwhile, physical market premiums have remained stable in key regions like North America and Europe, suggesting that retail and industrial physical demand is absorbing some of the selling pressure from paper markets.

Historical context provides another layer of understanding. Silver has experienced similar multi-week declines approximately twelve times in the past decade. In eight of those instances, the metal found a consolidation floor within four to six weeks before establishing its next directional move. Seasonality patterns also offer insight, as the period following the first quarter has historically shown mixed performance for silver, with industrial demand cycles often dictating the medium-term trend.

Comparative Performance and Sector Implications

Silver’s performance must be evaluated relative to other asset classes. Notably, the gold-silver ratio—a closely watched metric by precious metal traders—has widened during this period. This widening indicates that silver is underperforming gold, which often occurs during risk-off periods or when industrial concerns outweigh monetary demand. The ratio’s movement suggests that silver’s industrial attributes are currently weighing more heavily on its price than its safe-haven characteristics.

The mining sector provides a real-world reflection of these price movements. Share prices for primary silver producers and diversified miners with significant silver exposure have generally underperformed broad equity indices this month. However, production cost analysis indicates that most major producers remain profitable at current price levels, reducing the immediate risk of supply contraction. This fundamental support could help establish a price floor if the decline continues.

Forward-Looking Indicators and Potential Catalysts

Several upcoming events and data releases could serve as catalysts for the next significant move in silver prices. Central bank meetings, particularly those with updated economic projections, will be scrutinized for hints about future liquidity conditions. Additionally, inflation data from major economies will influence real yield calculations, a critical driver for precious metal valuations. Geopolitical developments, which traditionally boost safe-haven demand, remain a variable that could rapidly alter market sentiment.

Technically, market participants are watching for either a decisive breakdown below the current weekly support zone or a reversal pattern that could signal exhaustion of the selling pressure. A sustained close above the recent weekly high would be the first technical indication that the downward momentum is abating. Until such signals emerge, the prevailing trend suggests caution for momentum-based traders while potentially creating accumulation opportunities for long-term value investors.

Conclusion

The silver price forecast remains cautious as XAG/USD approaches its third consecutive negative weekly close. Technical charts clearly depict a bearish momentum structure, supported by macroeconomic headwinds including dollar strength and shifting rate expectations. However, stable physical demand and production economics provide underlying support. Market participants should monitor upcoming economic data and key technical levels for signals of either trend continuation or reversal. This period of consolidation and testing may ultimately establish the foundation for silver’s next significant directional move in 2025.

FAQs

Q1: What does a third consecutive negative weekly close mean for silver?
A third weekly decline typically indicates sustained selling pressure and a shift in medium-term momentum. It often leads technical analysts to adjust their support levels and watch for potential trend acceleration or exhaustion.

Q2: How does the U.S. dollar affect XAG/USD prices?
Since silver is priced in U.S. dollars globally, a stronger dollar makes it more expensive for holders of other currencies, potentially reducing international demand and putting downward pressure on the XAG/USD pair.

Q3: Are silver mining companies affected by this price decline?
Yes, mining equity valuations generally correlate with metal prices. However, most established producers maintain healthy margins above production costs, providing some fundamental price support.

Q4: What technical level is most important to watch now?
Analysts are closely monitoring the $24.50 support zone on weekly charts. A decisive break below this level could trigger further technical selling, while holding above it might signal consolidation.

Q5: Does this decline affect physical silver investment differently than paper markets?
Physical bullion markets often show different dynamics, with premiums sometimes increasing during price declines as retail buying interest emerges, while paper futures and ETF markets may react more directly to financial flows and leverage.

This post Silver Price Forecast: XAG/USD Braces for Third Consecutive Weekly Decline as Charts Signal Caution first appeared on BitcoinWorld.


Source link

29 03, 2026

Record supply surplus pressure still present

By |2026-03-29T15:52:09+02:00March 29, 2026|Forex News, News|0 Comments


Domestic coffee prices

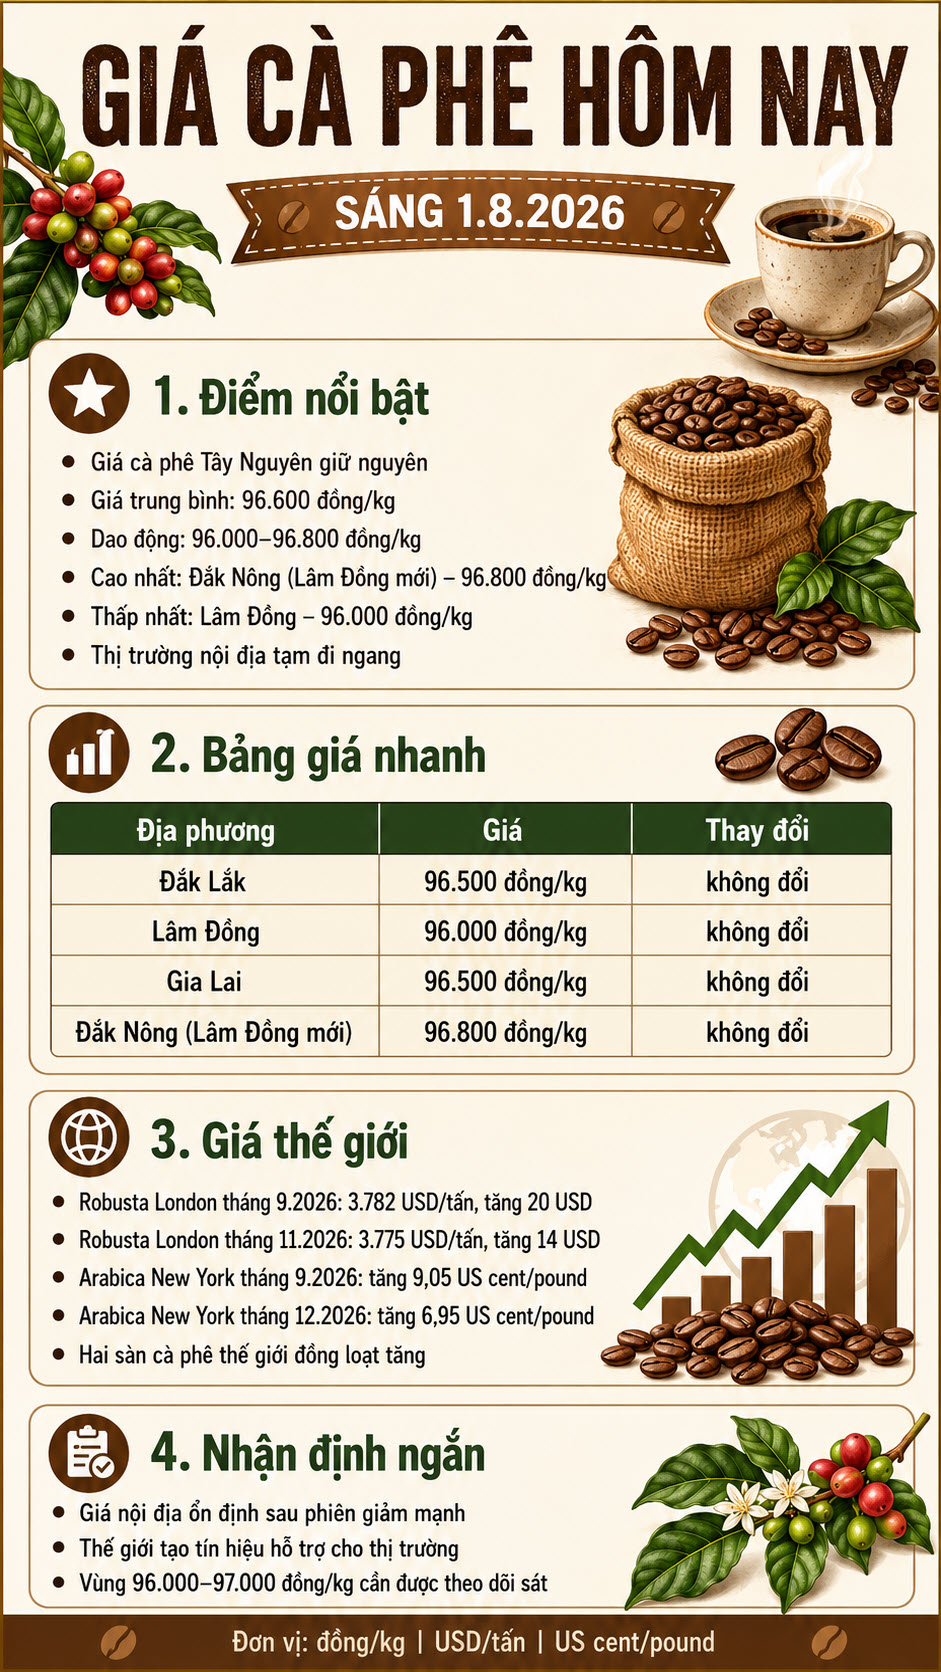
The domestic coffee market entered Sunday, March 29, with a calm state. After a slight downward adjustment of 200 VND yesterday, the purchase price in key areas of the Central Highlands is currently maintaining stability at an average of 92,400 VND/kg.

Detailed stable purchase prices in regions:

Average coffee price in ​Dak Nong (old): Neo at 92,500 VND/kg.

Average coffee prices in Dak Lak and Gia Lai: Trading stable at 92,300 VND/kg.

Average coffee price Lam Dong: Maintains a price of 91,500 VND/kg.

World coffee prices

At the end of the past trading week, the international market witnessed a significant correction as forecasting organizations continuously raised Brazil’s production estimates to new record milestones.

New York Stock Exchange (Arabica): Closing the last session of the week at 301.70 cents/lb, down sharply by 5.95 cents (-1.93%). Oversupply pressure became serious when Marex Group Plc raised its forecast for Brazil’s 2026/27 crop output to a record 75.9 million sacks (up 15.5% compared to the previous year), surpassing the 75.3 million sacks of StoneX and the 75.4 million sacks of Sucafina before that. Inventory on the ICE exchange increased to a 6-month high (585.621 sacks) is also a factor hindering the increase.

London Stock Exchange (Robusta): May 2026 delivery limit stopped at 3,593 USD/ton. Despite profit-taking pressure, Robusta’s decline was still curbed thanks to inventories on the ICE exchange continuing to fall to the lowest level in 3.25 months, leaving only 4,127 lots.

Market opinion

The coffee market is entering a period of fierce tug-of-war between supporting factors and price downward pressure.

On the supporting side, the closure of themuz Strait disrupting global maritime transport, pushing freight rates, insurance and fuel prices to skyrocket, is still an important support for prices. In addition, Brazilian farmers hoarding goods waiting for high prices and rainfall in the Minas Gerais region reaching only 45% of the historical average are also signals that help prices not fall too deeply.

Regarding pressure, the prospect of a “super bumper” crop in Brazil is overwhelming market sentiment. In addition, Vietnam’s exports in the first 2 months of the year increased by 14% (reaching 360,000 tons) and forecasts that Vietnam’s 2025/26 crop output may reach a 4-year peak (1.76 million tons) also put great pressure on the Robusta River.

It is predicted that when entering the new week, coffee prices will continue to fluctuate in the range of 91,500 – 93,500 VND/kg. Diplomatic developments aimed at reopening the Strait of Hormuz will be the “detonator” deciding the short-term direction of coffee prices.

The actual price may vary depending on each locality and the quality of the seeds.


Source link

29 03, 2026

Gold Price Today (XAU/USD): Live Price, Analysis & Forecast

By |2026-03-29T11:51:09+02:00March 29, 2026|Forex News, News|0 Comments


Gold price today stands at $4,524 per ounce as of Friday, March 27, 2026, up 2.62% as the metal consolidates near its fourth consecutive weekly loss — down roughly 19% from its January 28 all-time high of $5,589. In Pakistan, 24-karat gold trades at Rs 497,000 per tola. Wall Street remains structurally bullish despite the pullback: Goldman Sachs targets $5,800, JP Morgan sees $5,500, and UBS has flagged potential for $6,000+. The accelerating global de-dollarization trend — gold now accounts for a larger share of global central bank reserves than U.S. Treasuries for the first time since the mid-1990s — provides a structural floor, but the Dollar Index’s recovery toward 100 and the Fed holding rates at 3.5%–3.75% are capping near-term upside.

Key Takeaways

  • Current Price:
    XAU/USD at $4,524/oz — down 19% from $5,589 all-time high (Jan 28)
  • Direction:
    Consolidating near 4-week lows; Iran conflict stalemate caps upside
  • Key Catalyst:
    U.S. PCE data (Mar 27), Fed April meeting, Iran ceasefire outcome
  • Wall Street Outlook:
    Goldman $5,800 · JP Morgan $5,500 · UBS $6,000+ — structural bull case intact
  • Pakistan Rate:
    Rs 497,000/tola (24K) — daily surge of Rs 13,000 reflects rupee weakness

Gold Price Today — Live Market Data

$4,524
▲ $146.00 (+2.62%)

Previous Close
$4,378

Week Range
$4,376 – $4,565

52-Week Range
$2,956.60 – $5,589.38

All-Time High
$5,589.38 (Jan 28)

24K Gold
Rs 497,000/tola

22K Gold
Rs 455,580/tola

Silver (Pakistan)
Rs 7,454/tola

Gold spot price — 12-month view. Chart via TradingView. Data delayed up to 15 minutes.

This section is updated regularly throughout the trading day. For live streaming prices, check Trading Economics gold charts.

What’s Driving Gold Prices Right Now

The dominant force shaping gold’s trajectory in late March 2026 is the Iran conflict, now entering its fourth week. Safe-haven demand surged when U.S. and Israeli forces struck Iranian military infrastructure on March 1, sending gold to $5,349 — its highest close since the January peak. But the narrative shifted last week when the Trump administration floated a 15-point ceasefire proposal routed through Pakistani diplomatic channels.

Iran rejected the proposal outright and countered with a five-point plan that includes a demand for permanent control of Strait of Hormuz shipping lanes — a non-starter for Washington. The diplomatic stalemate has kept oil above $99 per barrel, stoking inflation fears that would ordinarily push gold higher. Yet gold is pulling back because markets are pricing in some probability that war ends, which removes the crisis premium.

The Federal Reserve is holding rates at 3.5%–3.75%, a range that keeps real yields in marginally positive territory. When real yields rise, gold’s opportunity cost increases — which partly explains the 16% retreat from January highs. The Dollar Index (DXY) has strengthened roughly 4% since mid-February, creating a second headwind: gold is priced in dollars, so a stronger dollar mechanically depresses the metal’s price for foreign buyers.

Offsetting these pressures is sustained central bank demand. Poland, China, India, and Turkey continued accumulating gold reserves in Q1 2026, following a pattern documented by the World Gold Council that saw central banks purchase 863 tonnes in 2025 (following 1,037 tonnes in 2023). Poland’s National Bank led 2025 purchases at 102 tonnes for the second consecutive year. In January 2026, net central bank purchases were just 5 tonnes — cautious at elevated prices — but the structural diversification away from dollar reserves continues. Bank Negara Malaysia made its first gold purchase since 2018, and Bank of Korea announced plans for overseas physical gold ETFs for the first time since 2013. That structural demand floor has prevented a deeper correction despite the dollar rally.

Gold’s Wild 2026 — From $5,400 to $4,500

Jan 26
$5,110
Breaks $5,100 for first time

Jan 28
$5,589
All-Time High

Mid-Feb
$4,800
Profit-taking selloff

Mar 1
$5,349
Iran strike safe-haven surge

Mar 27
$4,524
Ceasefire stalemate consolidation

Gold’s journey in 2026 has been anything but orderly. The metal opened the year riding the momentum from 2025’s extraordinary bull run — prices had doubled from roughly $2,600 in early 2025 to above $5,200 by year-end, driven by a combination of dollar weakness, central bank accumulation, and mounting geopolitical anxiety in the Middle East.

January 26, 2026, marked the first major milestone of the year: gold broke through $5,100 for the first time in recorded history, reaching an intraday high of $5,110.50. Spot gold gained over 2.2% that day alone as safe-haven demand converged with a confidence crisis in risk assets. Silver simultaneously surged past $100 per ounce, reaching approximately $110. The catalyst was a Trump tariff threat against Canada over a potential trade agreement with China, compounding an already elevated geopolitical risk environment.

The euphoria peaked on January 28 when gold touched $5,589.38 — its all-time high. What followed was a textbook profit-taking episode. Gold fell sharply in a single session as leveraged longs unwound positions. The sell-off accelerated over the following weeks as the dollar strengthened and Iran ceasefire speculation briefly circulated. By mid-February, gold had retreated to the $4,800–$5,000 range as investors locked in gains after the historic run.

March 1 delivered a sharp reversal. U.S.-Israeli strikes on Iranian facilities sparked a safe-haven rush that drove gold back to $5,349 in a single session — a 3.66% daily swing that underscored how sensitive the market had become to war news. But the rally faded quickly as ceasefire negotiations began. By March 27, gold had retraced to approximately $4,524, settling into a range that reflects genuine uncertainty about the conflict’s outcome rather than either a panic bid or a complacency selloff.

The volatility profile has been extreme. Daily swings of 3% or more — historically rare for gold — have become routine. Options markets are pricing elevated implied volatility through at least Q2, suggesting traders expect more turbulence ahead regardless of whether the Iran conflict resolves or escalates.

$5,589

All-Time High (January 28, 2026)

Gold has pulled back 19% from this record — the deepest correction since the 2020 pandemic rally — yet remains 70% above early 2025 levels. Central bank accumulation of 863 tonnes in 2025 provides a structural floor.

Gold Price in Pakistan

Pakistani gold buyers are paying Rs 497,000 per tola for 24-karat gold and Rs 455,580 for 22-karat as of March 27, 2026. Silver trades at Rs 7,454 per tola domestically. The daily surge of Rs 13,000 in 24K rates reflects both the international price movement and the rupee’s ongoing depreciation against the dollar — when PKR weakens, local gold prices rise even when international prices are flat.

Pakistan ranks among the world’s largest gold consumers, with demand concentrated in jewelry, wedding season gifting, and household savings. The country imports most of its gold through official channels tracked by the State Bank of Pakistan, though informal markets remain significant. For current Pakistan gold rates per tola and gram, including city-specific prices for Karachi, Lahore, and Islamabad, check the All Pakistan Sarafa Jewellers Association data updated daily.

The currency impact on Pakistani gold prices is structural. Over the past two years, the rupee has lost significant value against the dollar, meaning even periods of gold price consolidation internationally can translate into local price increases. Buyers timing large purchases — particularly for weddings — should factor in both international gold trends and the rupee/dollar exchange rate, which adds a layer of volatility not present for buyers in dollar-denominated markets.

Gold Price Calculator

Convert between tola, gram, and ounce at today’s rate

Tola
Gram
Troy Ounce

24K (999)
22K (916)
21K (875)
18K (750)

USD
$4,524.00

PKR
Rs 1,260,426

Based on today’s spot price of $4,524/oz and PKR/USD rate of ~278.5. For indicative purposes only.

(function(){
var GOLD_OZ_USD = 4524;
var PKR_PER_USD = 278.5;
var GRAM_PER_OZ = 31.1035;
var GRAM_PER_TOLA = 11.664;
function calc(){
var amt = parseFloat(document.getElementById(‘gold-calc-amount’).value) || 0;
var unit = document.getElementById(‘gold-calc-unit’).value;
var karat = parseInt(document.getElementById(‘gold-calc-karat’).value);
var purity = karat / 24;
var grams;
if(unit === ‘oz’) grams = amt * GRAM_PER_OZ;
else if(unit === ‘tola’) grams = amt * GRAM_PER_TOLA;
else grams = amt;
var pricePerGram = (GOLD_OZ_USD / GRAM_PER_OZ) * purity;
var usd = grams * pricePerGram;
var pkr = usd * PKR_PER_USD;
document.getElementById(‘gold-result-usd’).textContent = ‘$’ + usd.toLocaleString(‘en-US’,{minimumFractionDigits:2,maximumFractionDigits:2});
document.getElementById(‘gold-result-pkr’).textContent = ‘Rs ‘ + Math.round(pkr).toLocaleString(‘en-US’);
}
document.getElementById(‘gold-calc-amount’).addEventListener(‘input’, calc);
document.getElementById(‘gold-calc-unit’).addEventListener(‘change’, calc);
document.getElementById(‘gold-calc-karat’).addEventListener(‘change’, calc);
calc();
})();

Why Gold Prices Move — The Fundamentals

Gold has served as a store of value for over 5,000 years, and its price today is determined by the same forces that have always governed it — just expressed through modern financial instruments. Understanding these drivers helps investors interpret daily price moves and position accordingly.

Inflation hedge: Gold historically rises when real interest rates turn negative — that is, when nominal rates fall below inflation. When cash earns less than inflation erodes, investors seek assets that preserve purchasing power. Gold’s 75% gain since early 2025 came precisely as inflation fears resurfaced globally. The relationship is not perfect — gold can underperform during short-term inflation spikes if the Fed raises rates aggressively — but over multi-year cycles, the correlation holds.

Safe haven demand: Wars, recessions, banking crises, and political upheaval drive capital into gold. The Iran conflict is the clearest current example — gold rallied $500 per ounce in the weeks following the initial escalation. This safe-haven premium is inherently unstable: it inflates quickly during panic and deflates just as fast when fear subsides, which explains gold’s $163 single-day selloffs during ceasefire rumors.

Dollar inverse correlation: Because gold is priced globally in U.S. dollars, a stronger dollar makes gold more expensive for foreign buyers, reducing demand and pushing prices down. Conversely, dollar weakness — driven by Fed rate cuts, trade deficits, or loss of reserve currency confidence — amplifies gold’s gains. The DXY and gold typically move in opposite directions, though this correlation breaks during extreme safe-haven episodes when both assets attract safe-harbor capital simultaneously.

Central bank reserves: Central banks purchased 863 tonnes of gold in 2025, following a record 1,037 tonnes in 2023 — both historically elevated volumes reflecting a structural shift away from dollar-denominated reserves. Poland, China, Turkey, and India were among the largest buyers. The World Gold Council projects approximately 850 tonnes in 2026 purchases. This structural demand creates a price floor that private market selling cannot easily breach, because central banks buy on weakness rather than chasing momentum — a dynamic explored in detail in TECHi’s analysis of de-dollarization and the shift away from dollar reserves.

Supply constraints: Global gold mining output has been essentially flat for a decade, running at roughly 3,500 tonnes per year. Unlike copper or oil, gold cannot quickly ramp production in response to price signals — new mines take 10–20 years to develop from discovery to production. This supply inelasticity means demand shocks translate more directly into price increases than they would for commodities with flexible supply curves.

Gold vs Other Assets in 2026

Asset Current Price YTD Return Peak-to-Current Risk Profile
Gold (XAU/USD) $4,524/oz +15% -19% from $5,589 Safe haven
Silver (XAG/USD) $67.97/oz +12% -37% from $97 (Mar peak) Hybrid (haven + industrial)
S&P 500 ~5,100 -8% -12% from Jan high Risk-on
Bitcoin (BTC) ~$66,000 +15% -50% from ATH (Feb crash) Risk-on / speculative
Oil (Brent) $112.57/bbl +51% At 2022 highs Commodity / geopolitical

Data as of March 27, 2026. YTD returns calculated from January 1, 2026 opening prices.

Gold’s performance in 2026 needs context against the broader asset class backdrop. At its January 28 peak of $5,589, gold had gained roughly 75% against early 2025 prices — a remarkable return for a traditional safe-haven asset normally measured in single-digit percentages annually. Even at the current ~$4,524 level — representing about 15% year-to-date gains — gold has vastly outperformed most major asset classes.

The S&P 500 is down approximately 8% for the year, battered by Iran war uncertainty, oil prices above $100, and the Fed holding rates at 3.5%–3.75% rather than cutting as markets had expected. Equities that initially bounced on AI-driven earnings momentum have surrendered those gains as geopolitical risk premiums compressed valuations.

Bitcoin has gained roughly 15% year-to-date, benefiting from institutional ETF inflows and halving cycle dynamics. However, Bitcoin has underperformed gold significantly during the peak Iran war anxiety periods — in February’s “crypto bloodbath,” Bitcoin fell over 50% from its all-time high even as gold held above $5,000. The divergence reveals that Bitcoin, despite its “digital gold” narrative, trades more like a risk asset than a safe haven during genuine crisis periods. When ceasefire hopes emerge, Bitcoin tends to outperform gold in the short term as risk appetite returns.

Silver at approximately $67.73 per ounce has been on a wild ride of its own — surging above $100 in January, crashing from a March 2 peak of $97.30 to a March 23 low of $61.21 (a 37% decline in three weeks), and now rebounding. Silver’s dual identity — safe-haven metal and industrial commodity — creates amplified moves in both directions. The gold-to-silver ratio currently sits near 65, well below the 80+ levels that prevailed in early 2025, reflecting silver’s outsized gains during the bull run. However, silver’s extreme March drawdown demonstrated that it trades with far more volatility than gold during crisis periods.

What to Watch Next

The single biggest near-term catalyst for gold is the Iran ceasefire outcome. Markets have oscillated between pricing in resolution (selling gold) and escalation (buying gold) on almost daily news cycle shifts. A confirmed ceasefire agreement would likely trigger a sharp selloff toward $4,000–$4,200 as the geopolitical risk premium evaporates. A breakdown in talks — or military re-escalation — would send gold back toward $5,000 and potentially test January’s all-time high.

The Federal Reserve’s April 28-29 FOMC meeting is the second key event. The March dot plot still projects one rate cut in 2026, but Goldman Sachs has pushed its first cut call to September (from June) citing oil-driven inflation. Markets are pricing roughly a 50% chance of a rate hike by December if energy costs persist. Any language suggesting the Fed is reopening the door to cuts would weaken the dollar and boost gold. Conversely, hawkish commentary emphasizing that oil-driven inflation prevents near-term easing would strengthen the dollar and pressure gold further.

Friday, March 27 brings the U.S. PCE price index — the Fed’s preferred inflation gauge. A hot reading above expectations could strengthen the dollar on expectations of prolonged high rates, weighing on gold. A soft reading would have the opposite effect, potentially triggering a rally toward $4,700.

Looking further ahead, India’s wedding season — peaking in Q2 — typically generates significant physical gold demand that provides seasonal price support. India is the world’s second-largest gold consumer, and wedding-season buying historically adds 200–300 tonnes of demand in a quarter, a non-trivial volume against global annual mine supply of 3,500 tonnes.

Wall Street’s major banks remain structurally bullish despite the correction. Goldman Sachs targets $5,800/oz, citing central bank buying and de-dollarization as structural demand drivers that transcend the Iran conflict cycle. JP Morgan projects a Q4 2026 average of $5,055 with a bull case of $5,500. UBS has flagged potential for $6,000+ if the de-dollarization trend accelerates. The consensus view: the 19% pullback from January’s all-time high is a correction within a structural bull market, not the beginning of a bear market.

Wall Street Price Targets

Goldman Sachs
$5,800

JP Morgan
$5,500

UBS
$6,000+

All three major banks maintain structurally bullish targets, citing de-dollarization and central bank diversification as demand drivers that transcend the Iran conflict cycle.

This is a developing story. TECHi updates gold prices regularly throughout the trading day. Last updated: March 27, 2026.

Prices as of Friday, March 27, 2026. Gold trades 23 hours/day — prices may have moved. Markets reopen Monday, March 30.

What is the gold price today?

Gold trades at approximately $4,524 per ounce as of March 27, 2026, down about 19% from its January 28 all-time high of $5,589. Despite the pullback, Wall Street remains structurally bullish: Goldman Sachs targets $5,800, JP Morgan sees $5,500, and UBS flags potential for $6,000+. Central bank buying and de-dollarization provide a structural floor.

What is the gold price today in Pakistan?

24-karat gold is Rs 497,000 per tola and 22-karat is Rs 455,580 per tola as of March 27, 2026. Silver trades at Rs 7,454 per tola. International silver is approximately $67.97 per ounce. These rates are set by the All Pakistan Sarafa Jewellers Association and reflect both international XAU/USD prices and the PKR/USD exchange rate.

Is gold a good investment in 2026?

Gold has risen roughly 75% since early 2025, driven by the Iran conflict and sustained central bank buying (863 tonnes in 2025 per the World Gold Council). Analysts at Goldman Sachs and JP Morgan maintain bullish targets above $5,000, citing structural de-dollarization demand and geopolitical uncertainty. However, the 19% pullback from the January $5,589 all-time high suggests caution at current levels — investors entering now are buying into a meaningful correction, not the start of the bull run. Dollar-cost averaging may be prudent given the extreme volatility (3%+ daily swings are now routine).


Source link

29 03, 2026

Today’s Platinum Price in Dharmapuri – Live Platinum Rate per Gram & Kg

By |2026-03-29T07:49:56+02:00March 29, 2026|Forex News, News|0 Comments


Price movements in platinum are often sharper than gold or silver due to its limited availability and reliance on a few global mining regions. Automotive regulations, global production levels, and technology usage influence the platinum price today. As platinum becomes more relevant in clean energy applications, its daily rate has gained importance for both buyers and investors.


Source link

29 03, 2026

XAG/USD rises to near $70; 100-SMA breakdown underpins downside

By |2026-03-29T03:47:06+02:00March 29, 2026|Forex News, News|0 Comments


Silver (XAG/USD) is up over 2.5% to near $70.00 during the early European trading session on Friday. The white metal gains sharply, but is still inside Thursday’s trading range, indicating that the broader trend is sideways.

The white metal is expected to trade with caution amid growing doubts over hopes of de-escalation in the Middle East war. Comments from peace talks mediators that Tehran had not requested a pause on Washington’s planned military attacks on Iran’s energy plants, as reported by the Wall Street Journal (WSJ), have voiced concerns over the credibility of United States (US) President Donald Trump’s claims that he ordered the postponement of attacks as per Iran’s request.

Late Thursday, US President Trump announced through a post on Truth.Social that, as per the Iranian request, he has paused his plans of obliterating Iranian energy plants by 10 days to Monday, April 6, 2026, at 8 P.M. Eastern Time.

Signs of fading de-escalation in Middle East conflicts are expected to remain as a key drag on the Silver price, assuming that the longer the conflicts last, the stronger the odds that oil prices could rise further.

Higher oil prices have already raised consumer inflation expectations, a scenario that restricts global central banks from easing monetary conditions, which in turn diminishes demand for non-yielding assets, such as Silver.

XAG/USD daily chart

Silver price struggles to gain any meaningful traction on Friday and oscillates in a narrow trading band just above the $68.00 mark. Meanwhile, the technical setup suggests the path of least resistance for the white metal remains to the downside and backs the case for an extension of the recent downfall witnessed over the past four weeks or so, from the monthly swing high.

The recent breakdown below the 100-day Simple Moving Average (SMA) – for the first time since April 2025 – was seen as a key trigger for the XAG/USD bears. The Moving Average Convergence Divergence (MACD) indicator remains below the zero line with its latest values negative, reinforcing downside momentum despite some recent flattening. The Relative Strength Index (RSI) hovers in the mid-30s, indicating weak momentum rather than outright oversold conditions and leaving room for further downside if sellers press the move.

Hence, any meaningful recovery attempt is likely to confront immediate resistance near the 100-day SMA, around $74.70. A daily close above this area would ease bearish pressure and open the way toward the $80.00 region as the next upside hurdle. On the downside, initial support is located at the recent low near $67.80, where a break would expose the mid-$60.00 zone as the next demand area in line with the broader moving-average-supported trend.

A sustained defense of $67.80 would keep the current pullback contained, while repeated failures below the 100-day SMA would maintain the focus on lower supports.

(The technical analysis of this story was written with the help of an AI tool.)


Source link

28 03, 2026

Domestic market adjusts, efforts to accumulate new price bases

By |2026-03-28T23:46:31+02:00March 28, 2026|Forex News, News|0 Comments


Domestic coffee prices

The domestic coffee market on March 28 had a slight adjustment. Purchasing agents in the Central Highlands region have lowered prices by 500 – 700 VND/kg, causing the price level to slightly retreat from the 96,000 VND/kg mark just established earlier. This adjustment is considered a late reaction after the weekend declines of the world exchange.

Specific fluctuations in localities:

Dak Lak, Gia Lai and Dak Nong (old): Simultaneously reduced by 500 VND, currently purchasing at 95,500 VND/kg.

Lam Dong: Recorded a decrease of 700 VND, currently the transaction price here reaches 94,800 VND/kg.

World coffee prices

In this morning’s session, international exchanges have not yet had new updates due to being on holiday, listed prices are still anchored at the closing level of last Friday’s session.

London Stock Exchange (Robusta): May 2026 delivery is currently at 3,624 USD/ton. Robusta is under pressure from Rabobank’s forecast report that world output in the 2026/27 crop year will reach a record 180 million sacks, an increase of about 8 million sacks compared to the previous crop year. In addition, Vietnam’s exports in January increased sharply by 38.3% compared to the same period, continuing to put pressure on the recovery momentum.

New York Stock Exchange (Arabica): Closing the weekend session at 280.75 cents/lb. Pressure on the Arabica exchange comes from inventory on the ICE exchange continuing to recover to a 4-month high of 466,055 bags. In addition, the weather situation in Brazil is still very positive as rainfall in the Minas Gerais region reached 138% of the historical average, promising a bumper crop.

Market opinion

The coffee market is entering a sensitive phase as forecasts for Brazil’s upcoming record crop year (66.2 million bags for 2026) are still the main factor dominating investor sentiment. However, Colombia’s 34% production decline in January and a decrease in export reports from Brazil are also contributing to curbing the deep decline.

It is predicted that in the coming sessions, domestic coffee prices will continue to struggle to establish a new bottom around the threshold of 94,500 – 96,000 VND/kg. Due to the abundant prospects of long-term supply, speculative funds tend to liquidate buy positions to take profits, making it difficult for prices to rebound sharply immediately. Farmers should closely monitor developments from major consumer countries and the actual export situation to have appropriate sales plans in March.

Note: The actual coffee price may vary depending on each purchasing area and grain quality.


Source link

28 03, 2026

Down Arrow Button Icon

By |2026-03-28T19:46:02+02:00March 28, 2026|Forex News, News|0 Comments


At 9 a.m. Eastern Time today, oil was priced at $107.81 per barrel with Brent serving as the benchmark (we’ll explain different benchmarks later in this article). That’s a gain of $1.96 compared with yesterday morning and around $34 higher than the price one year ago.

Oil price per barrel % Change
Price of oil yesterday $105.85 +1.85%
Price of oil 1 month ago $71.24 +51.33%
Price of oil 1 year ago $73.90 +45.88%
Price of oil yesterday
Oil price per barrel $105.85
% Change +1.85%
Price of oil 1 month ago
Oil price per barrel $71.24
% Change +51.33%
Price of oil 1 year ago
Oil price per barrel $73.90
% Change +45.88%

Will oil prices go up?

It’s impossible to forecast oil prices with detailed precision. Many different elements affect the market, but ultimately it boils down to supply and demand. When worries about economic recession, war, and other large-scale disruptions increase, oil’s path can shift fast.

How oil prices translate to gas pump prices

Gas prices at the pump don’t only track crude oil. They also include what it takes to refine and move that fuel, the taxes layered on top, and the extra markup your local station adds to stay in business.

Since crude oil generally makes up a majority of the per-gallon cost, changes in its price have an outsized impact. When oil surges, gas prices typically rise in tandem. But when oil retreats, gas prices often lag on the way down, a trend sometimes described as “rockets and feathers.”

The role of the U.S. Strategic Petroleum Reserve

In case of emergency, the U.S. has a store of crude oil known as the Strategic Petroleum Reserve. Its primary purpose is energy security in case of disaster (think sanctions, severe storm damage, even war). But it can also go a long way toward softening crippling price hikes during supply shocks.

It’s not a long-term answer and is more meant to provide temporary relief, assisting consumers and keeping critical parts of the economy running, like key industries, emergency services, public transportation, etc.

How oil and natural gas prices are linked

Both oil and natural gas are key sources of the energy we use every day. Because of this, a big change in oil prices can affect natural gas. For example, if oil prices increase, some industries may swap natural gas for some segments of their operations where possible, which increases demand for natural gas.

Historical performance of oil

To gauge oil’s performance, we often turn to two benchmarks:

  • Brent crude oil, the main global oil benchmark.
  • West Texas Intermediate (WTI), the main benchmark of North America

Between these two, Brent better represents global oil performance because it prices much of the world’s traded crude. And, it’s often the best way to track historical oil performance. In fact, even the U.S. Energy Information Administration now uses Brent as its primary reference in its Annual Energy Outlook.

Looking at the Brent benchmark across several decades, oil has been anything but steady. It’s seen spikes due to factors such as wars and supply cuts, and it’s also seen crashes from global recessions and an oversupply (called a “glut”). For example:

  • The early 1970s brought the first big oil shock when the Middle East cut exports and imposed an embargo on the U.S. and others during the Yom Kippur War.
  • Prices dropped in the mid-1980s for reasons such as lower demand and more non-OPEC oil producers entering the industry.
  • Prices spiked again in 2008 with increased global demand, but it soon plummeted alongside the global financial crisis.
  • During the 2020 COVID lockdown, oil demand collapsed like never before—bringing prices below $20 per barrel.

All to say, oil’s historical performance has been anything but smooth. Again, it’s hugely affected by wars, recessions, OPEC whims, evolving energy initiatives and policies, and much more.

Energy coverage from Fortune

Looking to stay up-to-date regarding the latest energy developments? Check out our recent coverage:

Frequently asked questions

How is the current price of oil per barrel actually determined?

The current price of oil per barrel depends largely on supply and demand, including news about potential future supply and demand (geopolitics, decisions made by OPEC+, etc.). In the U.S., prices also move based on how friendly an administration is to drilling, as it can affect future supply. For example, 2025 saw the Trump administration move to reopen more than 1.5 million acres in the Coastal Plain of the Arctic National Wildlife Refuge for oil and gas leasing, reversing the Biden administration’s policy of limiting oil drilling in the Arctic.

How often does the price of oil change during the day?

The price of oil updates constantly when the “futures” markets are open. A futures market is effectively an auction where people agree to buy or sell oil in the future. As long as people and companies are trading contracts, the oil price is changing.

How does U.S. shale oil production affect the current price of oil?

In short, shale is rock that contains oil and natural gas. Think of shale as energy yet to be tapped. The more shale the U.S. accesses, the more energy we’ll have—and the more easily oil prices can keep from spiking as much thanks to a greater supply.

How does the current price of oil impact inflation and the broader economy?

When oil is expensive, it tends to make everyday items cost more. This can be related to energy (your heating, gas utilities, etc.), but it’s also due to the logistics involved with making those items accessible to you. Shipping, for example, can affect the price of things at the grocery store, as it’s more expensive to get those products from warehouses and farms onto the shelf.


Source link

28 03, 2026

Oil Price Today: Brent at $112, WTI Hits $100 — Hormuz Crisis Deepens

By |2026-03-28T15:45:13+02:00March 28, 2026|Forex News, News|0 Comments


Oil price today: Brent crude closed at $112.57 per barrel (+4.22%) and WTI surged 5.46% to $99.64 — briefly touching $100.04 intraday — as of Friday, March 28, 2026, the highest levels since July 2022. Iranian Foreign Minister Abbas Araghchi declared that “no negotiations have happened with the enemy until now, and we do not plan on any negotiations,” while Iran has begun operating a yuan-based “toll booth” system at the Strait of Hormuz — allowing select Chinese, Russian, and allied vessels to transit while collecting fees in Chinese yuan. The Strait has been effectively closed to commercial traffic since March 2, disrupting approximately 17.8 million barrels per day of oil flows. Goldman Sachs estimates a $14–18 per barrel geopolitical risk premium baked into current prices. Trump has extended the deadline for Iran to reopen the Strait to April 6, 2026.

Key Takeaways

  • Brent Crude:
    $112.57/bbl (+4.22%) — highest since July 2022; session high $113.10
  • WTI Crude:
    $99.64/bbl (+5.46%) — briefly crossed $100.04 intraday
  • Key Driver:
    Iran’s Hormuz yuan toll + rejection of all U.S. negotiations
  • Risk Premium:
    Goldman estimates $14–18/bbl geopolitical premium over fundamentals
  • Deadline:
    Trump’s April 6 ultimatum for Iran to reopen the Strait of Hormuz
  • EIA Forecast:
    Brent >$95 near-term, declining to ~$80 by Q3 if conflict resolves

Brent & WTI Crude Oil Prices — Live Update

Brent: $112.57
▲ $4.56 (+4.22%)

WTI Crude (NYMEX)
$99.64 (+5.46%)

Brent-WTI Spread
$12.93

WTI Session High
$100.04 (crossed $100)

Brent 1-Month Change
+$36.57 (+51.3%)

Brent 1-Year Change
+$33.91 (+45.9%)

Natural Gas (Henry Hub)
~$3.80/MMBtu

Gasoline (RBOB)
Elevated — refinery margins squeezed

Brent crude & WTI — 12-month view. Chart via TradingView. Data delayed up to 15 minutes.

This section is updated as market conditions change. For real-time streaming prices, check Trading Economics oil charts or OilPrice.com.

What Is Driving Oil Prices Today

Four forces are converging to push crude to its highest levels since 2022.

Iran rejects all negotiations. Iranian Foreign Minister Abbas Araghchi told Al Jazeera on March 25 that “no negotiations have happened with the enemy until now, and we do not plan on any negotiations.” A senior Iranian security official separately confirmed no direct or indirect contact with Trump. This reversed the previous day’s optimism when President Trump claimed the two countries were “in negotiations right now.” The rejection sent Brent up 4.22% as the market priced out ceasefire probability.

Iran’s Hormuz yuan toll system. In a significant escalation with de-dollarization implications, Iran has begun operating a selective “toll booth” at the Strait of Hormuz — allowing Chinese, Russian, and allied vessels to transit while collecting fees in Chinese yuan. The Strait has been effectively closed to commercial traffic since March 2, disrupting approximately 17.8 million barrels per day. This is not just a supply disruption — it’s a geopolitical restructuring of how oil flows through the world’s most critical chokepoint.

OPEC+ holds firm on cuts. The cartel’s Joint Ministerial Monitoring Committee confirmed no plans to increase output before Q3 2026. Saudi Arabia has maintained voluntary production cuts of 1 million barrels per day since mid-2025. Combined with Iranian export disruptions, total OPEC+ output sits roughly 3.5 million bpd below capacity — the widest gap since the 2020 pandemic cuts.

Inventories critically low. The U.S. Energy Information Administration reported commercial crude stockpiles fell 4.1 million barrels last week to 427.3 million — the lowest since November 2022. The Strategic Petroleum Reserve sits at 345 million barrels following emergency releases in 2022–2023 that have not been replenished. OECD inventories are 180 million barrels below their five-year average.

The Iran War Premium — How Geopolitics Moves Oil

The Iran conflict has added an estimated $14–18 per barrel risk premium to crude since hostilities began in early March 2026, according to Goldman Sachs. Before the conflict, Brent was trading near $71–76 (per EIA data). The premium reflects three specific risks:

Strait of Hormuz closure. Approximately 17.8 million barrels per day — roughly 21% of global oil consumption — normally transits the Strait. Iran has effectively closed it to commercial traffic since March 2, with the yuan toll system creating a two-tier access regime. Insurance premiums for Gulf-bound vessels have tripled since March 1. Goldman Sachs warned that “Brent is likely to exceed its 2008 all-time high if depressed flows keep the market focused on the risk of lengthier disruptions.”

Iraqi force majeure. Iraq declared force majeure on all foreign-operated oilfields on March 20, citing “security concerns.” Iraq produces approximately 4.5 million bpd, making it OPEC’s second-largest producer. Even partial disruption removes significant supply from global markets.

Kuwait refinery strikes. Drone attacks on two Kuwaiti refineries on March 20 temporarily disrupted approximately 400,000 bpd of refining capacity. While operations have partially resumed, the attacks demonstrated the vulnerability of Gulf infrastructure to asymmetric warfare.

17.8M bpd

Oil flow through Strait of Hormuz — effectively closed since March 2

Iran’s selective “toll booth” system allows allied vessels (Chinese, Russian) to transit while collecting fees in yuan — a de-dollarization weapon weaponizing the world’s most critical oil chokepoint. Trump has set an April 6 deadline for reopening.

Oil Price History — 2026 Timeline

January 2026: Brent opened at $82.80. Markets were cautiously optimistic about demand recovery in China and stable OPEC+ output. WTI averaged $78.50 for the month. In late January, Brent briefly dipped to $64 per barrel as U.S.-Iran negotiations in Oman showed progress.

February 2026: Prices climbed to $88 as U.S.-Iran tensions escalated following sanctions enforcement actions. The U.S. issued warnings to American-flagged ships to avoid Iranian waters in the Strait of Hormuz. India’s potential freeze on Russian crude imports — linked to a Trump trade deal — added upside pressure. Brent closed February at $89.40.

March 1–10: The Iran conflict began in earnest. Brent spiked from $89 to $98 in three sessions. WTI broke above $90 for the first time since October 2023. The EIA’s Short-Term Energy Outlook (March 10) noted Brent at $94 — up 50% from the start of the year.

March 11–20: Iraqi force majeure and Kuwaiti refinery attacks pushed Brent above $112 — the 2026 high at the time. WTI touched $98.32. The psychologically significant $100 WTI level came into sight.

March 21–26: Prices pulled back to $97–106 range as ceasefire rumors circulated, then rebounded sharply after Iran’s total rejection of negotiations.

March 27–28: WTI briefly crossed $100 for the first time since 2022 ($100.04 intraday), and Brent closed at $112.57 — a new 2026 high. The Hormuz yuan toll system and Trump’s April 6 ultimatum added fresh urgency.

Oil vs Other Assets in 2026

Crude oil has been the standout commodity performer of 2026, driven by supply constraints and geopolitics rather than demand strength. Brent is up approximately 51% from one month ago ($71.24) and 46% year-over-year. By comparison, gold has gained approximately 15% year-to-date to ~$4,430 per ounce, while the S&P 500 is down roughly 8% as energy costs weigh on corporate margins.

The oil-gold correlation has strengthened during the conflict — both are benefiting from geopolitical uncertainty, but oil carries more upside risk because supply disruption has no equivalent in precious metals. Bitcoin, often touted as an inflation hedge, has been mixed — gaining approximately 15% year-to-date but showing far more volatility during crisis spikes. Natural gas has also spiked, with European TTF futures up 34% since March 1 as markets worry about LNG supply routes through the Gulf. U.S. natural gas (Henry Hub) has been relatively insulated at ~$3.80/MMBtu, according to the EIA.

Global Oil Demand — Regional Breakdown

United States: The world’s largest consumer at approximately 20 million bpd. U.S. production has reached a record 13.3 million bpd — the EIA forecasts this rising to 13.6 million bpd in 2026 and 13.8 million bpd in 2027 as higher prices incentivize drilling. However, the U.S. remains a net importer of crude, making it vulnerable to Brent-linked pricing.

China: The second-largest consumer at approximately 16 million bpd. Chinese demand growth has slowed to 2.1% year-over-year as the economy navigates a property sector correction and EV adoption accelerates. China has been quietly building strategic reserves during price dips, with stockpiles estimated at 900 million barrels. Notably, China is among the countries benefiting from Iran’s Hormuz toll system — gaining preferential transit access.

India: The fastest-growing major demand center, consuming approximately 5.8 million bpd — up 4.3% year-over-year. India has been purchasing discounted Russian crude at volumes exceeding 2 million bpd, partially insulating itself from Brent price spikes. However, the Trump administration’s trade deal linking U.S. market access to halting Russian crude purchases has created uncertainty about India’s future supply mix.

Europe: Demand is flat at approximately 14 million bpd as energy transition policies and mild winter weather reduced consumption. European refiners face margin pressure from elevated Brent prices and weak domestic demand. LNG disruptions through the Strait of Hormuz have pushed European gas prices higher, adding to the energy cost burden.

Why Oil Prices Change — The Fundamentals

Supply and demand. Global oil demand averages approximately 103 million barrels per day in 2026, while supply capacity sits around 104 million bpd. This thin 1% buffer means any disruption — a pipeline outage, a hurricane in the Gulf of Mexico, or a geopolitical crisis — can move prices 5–10% in days.

OPEC+ production decisions. The cartel controls roughly 40% of global output. When OPEC cuts production, prices rise. When they increase output, prices fall. Saudi Arabia’s role as swing producer gives it outsized influence — the kingdom can add approximately 2 million bpd within 90 days if it chooses.

U.S. dollar strength. Oil is priced in dollars globally. When the dollar strengthens, oil becomes more expensive for buyers using other currencies, which can suppress demand. The Dollar Index (DXY) currently sits near 100, down from 103 earlier this month — a modest tailwind for oil. Iran’s yuan toll system, if it persists, could gradually erode the dollar’s dominance in oil pricing — a development explored in TECHi’s de-dollarization analysis.

Seasonal patterns. Demand typically peaks in summer (driving season) and winter (heating). Spring and fall are shoulder seasons with weaker demand. However, geopolitical events can override seasonal patterns entirely, as the current Iran crisis demonstrates.

U.S. production response. Higher oil prices incentivize more U.S. drilling. The EIA forecasts U.S. crude oil production will average 13.6 million bpd in 2026 and rise to 13.8 million bpd in 2027 — both upward revisions driven by current prices. This domestic supply buffer partially insulates U.S. consumers but cannot offset a sustained Hormuz closure.

What to Watch Next

Trump’s April 6 deadline. The president has given Iran until April 6, 2026, to reopen the Strait of Hormuz. If Iran does not comply, the administration has signaled potential military action — including intercepting tankers carrying Iranian crude and deploying an additional carrier strike group. This is the single most important near-term catalyst for oil prices.

Iran ceasefire negotiations. Despite Iran’s public rejection of talks, back-channel communications through Pakistani mediators continue. Any confirmed deal would trigger a sharp $10–15 drop in Brent as the risk premium unwinds. Conversely, escalation — particularly a direct strike on oil infrastructure — could push Brent above $120 and potentially toward its 2008 all-time high of $147.

OPEC+ June meeting. The cartel’s next full ministerial meeting is scheduled for June 1. Markets will watch for any signal of production increases to cool prices and prevent demand destruction.

EIA weekly inventory report. Released every Wednesday at 10:30 AM ET. Continued draws below the 5-year average would support prices; any surprise build could signal demand weakness.

Federal Reserve policy. Rising oil prices feed directly into inflation. The Fed’s April 28–29 FOMC meeting is the next major policy event. If oil-driven inflation prevents rate cuts — Goldman Sachs has pushed its first cut call from June to September — the dollar could strengthen and create a modest headwind for crude. Conversely, any hint of rate cuts would weaken the dollar and support oil.

Analyst Oil Price Forecasts

Goldman Sachs
$14–18 premium

EIA (STEO)
>$95 near-term

EIA (Q3-Q4)
$70–80 if resolved

The EIA forecasts Brent above $95/bbl for the next two months, falling below $80 in Q3 2026 and ~$70 by year-end — contingent on Hormuz transit resuming. If the conflict persists, Goldman warns Brent could exceed its 2008 all-time high of $147.

This is a developing story. Oil prices are updated as market conditions change. Last updated: March 28, 2026.

What is the oil price today?

As of March 28, 2026, Brent crude closed at $112.57 per barrel (+4.22%) and WTI crude at $99.64 per barrel (+5.46%) — the highest levels since July 2022. WTI briefly crossed $100. Prices surged after Iran rejected negotiations and began operating a yuan-based toll system at the Strait of Hormuz.

Why are oil prices so high in 2026?

Oil prices are elevated due to the U.S.-Iran military conflict that began in March 2026, which has effectively closed the Strait of Hormuz — a chokepoint for 21% of global oil supply. Iraq’s force majeure on foreign-operated oilfields, Kuwait refinery strikes, and OPEC+ production cuts have further tightened supply. Goldman Sachs estimates a $14–18 per barrel geopolitical risk premium.

Will oil prices go down in 2026?

The EIA forecasts Brent crude remaining above $95 per barrel for the next two months, before falling below $80 in Q3 2026 and around $70 by year-end — if the Iran conflict resolves and Strait of Hormuz transit resumes. Without a resolution, analysts expect Brent to remain above $100 through at least mid-2026, with Goldman Sachs warning prices could exceed the 2008 all-time high of $147 if disruptions persist.

What is the difference between Brent and WTI crude?

Brent crude is the international benchmark sourced from the North Sea, while WTI (West Texas Intermediate) is the U.S. benchmark from landlocked Cushing, Oklahoma. Brent typically trades at a premium due to its global shipping accessibility. The current $12.93 Brent-WTI spread is elevated due to Middle East shipping disruptions that disproportionately affect waterborne Brent-linked crude.


Source link

28 03, 2026

Forecast update for EURUSD -27-03-2026.

By |2026-03-28T11:42:09+02:00March 28, 2026|Forex News, News|0 Comments


The CHFJPY price ended the last negative movement by facing a key support at 200.55 level, which forces it to delay the decline and begin providing sideways trading to settle near 200.70.


Note that the continuation of forming extra barrier at 201.05 level and providing negative momentum by the main indicators will increase the chances of renewing the negative pressures on the current support, to confirm the importance of surpassing it to open the way for reaching new stations that might begin at 200.25 and 199.90.


The expected trading range for today is between 200.25 and 200.90


Trend forecast: Bearish by achieving the break


Source link

28 03, 2026

Copper price delays the decline– Forecast today – 27-3-2026

By |2026-03-28T07:41:31+02:00March 28, 2026|Forex News, News|0 Comments


Copper price continued to provide sideways trading by its stability near the initial barrier at $5.5100 level, to announce delaying the attempts of resuming the bearish correction due to the continuation of the main indicators’ contradiction in the last period.


The price might continue to provide mixed sideways trading, to keep waiting for extra momentum, to ease the mission of reaching $5.2700 initially, attempting to reach the next target at $4.9500, confirming the importance of its stability in the current period below $5.6300.


The expected trading range for today is between $5.4000 and $5.5800


Trend forecast: Fluctuating


Source link

Go to Top