Copper price resumed the bullish trend, taking advantage of the continuation of providing positive momentum by the main indicators, to reach $5.9700 barrier, followed by recording the suggested target in the previous report.
The price attempt to support this barrier supports the chances of targeting new positive stations confirms the importance of waiting for confirming the breach, to avoid any unexpected corrective rebound, while the extra positive stations that are located at $6.0850 reaching $6.2300 level.
The expected trading range for today is between $5.8800 and $6.0850
Silver (XAG/USD) surges on Tuesday, trading around $78.80 at the time of writing, up 4.16% on the day as strong buying interest pushed Silver to a daily high of $79.32. The white metal rebounds sharply after touching lows near $72.60 on Monday, benefiting from a broad weakening of the US Dollar (USD) and improving market sentiment.
Precious metals are gaining ground as investors also react to softer-than-expected inflation data in the United States (US). The Producer Price Index (PPI) published by the US Bureau of Labor Statistics earlier in the day, shows that annual producer inflation rose by 4% in March, below market expectations of 4.6%, while the monthly reading increased by 0.5%, also missing forecasts. The weaker figures are helping to dampen hawkish speculations about the future Federal Reserve (Fed) monetary policy, which is providing support for non-interest-bearing assets such as Silver.
At the same time, the US Dollar remains under pressure across currency markets. The US Dollar Index (DXY), which tracks the performance of the Greenback against a basket of major currencies, declines toward six-week lows as traders adjust their expectations for US interest rates following the softer inflation figures.
Geopolitical developments are also shaping market sentiment. Reports suggesting the possibility of renewed negotiations between the US and Iran are boosting risk appetite after tensions escalated earlier in the week. According to Reuters, diplomatic efforts could lead to a new round of talks in Islamabad in the coming days, raising hopes of a potential de-escalation following the breakdown of previous discussions.
These developments come after US President Donald Trump indicated that Iranian officials had reached out to seek a possible agreement, suggesting that diplomatic channels remain open despite ongoing disagreements over Iran’s nuclear program.
In this context, the combination of a weaker US Dollar, softer inflation signals and easing geopolitical tensions is reinforcing demand for precious metals, allowing Silver to extend its recovery.
Silver FAQs
Silver is a precious metal highly traded among investors. It has been historically used as a store of value and a medium of exchange. Although less popular than Gold, traders may turn to Silver to diversify their investment portfolio, for its intrinsic value or as a potential hedge during high-inflation periods. Investors can buy physical Silver, in coins or in bars, or trade it through vehicles such as Exchange Traded Funds, which track its price on international markets.
Silver prices can move due to a wide range of factors. Geopolitical instability or fears of a deep recession can make Silver price escalate due to its safe-haven status, although to a lesser extent than Gold’s. As a yieldless asset, Silver tends to rise with lower interest rates. Its moves also depend on how the US Dollar (USD) behaves as the asset is priced in dollars (XAG/USD). A strong Dollar tends to keep the price of Silver at bay, whereas a weaker Dollar is likely to propel prices up. Other factors such as investment demand, mining supply – Silver is much more abundant than Gold – and recycling rates can also affect prices.
Silver is widely used in industry, particularly in sectors such as electronics or solar energy, as it has one of the highest electric conductivity of all metals – more than Copper and Gold. A surge in demand can increase prices, while a decline tends to lower them. Dynamics in the US, Chinese and Indian economies can also contribute to price swings: for the US and particularly China, their big industrial sectors use Silver in various processes; in India, consumers’ demand for the precious metal for jewellery also plays a key role in setting prices.
Silver prices tend to follow Gold’s moves. When Gold prices rise, Silver typically follows suit, as their status as safe-haven assets is similar. The Gold/Silver ratio, which shows the number of ounces of Silver needed to equal the value of one ounce of Gold, may help to determine the relative valuation between both metals. Some investors may consider a high ratio as an indicator that Silver is undervalued, or Gold is overvalued. On the contrary, a low ratio might suggest that Gold is undervalued relative to Silver.
The domestic coffee market on April 14 continued to increase, extending the recovery period.
According to surveys in key growing areas of the Central Highlands, coffee prices simultaneously increased by 500 – 600 VND/kg, bringing the average price level of the whole region to the threshold of 86,500 VND/kg.
In Dak Nong province (old), the purchase price recorded the highest increase of 600 VND/kg, pushing the price to the highest in the region at 86,600 VND/kg.
Dak Lak and Gia Lai two localities increased by another 500 VND/kg, bringing the price to the highest level of 86,550 VND/kg.
With the same increase of 500 VND, Lam Dong province listed it at 86,500 VND/kg.
World coffee prices
On the international market, futures exchanges rebounded after the weekend session remained unchanged. On the New York exchange, Arabica futures for May 2026 opened at 300.85 cents/lb. Further forwards offered prices at the threshold of 268.4 cents/lb – 296.25 cents/lb.
In the same period, the London exchange also witnessed the Robusta line increasing in price, standing at 3,351 USD/ton. Further terms fluctuated around 3,106 USD/ton – 3,254 USD/ton.
Coffee prices are trending upwards, with Arabica coffee reaching its highest level in 2 weeks. The reason is that rainfall in Brazil is lower than average, which could reduce yields and push prices up. Tight Robusta supply also supports prices.
Market outlook
The closure of the Strait of Hormuz disrupted global transportation and tightened coffee supply. This increased transportation, insurance and fuel costs, thereby increasing costs for coffee importers and roasters.
Last week, Arabica prices fell to a 4-week low due to expectations for a record crop in Brazil. Coffee exports increased sharply from Vietnam – the world’s largest robusta producer, putting pressure on robusta prices.
According to data from the General Statistics Office, Vietnam’s coffee exports in the first quarter of 2026 increased by 14% compared to the same period, reaching 585,000 tons. In 2025, exports increased by 17.5%, reaching 1.58 million tons. The output of the 2025/26 crop is expected to increase by 6%, to 1.76 million tons (294 million bags), the highest level in 4 years.
Coffee prices were also supported by information that Brazil’s green coffee exports in February decreased by 27% year-on-year, to 2.3 million bags. The Brazilian Ministry of Commerce also said that exports in March decreased by 31%, to 151,000 tons.
The US Department of Agriculture (USDA – FAS) forecasts that Brazil’s output will decrease by 3.1% to 63 million sacks, while Vietnam will increase by 6.2% to 30.8 million sacks (the highest in 4 years). Inventory at the end of the 2025-2026 crop year is expected to decrease by 5.4%, to 20.148 million sacks.
Natural gas price continued providing strong bearish pressures on the support level at $2.620, due to the negative momentum by the main indicators, which makes us wait for breaking the required breakout, to begin targeting extra negative stations by reaching $2.390 and $2.250 initially.
The stability of the moving average 55 above the initial resistance towards $3.170 confirms the trading confinement within the negative track, to keep waiting for achieving the negative targets, waiting for the next close to detect the suggested targets in the upcoming trading.
The expected trading range for today is between $2.390 and $2.820
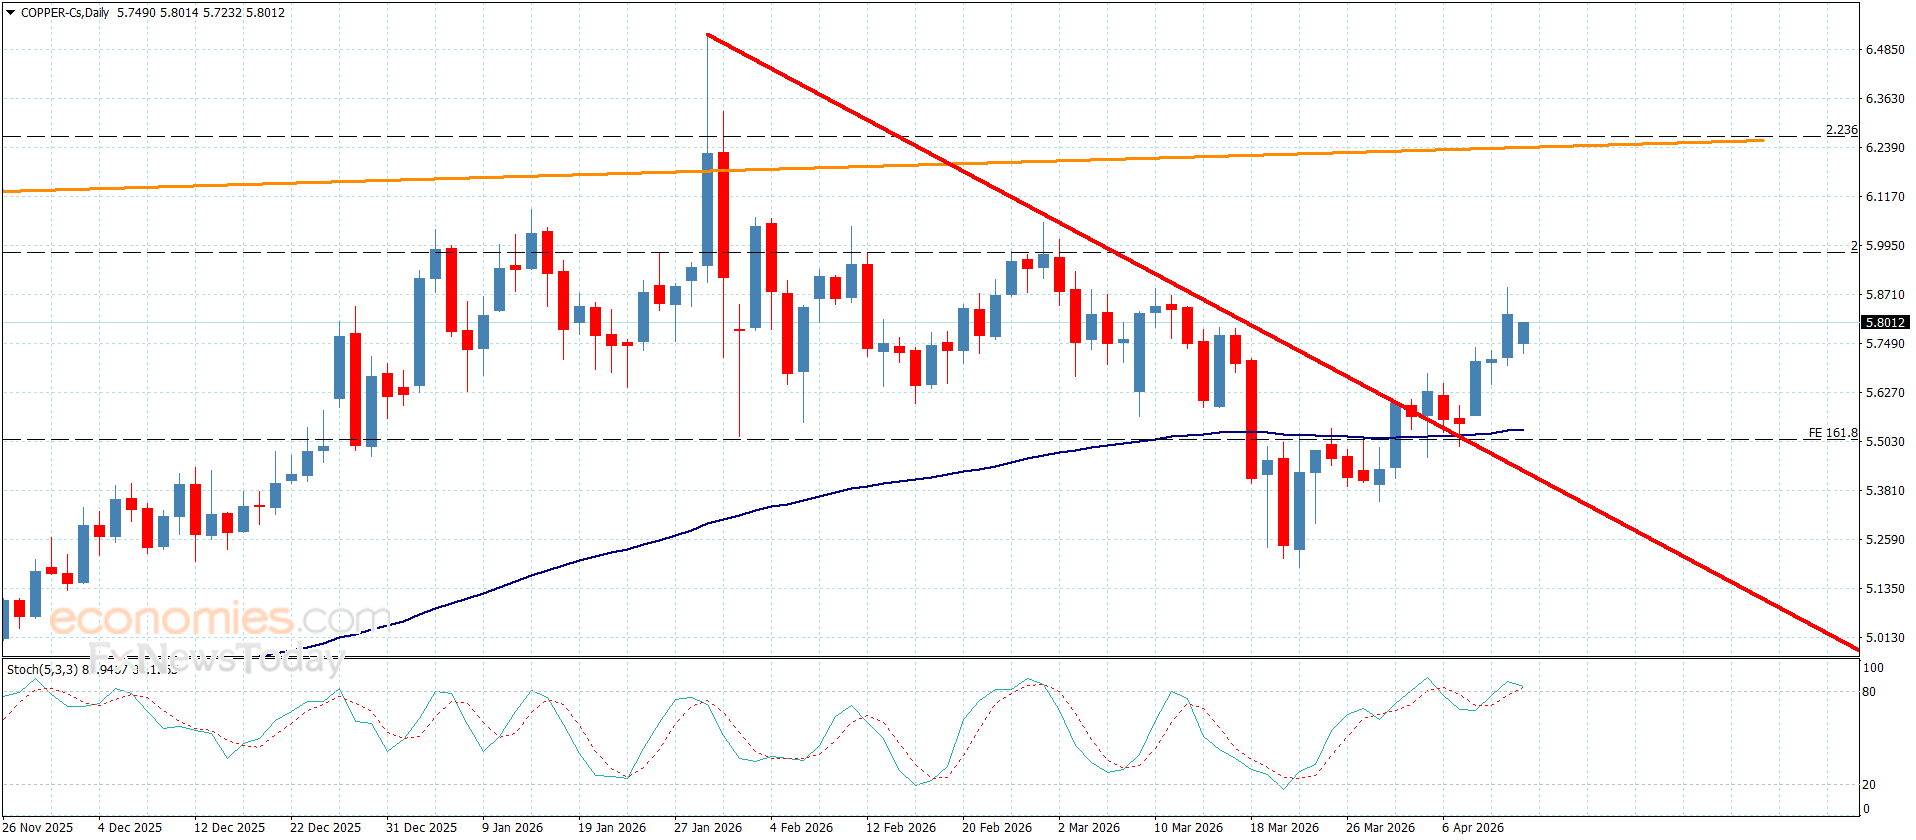
Copper price continued forming bullish waves in Friday’s trading, reaching the second target at $5.8900 level, which forces it to form temporary corrective rebound due to stochastic attempt to exit the overbought level by its fluctuation near $5.8100.
The contradiction of the main indicators might reinforce the dominance of the sideways bias in the current trading, the stability above $5.5000 supports the bullish scenario, to keep waiting for reaching the next barrier at $5.9700, to monitor its behavior to confirm the suggested target in the upcoming trading.
The expected trading range for today is between $5.6800 and $5.9700
United States and Iran talks collapsed on Sunday, Iran’s war back at the top of investors’ concerns.
The US initiated its own blockage of the Strait of Hormuz to halt Iran’s tankers’ passage.
XAU/USD is neutral in the near term, needs to reconquer the $4,800 mark.
Spot Gold trades with a sour tone on Monday, although still confined to a tight range just above the $4,700 mark. The bright metal is indifferent to mounting fears, after the United States (US) and Iran negotiations failed over the weekend.
On Sunday, following a marathon 20-hour talk, both parties announced they were unable to reach a deal. Not actually a surprise. The US demands that Iran abandon its uranium enrichment program, a condition to end the war, something Tehran is unwilling to do. As a result, US President Donald Trump announced a blockage of the Strait of Hormuz, effective Monday. The Strait is now suffering a double blockage, with the US aiming to prevent Iran’s oil from leaving the Middle East.
The weekly opening brought the usual US Dollar (USD) demand and higher Oil prices, with the barrel of West Texas Intermediate (WTI) hovering around $95. During American trading hours, however, there were headlines indicating that Iranian officials are studying US demand to interrupt their nuclear program, leading to some USD weakness. Other headlines indicating that mediators are looking for a 45-60 day ceasefire added to the market’s better mood.
The XAU/USD pair fell towards $4,632 at the beginning of the day, but quickly recovered the $100 loss and trades around Friday’s closing level.
XAU/USD short-term technical outlook
In the four-hour chart, XAU/USD is neutral, as it holds below the 20-period simple moving average (SMA) at roughly $4,739.71 and the longer-term 200-period SMA near $4,858.70. The pair still finds underlying trend support from the 100-period SMA around $4,605.65. The Momentum indicator aims marginally lower around its midline, and a neutral Relative Strength Index (RSI) near 50 hints that upside attempts lack conviction for now.
In the daily chart, XAU/USD holds a constructive near-term bias as spot prices remain well above the rising 20-day SMA around $4,658, the 100-day SMA near $4,687, and the more distant 200-day SMA close to $4,186, collectively reinforcing a broader uptrend backdrop. Momentum is improving, with the 14-day indicator in positive territory, though the Relative Strength Index (RSI) hovering just below the 50 line hints that buying pressure is steady rather than exuberant after the latest rebound from recent lows.
On the topside, immediate resistance is aligned at the 20-period SMA around $4,739.71, with the 200-period SMA at $4,858.70 reinforcing a higher cap if gains extend. On the downside, immediate support is seen at the 20-day SMA near $4,658, followed by the shorter 100-period SMA near $4,605.65.
(The technical analysis of this story was written with the help of an AI tool.)
The Boeing Company (BA) stock price recorded a decline in its latest intraday trading, after coming into contact with resistance at its 50-day SMA. This occurs amid the dominance of a short-term corrective bearish wave, with a negative divergence beginning to form in the Stochastic indicator after reaching extremely overbought levels that are exaggerated relative to price action, as negative signals start to emerge.
Therefore we expect the stock price to decline during its upcoming trading sessions, as long as resistance at $228.95 remains intact, targeting the support level at $202.30.
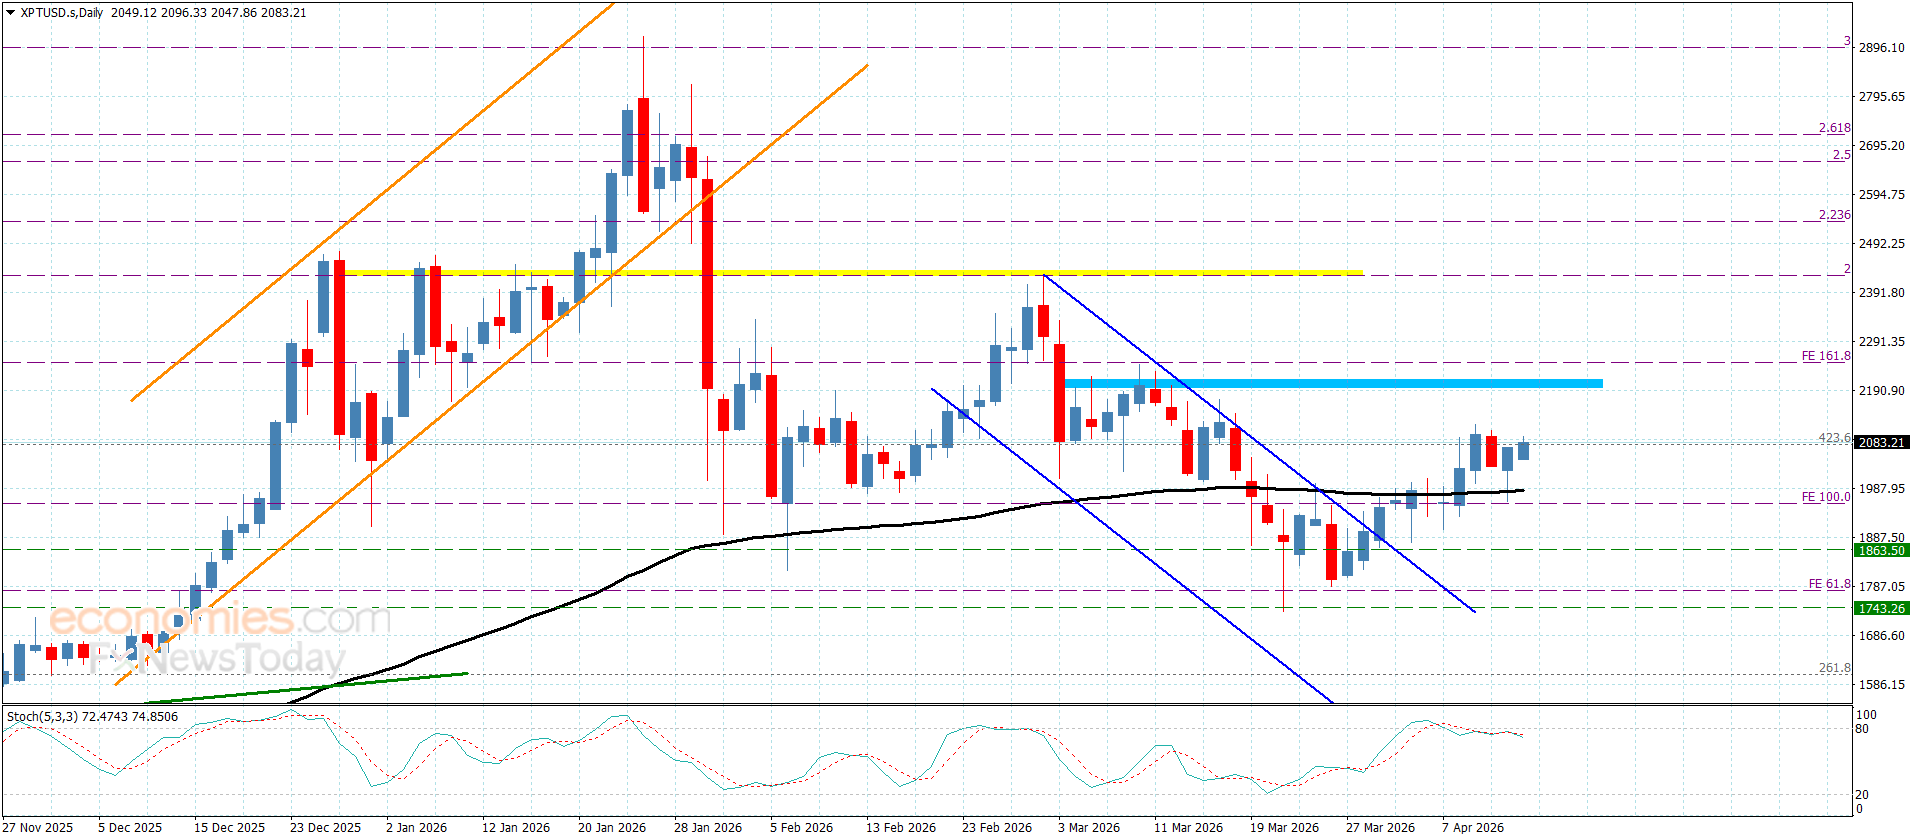
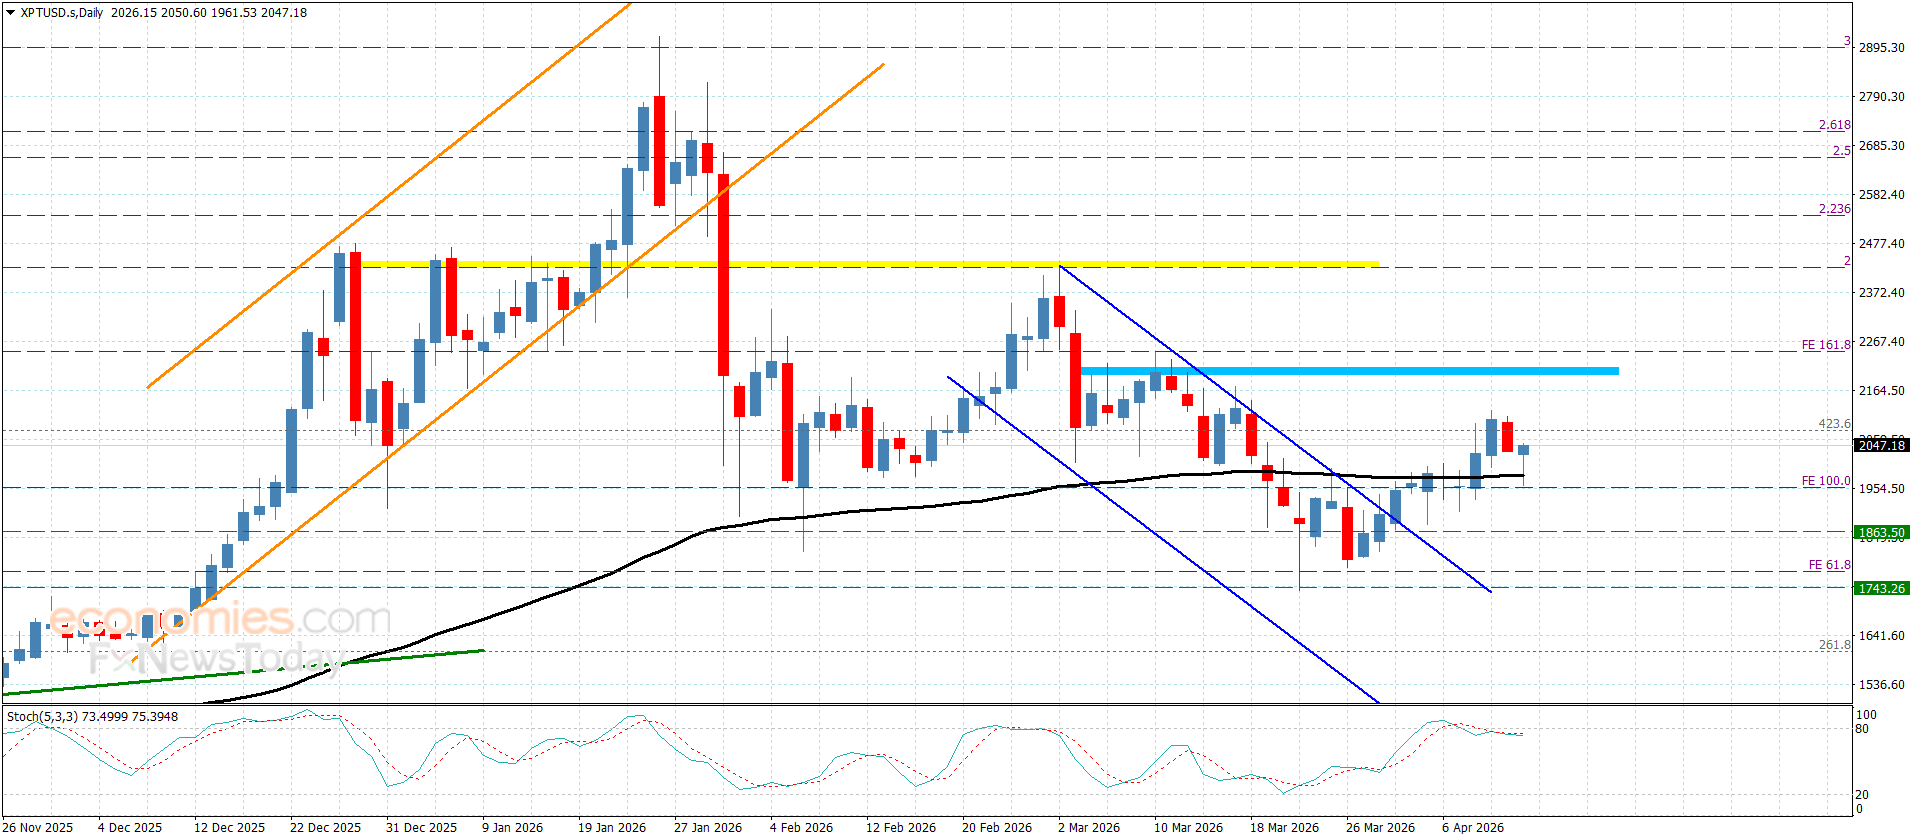
Platinum price affected by temporary negative pressure since Friday, which pushes it to form bearish corrective waves, to test the additional support at $1950.00, to bounce currently towards $2045.00, to settle above the moving average 55.
The stability of the support level and stochastic attempt to provide positive momentum by the main indicators will increase the chances of the rally towards $2075.00 and providing a positive close above it will open the way for resuming the bullish trend, expecting to reach $2130.00 followed by the next barrier at $2205.00.
The expected trading range for today is between $1970.00 and $2130.00
The domestic coffee market this morning, April 13th, continued to increase after a week of deep price slippage.
According to surveys in key growing areas of the Central Highlands, coffee prices simultaneously increased slightly from 200 to 300 VND/kg, bringing the average price level of the whole region to the threshold of 86,000 VND/kg.
In Dak Nong province (old), the purchase price recorded an increase of 200 VND, pushing the price to the highest level in the region at 86,000 VND/kg.
Dak Lak and Gia Lai two localities increased the highest by 300 VND, bringing the price to the highest level of 86,000 VND/kg.
With the same increase of 300 VND, Lam Dong province listed it at 85,500 VND/kg.
World coffee prices
On the international market, futures exchanges remained unchanged after a slight price increase in the last session of the week. On the New York exchange, Arabica futures for May 2026 opened at 300.10 cents/lb. Further forwards offered prices at the threshold of 267 cents/lb – 295.9 cents/lb.
For the same term, the London exchange also witnessed the Robusta flow moving sideways, standing at 3,324 USD/ton. Further terms fluctuated around 3,100 USD/ton – 3,239 USD/ton.
Scarce supply of Robusta coffee is supporting prices. Robusta inventories on the ICE exchange fell to their lowest level in more than 1 year. However, increased Arabica inventories are putting pressure on prices as inventory tracked by ICE increased to its highest level in 6.25 months.
Market outlook
According to the Climate Prediction Center (CPC) of the US National Weather Service, neutral ENSO conditions are present and are likely to last until mid-year. Neutral ENSO states occur when there is no El Nino or La Nina, often bringing more stable and predictable weather. This shows the decline of extreme climate phenomena and can help make global crop forecasts more consistent.
For coffee growing areas, especially in Brazil, Colombia and Vietnam, neutral ENSO conditions can contribute to stabilizing rainfall and temperature, supporting more uniform crop development and reducing the risk of weather disruptions. Weather factors will continue to be closely monitored as the Southern Hemisphere enters the traditional cold winter period in the near future.
In terms of long-term vision, in the context of Vietnamese coffee production expected to recover in the 2025-2026 crop year after years affected by weather, along with the upcoming Robusta Conilon harvest of Brazil and expected positive output from Indonesia and Uganda in the middle of the year, the market is showing signs of rebalancing supply and demand for Robusta coffee.
Gold is re-attempting $4,700 early Monday, looking to fill up a $60 bearish opening gap, as markets brace for a re-escalation in the Middle East conflict.
Gold bounces, but not out of the woods yet
Despite the latest uptick, Gold eyes more pain as the US Dollar (USD) surges through the roof in Asia on Monday. A flight to safety remains a key theme, boosting the latter’s appeal as a safe-haven asset and the world’s reserve currency.
Markets remain increasingly concerned about the durability of the already frail ceasefire agreement between the United States (US) and Iran after the failed peace talks over the weekend in Pakistan.
The breakdown resulted in US President Donald Trump threatening blockades in the Strait of Hormuz, while reiterating his threats to attack the Iranian civilian energy infrastructure.
Additionally, Trump and his advisers are reportedly weighing limited military strikes in Iran in the face of the fallout, per the Wall Street Journal (WSJ).
The US Central Command (CENTCOM) announced that the “Forces will start blockade of all maritime traffic entering and exiting Iranian ports on Monday, 10 AM ET” (14:00 GMT).
In response, Iran’s Islamic Revolutionary Guard (IRGC) warned that any miscalculated move will trap the enemy in the deadly whirlpools” in the key waterway”.
“Approaching military vessels to the Strait of Hormuz is considered a violation of the ceasefire and will be dealt with harshly and decisively,” the IRGC warned further.
Meanwhile, the USD also draws support from hawkish expectations around the US Federal Reserve’s (Fed) interest rate outlook, which
The potential for US naval action around the Strait raises the risk of further disruption to global Oil supply, which could bolster higher inflation expectations and revive bets for a Fed rate hike this year.
This narrative underpins the USD, while non-yielding assets such as Gold tend to suffer in a high-interest-rate environment.
In the day ahead, the Mideast headlines will continue to drive the broader market sentiment, impacting the Greenback and thus, Gold price.
A lack of top-tier US economic data also puts the market attention back on the US-Iran ceasefire and the likely resumption of the US military action in Iran.
Gold price technical analysis: Daily chart
XAU/USD is holding a bearish bias as the 21-day simple moving average (SMA) near $4,674 has pierced through the 100-day SMA around $4,687 from above, with a Bear Cross confirmation awaited on a daily closing basis. The 14-day Relative Strength Index (RSI) around 47 stays below the midline, hinting at renewed downside.
On the topside, initial resistance is aligned with the 50-day SMA at roughly $4,899, where a daily close higher would open the door for a more decisive recovery phase. On the downside, immediate support is seen first at the 21-day SMA around $4,674, followed closely by the 100-day SMA near $4,687 reinforcing the same demand area, while a deeper pullback towards the 200-day SMA at about $4,186 would be expected to attract more strategic dip-buying interest if tested.
(The technical analysis of this story was written with the help of an AI tool.)
Gold FAQs
Gold has played a key role in human’s history as it has been widely used as a store of value and medium of exchange. Currently, apart from its shine and usage for jewelry, the precious metal is widely seen as a safe-haven asset, meaning that it is considered a good investment during turbulent times. Gold is also widely seen as a hedge against inflation and against depreciating currencies as it doesn’t rely on any specific issuer or government.
Central banks are the biggest Gold holders. In their aim to support their currencies in turbulent times, central banks tend to diversify their reserves and buy Gold to improve the perceived strength of the economy and the currency. High Gold reserves can be a source of trust for a country’s solvency. Central banks added 1,136 tonnes of Gold worth around $70 billion to their reserves in 2022, according to data from the World Gold Council. This is the highest yearly purchase since records began. Central banks from emerging economies such as China, India and Turkey are quickly increasing their Gold reserves.
Gold has an inverse correlation with the US Dollar and US Treasuries, which are both major reserve and safe-haven assets. When the Dollar depreciates, Gold tends to rise, enabling investors and central banks to diversify their assets in turbulent times. Gold is also inversely correlated with risk assets. A rally in the stock market tends to weaken Gold price, while sell-offs in riskier markets tend to favor the precious metal.
The price can move due to a wide range of factors. Geopolitical instability or fears of a deep recession can quickly make Gold price escalate due to its safe-haven status. As a yield-less asset, Gold tends to rise with lower interest rates, while higher cost of money usually weighs down on the yellow metal. Still, most moves depend on how the US Dollar (USD) behaves as the asset is priced in dollars (XAU/USD). A strong Dollar tends to keep the price of Gold controlled, whereas a weaker Dollar is likely to push Gold prices up.