The main tag of GoldPrice Articles.
You can use the search box below to find what you need.
[wd_asp id=1]
The main tag of GoldPrice Articles.
You can use the search box below to find what you need.
[wd_asp id=1]
Spot Gold peaked at $3,895.29 on Wednesday, a fresh all-time high. The bright metal rallied on news that the United States (US) government effectively shut down on Wednesday, as Congress was unable to agree on a funding bill. The US Dollar (USD) fell against all major rivals, with safe-haven assets benefiting the most.
Republicans and Democrats have different views on how to re-fund the federal government, and the irreconcilable differences persist. Mid-Wednesday, the Senate voted once again not to advance the Democratic-backed resolution to fund the government for a few weeks.
Meanwhile, US data was mixed. On the one hand, ADP released the Employment Change report, which showed the private sector lost 32,000 job positions in September, much worse than the 50,000 gain anticipated by market participants. The report also reported a 3,000 position loss in August, downwardly revised from a previously reported 54,000 increase.
On the other hand, the ISM Manufacturing Purchasing Managers’ Index (PMI) came in slightly better than anticipated, printing at 49.1 in September vs expectations of 49 and the previous 48.7.
The dismal mood eased after Wall Street’s opening, as stocks shrugged off concerns. The three major indexes trade in the green, weighing on the bright metal. The XAU/USD pair also retreated on modest USD demand.
Most of the US data scheduled for the rest of the risk will hardly see the light if the shutdown persists. In such a scenario, then, Gold is likely to remain attractive and challenge the $4,000 mark.
XAU/USD trades around $3,870, and technical readings in the daily chart show that it keeps posting higher highs, in line with the dominant bullish trend. The Relative Strength Index (RSI) remains at extreme readings, ticking marginally higher at around 81 but mostly flat. The Momentum indicator, in the meantime, resumed its advance above its 100 line, with plenty of room to advance. Finally, the pair keeps rallying above all bullish moving averages, with the nearest being the 20 Simple Moving Average (SMA), currently at $3,699.
The 4-hour chart shows XAU/USD has corrected overbought readings, while the risk remains skewed to the upside. The RSI indicator turned flat after easing sub-70, while the Momentum indicator still aims south, although well above its 100 line while losing downward steam. Finally, moving averages maintain their upward slopes well below the current level, with the 20 SMA providing support at around $3,828.
Support levels: 3,853.25 3,828.00 3,807.05
Resistance levels: 3,895.00 3,910.00 3,930.00
Natural gas price activated with the main indicators’ positivity, breaching the resistance at $3.290 level, to settle within the main bullish channel’s levels, achieving some gains by reaching 3.365.
Forming main support at $3.280 level, besides the continuation of providing positive momentum by the main indicators, we expect forming a new bullish rally to surpass $3.410 level, to target the next station at 3.350.
The expected trading range for today is between $3.300 and $3.530
Trend forecast: Bullish
The (ETHUSD) price settled with gains in its last intraday trading, amid the dominance of the bullish correctional trend on the short-term basis and its trading alongside supportive trend line for this track, with the continuation of the positive pressure due to its trading above EMA50, representing dynamic support that helps the price rise, with the positive divergence on the relative strength indicators, after reaching oversold levels, exaggeratedly compared to the price move, with the emergence of the positive signals from them.
Get high-accuracy trading signals delivered directly to your Telegram. Subscribe to specialized packages tailored for the world’s top markets:
Full VIP signals performance report for September 22–26, 2025:
Gold keeps its record-setting rally intact early Wednesday, consolidating near lifetime highs above $3,870 as the United States (US) heads for an imminent government shutdown.
Kicking off the final quarter of 2025 on a bullish note, Gold buyers refuse to give up and flex their muscles as the US government funding expires at 04:00 GMT on Wednesday, with the Republicans and Democrats unlikely to strike a last-minute interim deal.
The last government shutdown stretched from December 22, 2018, to January 25, 2019, lasting 35 days – during US President Donald Trump’s first term.
The immediate effect of a government shutdown will likely be the delay in the monthly labor market report, scheduled for this Friday, which is critical for the markets to gauge whether the US Federal Reserve will remain on track for two additional interest rate cuts this year.
Markets are fully pricing in a 25 basis points (bps) Fed rate cut later this month, the CME Group’s FedWatch Tool shows.
A likelihood of prolonged uncertainty on the US fiscal and monetary policy front is expected to rattle investors’ confidence in the US assets, including the US Dollar (USD), fuelling an increased rush to safety in the traditional safe haven Gold.
Meanwhile, the Greenback is also reeling from the pain of a mixed reading for the Bureau of Labor Statistics’ (BLS) Job Openings and Labor Turnover Survey (JOLTS). The report showed US openings increased marginally by 19,000 in August, while hiring declined, consistent with a softening labor market.
All eyes now remain on the US government shutdown scenario and its likely impact on the broader market sentiment. If a shutdown happens, the US private sector payrolls by the Automatic Data Processing (ADP) will hog the limelight on Wednesday, in the absence of the US Nonfarm Payrolls (NFP) release this Friday.
The US ISM Manufacturing PMI and speeches from Fed policymakers could also drive the sentiment around Gold price.
As observed on the four-hour chart, the 14-day Relative Strength Index (RSI) remains within the bullish territory, currently near 68.
Therefore, the leading indicator suggests that Gold still has more room to the upside, and that any dip could be quickly bought in.
However, if buyers refuse to give up, buyers yearn for acceptance above the $3,870 level on a daily closing basis to resume the bullish momentum.
The next topside hurdle is located at the $3,900 barrier as the hunt for the $4,000 mark remains on the radar.
Conversely, any retracement pullback could test the initial support at $3,806, the 21-Simple Moving Average (SMA), below which the 50-SMA at $3,763 would be tested.
Deeper correction could target the September 24 low at $3,718, followed by the 100-SMA at $3,708.
Monetary policy in the US is shaped by the Federal Reserve (Fed). The Fed has two mandates: to achieve price stability and foster full employment. Its primary tool to achieve these goals is by adjusting interest rates.
When prices are rising too quickly and inflation is above the Fed’s 2% target, it raises interest rates, increasing borrowing costs throughout the economy. This results in a stronger US Dollar (USD) as it makes the US a more attractive place for international investors to park their money.
When inflation falls below 2% or the Unemployment Rate is too high, the Fed may lower interest rates to encourage borrowing, which weighs on the Greenback.
The Federal Reserve (Fed) holds eight policy meetings a year, where the Federal Open Market Committee (FOMC) assesses economic conditions and makes monetary policy decisions.
The FOMC is attended by twelve Fed officials – the seven members of the Board of Governors, the president of the Federal Reserve Bank of New York, and four of the remaining eleven regional Reserve Bank presidents, who serve one-year terms on a rotating basis.
In extreme situations, the Federal Reserve may resort to a policy named Quantitative Easing (QE). QE is the process by which the Fed substantially increases the flow of credit in a stuck financial system.
It is a non-standard policy measure used during crises or when inflation is extremely low. It was the Fed’s weapon of choice during the Great Financial Crisis in 2008. It involves the Fed printing more Dollars and using them to buy high grade bonds from financial institutions. QE usually weakens the US Dollar.
Quantitative tightening (QT) is the reverse process of QE, whereby the Federal Reserve stops buying bonds from financial institutions and does not reinvest the principal from the bonds it holds maturing, to purchase new bonds. It is usually positive for the value of the US Dollar.
While strength has been confirmed, natural gas now confronts a decision zone. The ABCD measured move symmetry between the rising AB and CD legs aligns with the 100% projected target at $3.34. This creates the possibility of a pivot and pullback, especially since a lower gap remains unfilled and the market has yet to revisit the 20-Day and 50-Day moving averages for support. These moving averages, converging near $3.00, represent important levels to watch if selling pressure emerges.
A strong daily close above today’s high could open the door to higher levels. The next upside zone lies near the 200-Day moving average at $3.49, reinforced by the 127.2% ABCD projection at $3.50. The overlap of multiple indicators at this level strengthens its potential importance as resistance. Before that target is reached, however, natural gas must break decisively above a descending trendline, a move that would further confirm strengthening demand.
The interaction with the long-term uptrend line has turned into a bullish signal. A sustained close above the 200-Day average would mark a significant shift in trend dynamics and encourage further bullish momentum. Until then, the $3.25 level serves as immediate support, while the $3.34–$3.35 area defines the near-term decision point for traders.
For a look at all of today’s economic events, check out our economic calendar.
Crude benchmarks are retreating sharply, with West Texas Intermediate sliding 2.82% to $61.69 per barrel and Brent down 2.48% to $65.33. The drop was ignited by reports that Saudi Arabia is pressing OPEC+ ministers to accelerate the reinstatement of 1.66 million barrels per day of supply that had been cut under voluntary quotas. This proposal, now expected to dominate the upcoming OPEC+ virtual meeting, represents a strategic pivot from defending prices toward reclaiming market share, underscoring Riyadh’s willingness to test downside resilience in the oil market.
Fresh EIA data showed a 2.4 million barrel build in U.S. commercial crude stockpiles last week, defying expectations of a draw and amplifying pressure on prices. Refineries moving into seasonal maintenance reduced throughput, aggravating the supply overhang. Gasoline prices also reflected weakness, down nearly 2.85% to $1.95 per gallon. Together, these figures undermine the short-term bullish case and support the market’s view that a glut may form even if OPEC+ decides not to accelerate its supply hike.
Lower prices are stimulating bargain hunting in Asia. Imports across the continent are rising, with India playing a pivotal role. The country’s top refiner, IOC, bypassed U.S. crude at its latest tender, instead securing West African and Middle Eastern barrels. This pivot reflects the narrow arbitrage between WTI and seaborne alternatives but also signals how pricing in Asia can quickly reshape flows. India continues to buy Russian oil aggressively, taking advantage of deepening discounts as Russia struggles with refining outages caused by Ukrainian drone strikes.
Oil’s weakness is not purely supply-driven. Ongoing geopolitical risk, from Venezuelan military confrontations in the Caribbean to Houthi missile activity near Saudi lanes, is simmering in the background. Yet the overriding narrative is excess supply, not disrupted flows. Analysts warn that if Brent breaks below $65 and WTI under $60, psychological thresholds could fuel momentum selling. ING projects OPEC+ will keep production unchanged, but Saxo Bank highlights a “floor” around current prices, arguing that disruptions in Iraq and Kazakhstan—both exceeding quotas—could cap downside. Still, Saudi Arabia’s push suggests the kingdom sees current demand elasticity as too fragile to support a rally, particularly with Chinese demand showing signs of slowing.
With OPEC+ having already unwound 2.2 million barrels per day of cuts this year, the market is now staring at the potential of another rapid flood of supply. The result is a widening consensus that oil could revisit levels not seen since 2021. Traders are now debating whether CL=F will retest $60, a level that could trigger U.S. shale producers to reconsider drilling programs, or whether Brent (BZ=F) stabilizes near $65 with support from Asian imports. For investors, the equation is clear: while supply-driven weakness creates a bearish short-term setup, any reversal in OPEC+ policy or geopolitical flare-up could flip sentiment instantly.
In last week’s forecast, we outlined the potential for gold to break above $3,800 once buyers defended the $3,791–$3,758 Fair Value Gap. That roadmap has now unfolded: XAU/USD surged decisively to fresh all-time highs, confirming the bullish structure that had been building.
The breakout was also highlighted in our recent YouTube market update, where we anticipated the conditions for gold’s upside momentum. That projection has since been validated in price action, with gold bulls taking full control.
The Federal Reserve’s latest 25 bps rate cut has once again reduced real yields, directly fueling gold’s rise. Investors are no longer just pricing in the cut itself—they’re positioning for a series of further adjustments into year-end. This repricing of U.S. interest rate expectations has made non-yielding assets like gold more attractive.
What makes this policy tailwind more powerful is the Fed’s balance of language: while acknowledging inflation risks, officials have been forced to weigh a slowing labor market and softer business activity. Markets are leaning toward at least two more cuts before December, leaving gold well-supported on dips.
Gold’s surge into record territory is not a short-lived anomaly—it’s the culmination of several converging forces:
Combined, these forces have built the perfect backdrop for gold’s historic breakout—fueling momentum not just from speculators, but also from long-term strategic buyers.
Gold’s underlying structure and demand profile tilt decisively toward the upside, making bullish setups far more favorable than shorting attempts:
Short plays may exist tactically in overheated conditions, but the macro and structural landscape continues to favor the bulls.

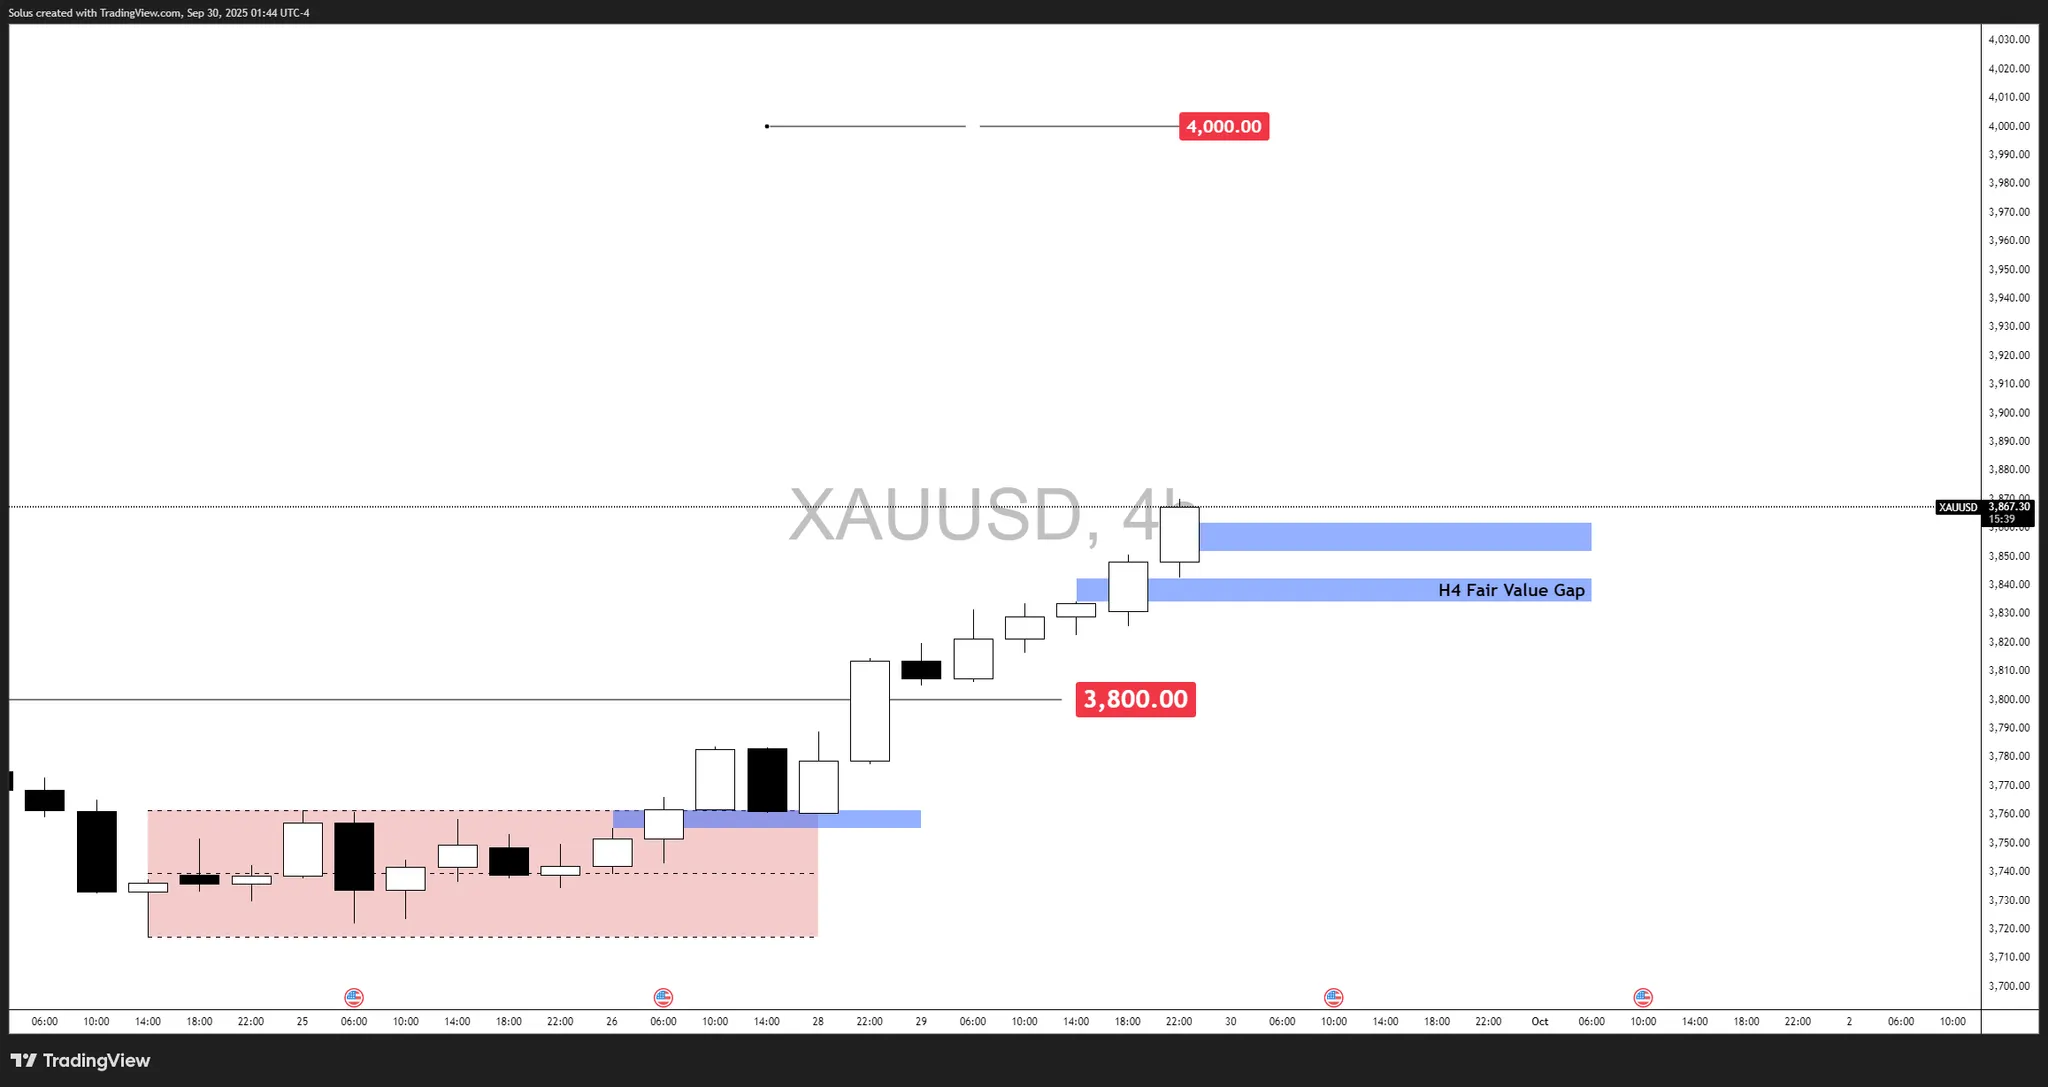
Gold has confirmed its breakout above $3,800, with momentum carrying price to fresh highs near $3,860. On the H4 chart, price action shows a clean displacement to the upside, leaving behind a Fair Value Gap (FVG) around $3,825–$3,835 that now acts as immediate demand. This gap, alongside the $3,800 breakout level, forms the first line of defense for bulls.
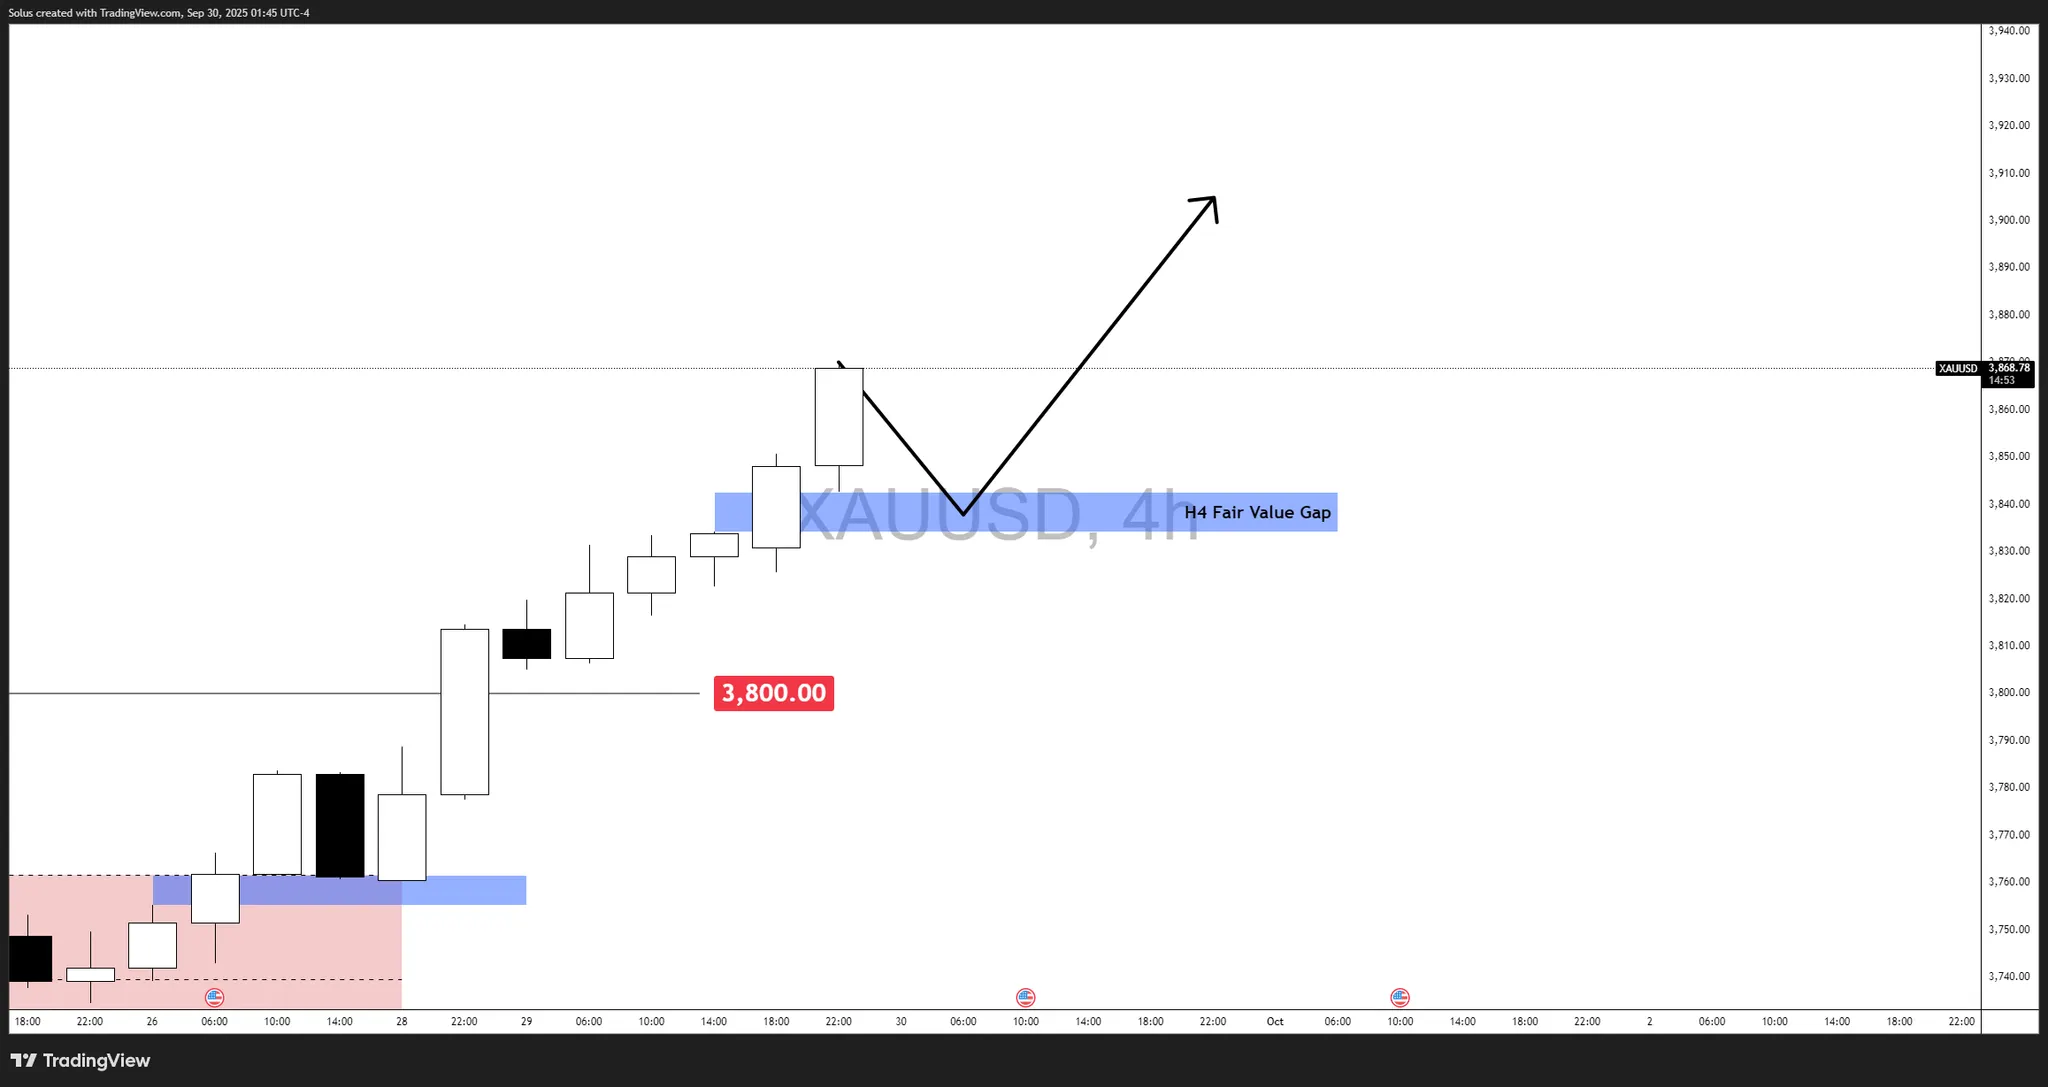
Gold’s breakout above $3,800 has left behind an H4 Fair Value Gap at $3,825–$3,835, which now acts as a potential springboard for further upside. If price pulls back into this zone and finds support, buyers are likely to step back in with conviction.
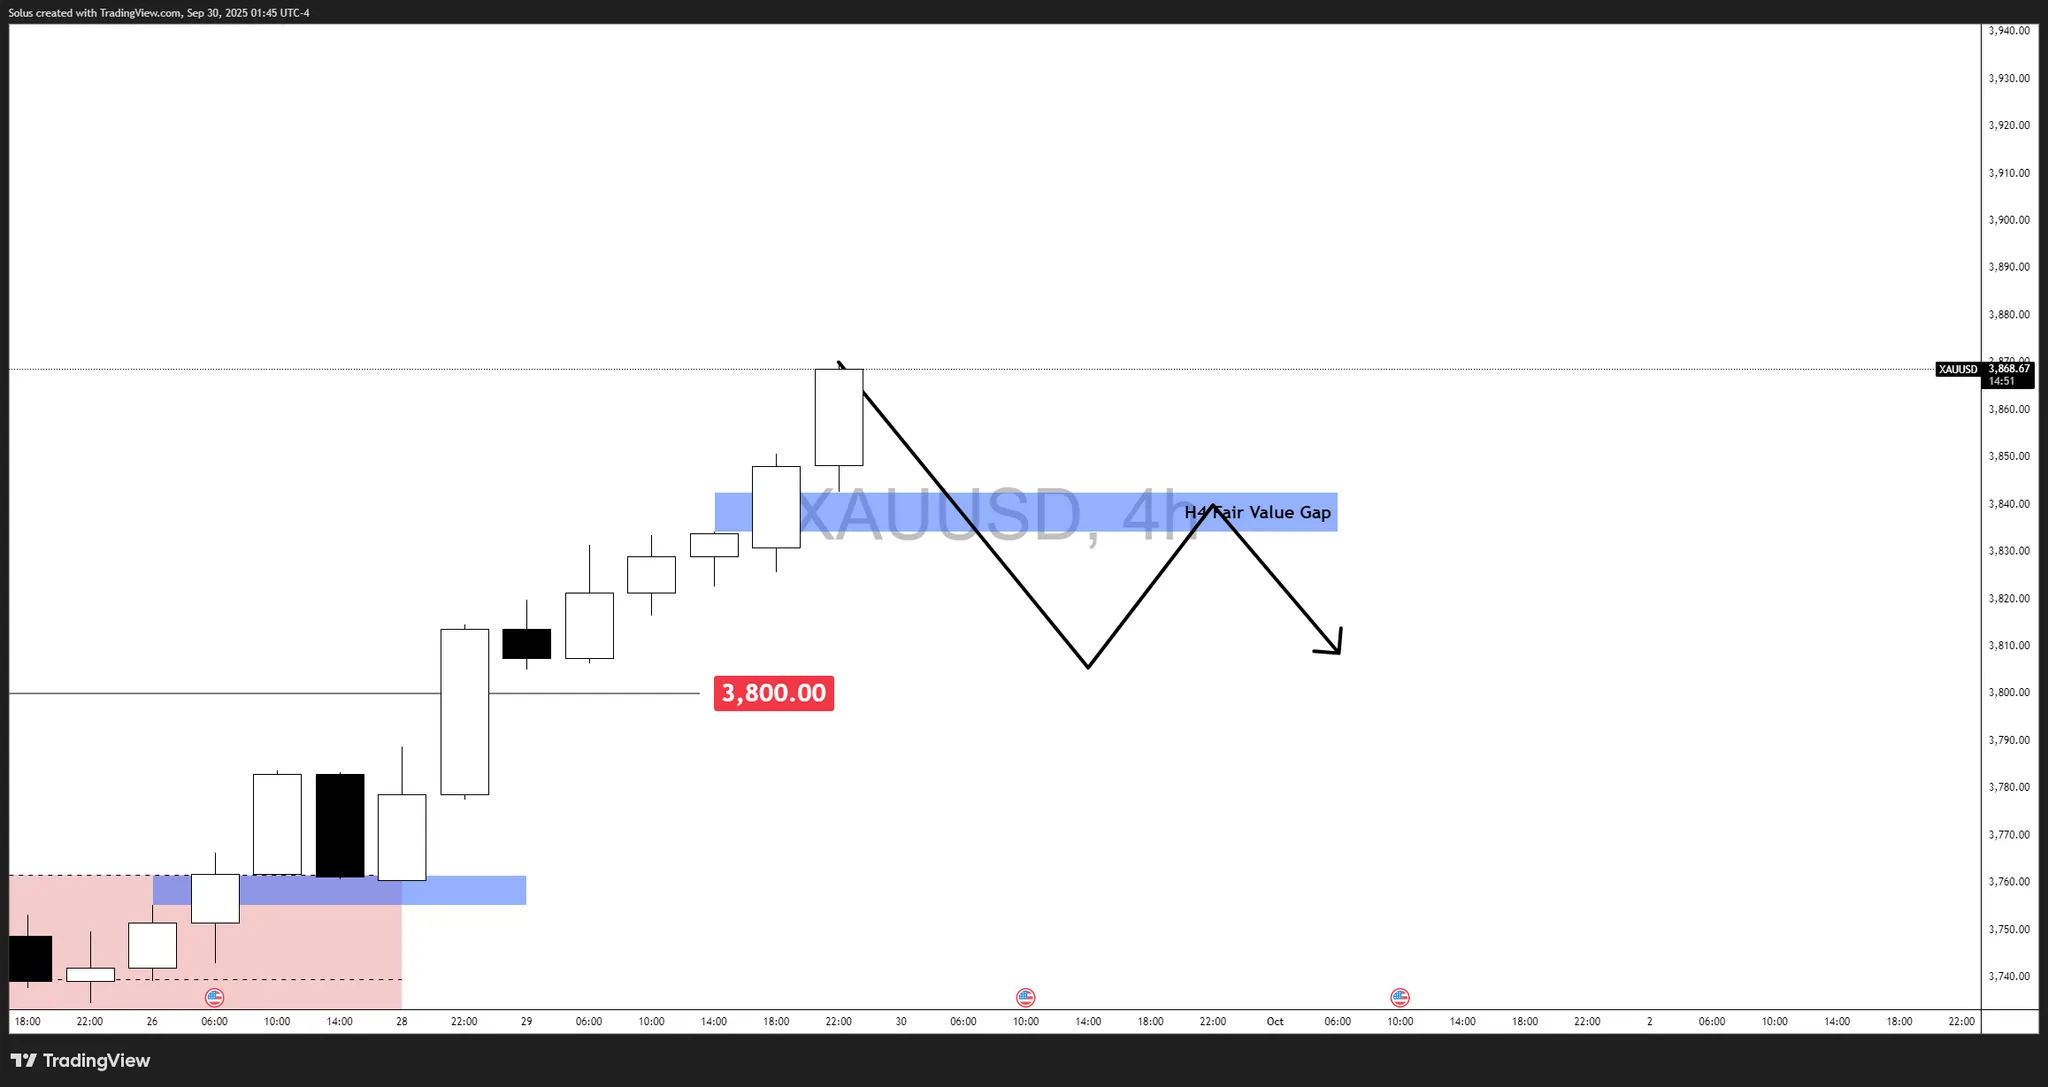
If the H4 Fair Value Gap at $3,825–$3,835 fails to attract strong buyers, gold risks turning lower in a corrective phase. A clean rejection from this zone would indicate sellers are defending premium pricing after the breakout.
Gold has delivered exactly as forecasted—breaking through $3,800 and setting new records. With Fed policy acting as a steady tailwind, structural central bank demand, and persistent safe-haven flows, the metal’s bullish case far outweighs any shorting attempts. Unless a hawkish Fed shock emerges or inflation data flips the script, the path of least resistance remains upward.
The EURJPY pair activated with stochastic intraday negativity, to keep its stability below the barrier at 175.20, providing correctional trading by reaching 174.00.
Note that the current decline will not affect the bullish scenario due to the stability of the extra support at 173.40, therefore, we will keep waiting for gaining the positive momentum to ease the mission of surpassing the barrier and targeting new positive stations that might extend to 175.60 and 176.00, while breaking the extra support will confirm its surrender to the bearish correctional track, forcing it to suffer extra losses by reaching 172.60.
The expected trading range for today is between 173.65 and 174.85
Trend forecast: Fluctuated within the bullish track


 and Brent (BZ=F) Sink Below on OPEC+ Supply Push?")
