The main tag of GoldPrice Articles.
You can use the search box below to find what you need.
[wd_asp id=1]
The main tag of GoldPrice Articles.
You can use the search box below to find what you need.
[wd_asp id=1]
Gold keeps marching higher on Tuesday and has reached a fresh all-time high above $3,650. The pair, however, looks beyond overstretched after a 10% rally from August 20, with most timeframes heavily overbought, sending a severe warning for buyers.
The precious metal is drawing support from market expectations of a sharp cut in US employment figures at today’s BLS Benchmark Nonfarm Payrolls Revision, due later on the day. Market sources have flagged a slash of 800,000 jobs, which would add pressure on the Fed to cut rates by 50 basis points next week.
A look at the 4-hour chart and we see all the ingredients for a downwards correction. The Relative Strength Index, near the 80 level and showing a bearish divergence, suggests that the pair might need to come down before rallying further.
To the upside, immediate resistance is at the intraday high of $3,658. Further up, the 265.8% retracement of the September 3-4 reversal, at the $3,690 area, might be a plausible target ahead of the $3,700 round level.
A bearish reversal from these levels is likely to find support at the intra-day low of $3.630 ahead of the September 8 low, at $3580 and the September 4 low, at $3,515.
Gold has played a key role in human’s history as it has been widely used as a store of value and medium of exchange. Currently, apart from its shine and usage for jewelry, the precious metal is widely seen as a safe-haven asset, meaning that it is considered a good investment during turbulent times. Gold is also widely seen as a hedge against inflation and against depreciating currencies as it doesn’t rely on any specific issuer or government.
Central banks are the biggest Gold holders. In their aim to support their currencies in turbulent times, central banks tend to diversify their reserves and buy Gold to improve the perceived strength of the economy and the currency. High Gold reserves can be a source of trust for a country’s solvency. Central banks added 1,136 tonnes of Gold worth around $70 billion to their reserves in 2022, according to data from the World Gold Council. This is the highest yearly purchase since records began. Central banks from emerging economies such as China, India and Turkey are quickly increasing their Gold reserves.
Gold has an inverse correlation with the US Dollar and US Treasuries, which are both major reserve and safe-haven assets. When the Dollar depreciates, Gold tends to rise, enabling investors and central banks to diversify their assets in turbulent times. Gold is also inversely correlated with risk assets. A rally in the stock market tends to weaken Gold price, while sell-offs in riskier markets tend to favor the precious metal.
The price can move due to a wide range of factors. Geopolitical instability or fears of a deep recession can quickly make Gold price escalate due to its safe-haven status. As a yield-less asset, Gold tends to rise with lower interest rates, while higher cost of money usually weighs down on the yellow metal. Still, most moves depend on how the US Dollar (USD) behaves as the asset is priced in dollars (XAU/USD). A strong Dollar tends to keep the price of Gold controlled, whereas a weaker Dollar is likely to push Gold prices up.
The (silver) price declined in its last intraday trading, affected by the stability of the critical resistance at $41.45, attempting to gain bullish momentum that might assist it to breach the resistance, and attempting to offload the clear overbought conditions on the (RSI), after reaching overbought levels, amid the continuation of the positive pressure due to its trading above EMA50, and under the dominance of the main bullish trend and its trading alongside a minor bias line on the short term basis that supports this trend.
Get high-accuracy trading signals delivered directly to your Telegram. Subscribe to specialized packages tailored for the world’s top markets:
Full VIP signals performance report for September 1–5, 2025:
Silver (XAG/USD) trades under pressure on Tuesday, retreating from recent highs as a modest rebound in the US Dollar (USD) and Treasury yields weighs on the metal. At the time of writing, spot prices are trading near $40.85, down over 1% on the day.
The white metal has been trapped in a tight band between $41.50 and $40.50 since last week, after hitting a fresh 14-year peak around $41.67 on Monday. While the pullback reflects profit-taking and short-term USD strength, the downside remains limited as markets are almost fully convinced that the Federal Reserve (Fed) will lower interest rates at its September 17 monetary policy meeting. Lower borrowing costs reduce the opportunity cost of holding non-yielding assets such as Silver, keeping the broader bullish tone intact.
The uptick in the Greenback comes despite the recent downward revision to US Nonfarm Payrolls (NFP), which confirmed that the labor market is losing momentum. Economists highlighted that the slowdown reflects businesses turning cautious, with some warning that the economy is edging closer to recessionary conditions. The US Dollar Index (DXY), which tracks the currency against a basket of six peers, is trading around 97.70 after staging a technical rebound from seven-week lows touched earlier in the day.
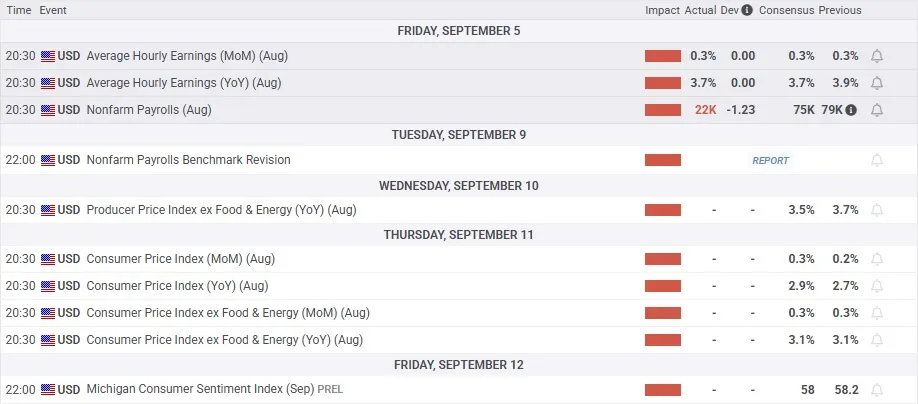
Attention now turns to this week’s key inflation releases. The US Producer Price Index (PPI) will be published on Wednesday, followed by the Consumer Price Index (CPI) on Thursday, both of which are expected to shape expectations for the Fed’s policy outlook.
Technically, XAG/USD is struggling to extend its rally, with momentum indicators flashing caution. On the daily chart, the Relative Strength Index (RSI) is easing from overbought territory and showing bearish divergence, as price carved out higher highs while the oscillator printed lower highs. This divergence often precedes corrective pullbacks, highlighting fading upside momentum. The Average True Range (ATR) remains muted near 0.81, suggesting limited volatility in the short term, though a break outside the $41.50-$40.50 band could trigger a sharper move.
The first line of defense sits at $40.50, followed by the 21-day Simple Moving Average (SMA) at $39.24. Deeper losses could target the 50-day SMA near $38.40. On the upside, a sustained move above $41.70 would reduce the significance of the divergence and open the door toward the $42.00 psychological barrier.
Silver is a precious metal highly traded among investors. It has been historically used as a store of value and a medium of exchange. Although less popular than Gold, traders may turn to Silver to diversify their investment portfolio, for its intrinsic value or as a potential hedge during high-inflation periods. Investors can buy physical Silver, in coins or in bars, or trade it through vehicles such as Exchange Traded Funds, which track its price on international markets.
Silver prices can move due to a wide range of factors. Geopolitical instability or fears of a deep recession can make Silver price escalate due to its safe-haven status, although to a lesser extent than Gold’s. As a yieldless asset, Silver tends to rise with lower interest rates. Its moves also depend on how the US Dollar (USD) behaves as the asset is priced in dollars (XAG/USD). A strong Dollar tends to keep the price of Silver at bay, whereas a weaker Dollar is likely to propel prices up. Other factors such as investment demand, mining supply – Silver is much more abundant than Gold – and recycling rates can also affect prices.
Silver is widely used in industry, particularly in sectors such as electronics or solar energy, as it has one of the highest electric conductivity of all metals – more than Copper and Gold. A surge in demand can increase prices, while a decline tends to lower them. Dynamics in the US, Chinese and Indian economies can also contribute to price swings: for the US and particularly China, their big industrial sectors use Silver in various processes; in India, consumers’ demand for the precious metal for jewellery also plays a key role in setting prices.
Silver prices tend to follow Gold’s moves. When Gold prices rise, Silver typically follows suit, as their status as safe-haven assets is similar. The Gold/Silver ratio, which shows the number of ounces of Silver needed to equal the value of one ounce of Gold, may help to determine the relative valuation between both metals. Some investors may consider a high ratio as an indicator that Silver is undervalued, or Gold is overvalued. On the contrary, a low ratio might suggest that Gold is undervalued relative to Silver.
Gold (XAU/USD) has broken into uncharted territory, climbing above $3,650 per ounce for the first time in history. Spot gold touched an intraday peak of $3,659.10, while futures on COMEX advanced to $3,687.30, marking a fresh all-time high. Earlier in the week, prices also spiked to $3,636.71, and U.S. gold futures settled near $3,676. The metal has now gained close to 38% year-to-date in 2025, building on an already hefty 27% rally in 2024.
The rally intensified after the Bureau of Labor Statistics revised U.S. payrolls down by 911,000 jobs for the 12 months through March. With unemployment hitting its highest level since 2021 and August payrolls delivering only 22,000 new jobs, traders are nearly unanimous in expecting rate cuts. The CME FedWatch tool is pricing in an 88% probability of a 25 bps cut and a 10% chance of a 50 bps cut at the September 16–17 FOMC meeting. A weaker jobs backdrop has historically reinforced demand for non-yielding assets like gold, as lower rates compress real yields.
Alongside monetary policy, persistent central bank buying continues to underpin prices. Institutions in China, Turkey, India, and Poland have been accumulating gold aggressively. UBS analysts project a climb toward $3,700 by mid-2026, while some strategists at Goldman Sachs suggest levels as high as $5,000 per ounce could be possible if confidence in U.S. Treasuries deteriorates further and even a modest share of capital rotates into bullion. The European Central Bank already confirmed that gold has overtaken the euro as the world’s second-largest reserve asset behind the dollar, highlighting its structural importance in reserve management.
Geopolitical factors are also at play. President Trump recently exempted gold from global tariff lists, shielding bullion from trade disputes that have hit other metals like tungsten and uranium. However, Trump’s aggressive push to reshape the Federal Reserve board — including attempts to remove Governor Lisa Cook — has raised alarms about central bank independence. Analysts argue that a weakened Fed could accelerate capital flight from Treasuries into gold. Political uncertainty in Europe, including the collapse of France’s government, has further boosted the safe-haven appeal of bullion.
The surge in gold isn’t confined to U.S. markets. In the Philippines, prices rose to ₱6,670.28 per gram and ₱207,469.70 per ounce, while in Australia, spot values above US$3,599 have driven a rush of prospecting activity. Veteran prospector Brent Shannon noted that nuggets worth $350,000 in 2020 would fetch $650,000–$700,000 today. The Perth Mint reported surging inflows from institutional clients, even as retail buyers of minted bars slowed purchases amid higher costs. In Victoria, gold tourism has exploded, attracting prospectors from Europe as bullion fever spreads globally.
Charts show gold breaking cleanly above a long-held ascending triangle, with $3,500 now acting as a structural floor. Analysts highlight $3,800 as the next measured target, with strong support forming between $3,570–$3,600. Momentum indicators confirm overbought conditions, but each pullback has been shallow, reflecting “buy the dip” appetite. As long as the Fed leans dovish, dips toward $3,550–$3,580 are likely to attract buyers.
The surge in bullion has filtered into mining stocks. Companies like Kinross Gold (NYSE:KGC), which recently reduced its stake in Asante Gold to 5.2% but still holds 36.9 million shares, remain leveraged to spot gains. Centerra Gold (TSX:CG) boosted exposure in Idaho by acquiring 9.9% of Liberty Gold (TSX:LGD), underscoring industry positioning for sustained high prices. At the same time, Dundee Sustainable Technologies reported upgrades in concentrate grade by 31% while cutting arsenic content 99%, aligning with rising ESG scrutiny in gold mining.
Gold’s breakout above $3,650 confirms a structurally bullish regime. With monetary easing nearly guaranteed, central banks stockpiling reserves, and geopolitical stress intensifying, the metal’s trajectory favors further gains toward $3,800–$4,000. Risks lie in potential Fed hesitation if inflation runs hotter, but the balance of probabilities remains skewed to the upside. Based on price action, macro drivers, and institutional positioning, XAU/USD remains a strong Buy.
Platinum price returned to settle above $1382.00 level, increasing the efficiency of the bullish track, fluctuating near the initial target at $1400.00, the continuation of the attempts to provide positive momentum by the main indicators will increase the chances of resuming the bullish attack, to expect its rally towards $1412.00, then attempts to press on the barrier near $1435.00.
While the price return to settle below $1382.00 will force it to delay the bullish attack and form new correctional waves, which forces it to suffer some of the losses before resuming the main bullish attack by reaching $1362.00.
The expected trading range for today is between $1382.00 and $ 1412.00
Trend forecast: Bullish

The technical analysis for this market is in a bit of flux right now, due to the fact that we could be trying to form some type of “double bottom”, and quite frankly, before the open outcry part of the session in America, it looked like that’s exactly what we are trying to do. The $62 level is a candidate for support, but we’ll have to wait and see whether or not that actually plays out. The $66 level is very clearly a major resistance barrier, and until something changes, it’s probably going to be somewhat difficult for market participants to drive the Light Sweet Crude Oil market above that level. Furthermore, we also have the 200 Day EMA dropping, and it will eventually find its way down to that area also.
If we were to break down below the $62 level, then it would make a bit of sense to anticipate that the $60 level could end up being support, mainly due to the fact that it is a large, round, psychologically significant figure. Anything below there could be rather ugly.
The biggest problem the crude oil has at the moment is the fact that Russia, OPEC, in the United States are all pumping massive amounts of crude oil into the market. With that being the case, market participants will continue to see a lot of downward pressure on price in general. Because of this, I still believe that even if we do form a bit of a range, it is probably more of the “sell the rips” type of environment. The first signs of exhaustion probably get sellers back into the market.
Ready to trade daily crude oil price analysis? We’ve shortlisted the best Forex Oil trading brokers in the industry for you.
Christopher Lewis has been trading Forex and has over 20 years experience in financial markets. Chris has been a regular contributor to Daily Forex since the early days of the site. He writes about Forex for several online publications, including FX Empire, Investing.com, and his own site, aptly named The Trader Guy. Chris favours technical analysis methods to identify his trades and likes to trade equity indices and commodities as well as Forex. He favours a longer-term trading style, and his trades often last for days or weeks.
Platinum price returned to settle above $1382.00 level, increasing the efficiency of the bullish track, fluctuating near the initial target at $1400.00, the continuation of the attempts to provide positive momentum by the main indicators will increase the chances of resuming the bullish attack, to expect its rally towards $1412.00, then attempts to press on the barrier near $1435.00.
While the price return to settle below $1382.00 will force it to delay the bullish attack and form new correctional waves, which forces it to suffer some of the losses before resuming the main bullish attack by reaching $1362.00.
The expected trading range for today is between $1382.00 and $ 1412.00
Trend forecast: Bullish
Gold’s latest leg higher came on the back of a decisively weak U.S. August jobs report and a quick repricing toward a September Fed rate cut. Spot gold printed fresh records near $3,600/oz and continues to hover just below that line as traders firm up odds of easing at the upcoming FOMC. Lower policy-rate expectations compress real yields and keep the dollar on the defensive—classic tailwinds for bullion.
Beyond the macro rates impulse, the structural bid is alive: central-bank buying (with fresh headlines pointing to continued PBoC additions in August) and elevated geopolitical risk have reinforced gold’s role as a portfolio hedge. That backdrop helped absorb profit-taking dips into the back half of last week.
In Monday’s outlook, we highlighted gold’s ability to reclaim layered H4 Fair Value Gaps as a structural foundation for further upside. That forecast has since materialized: buyers defended the $3,550–$3,560 shelf, and momentum carried price into a clean breakout sequence.
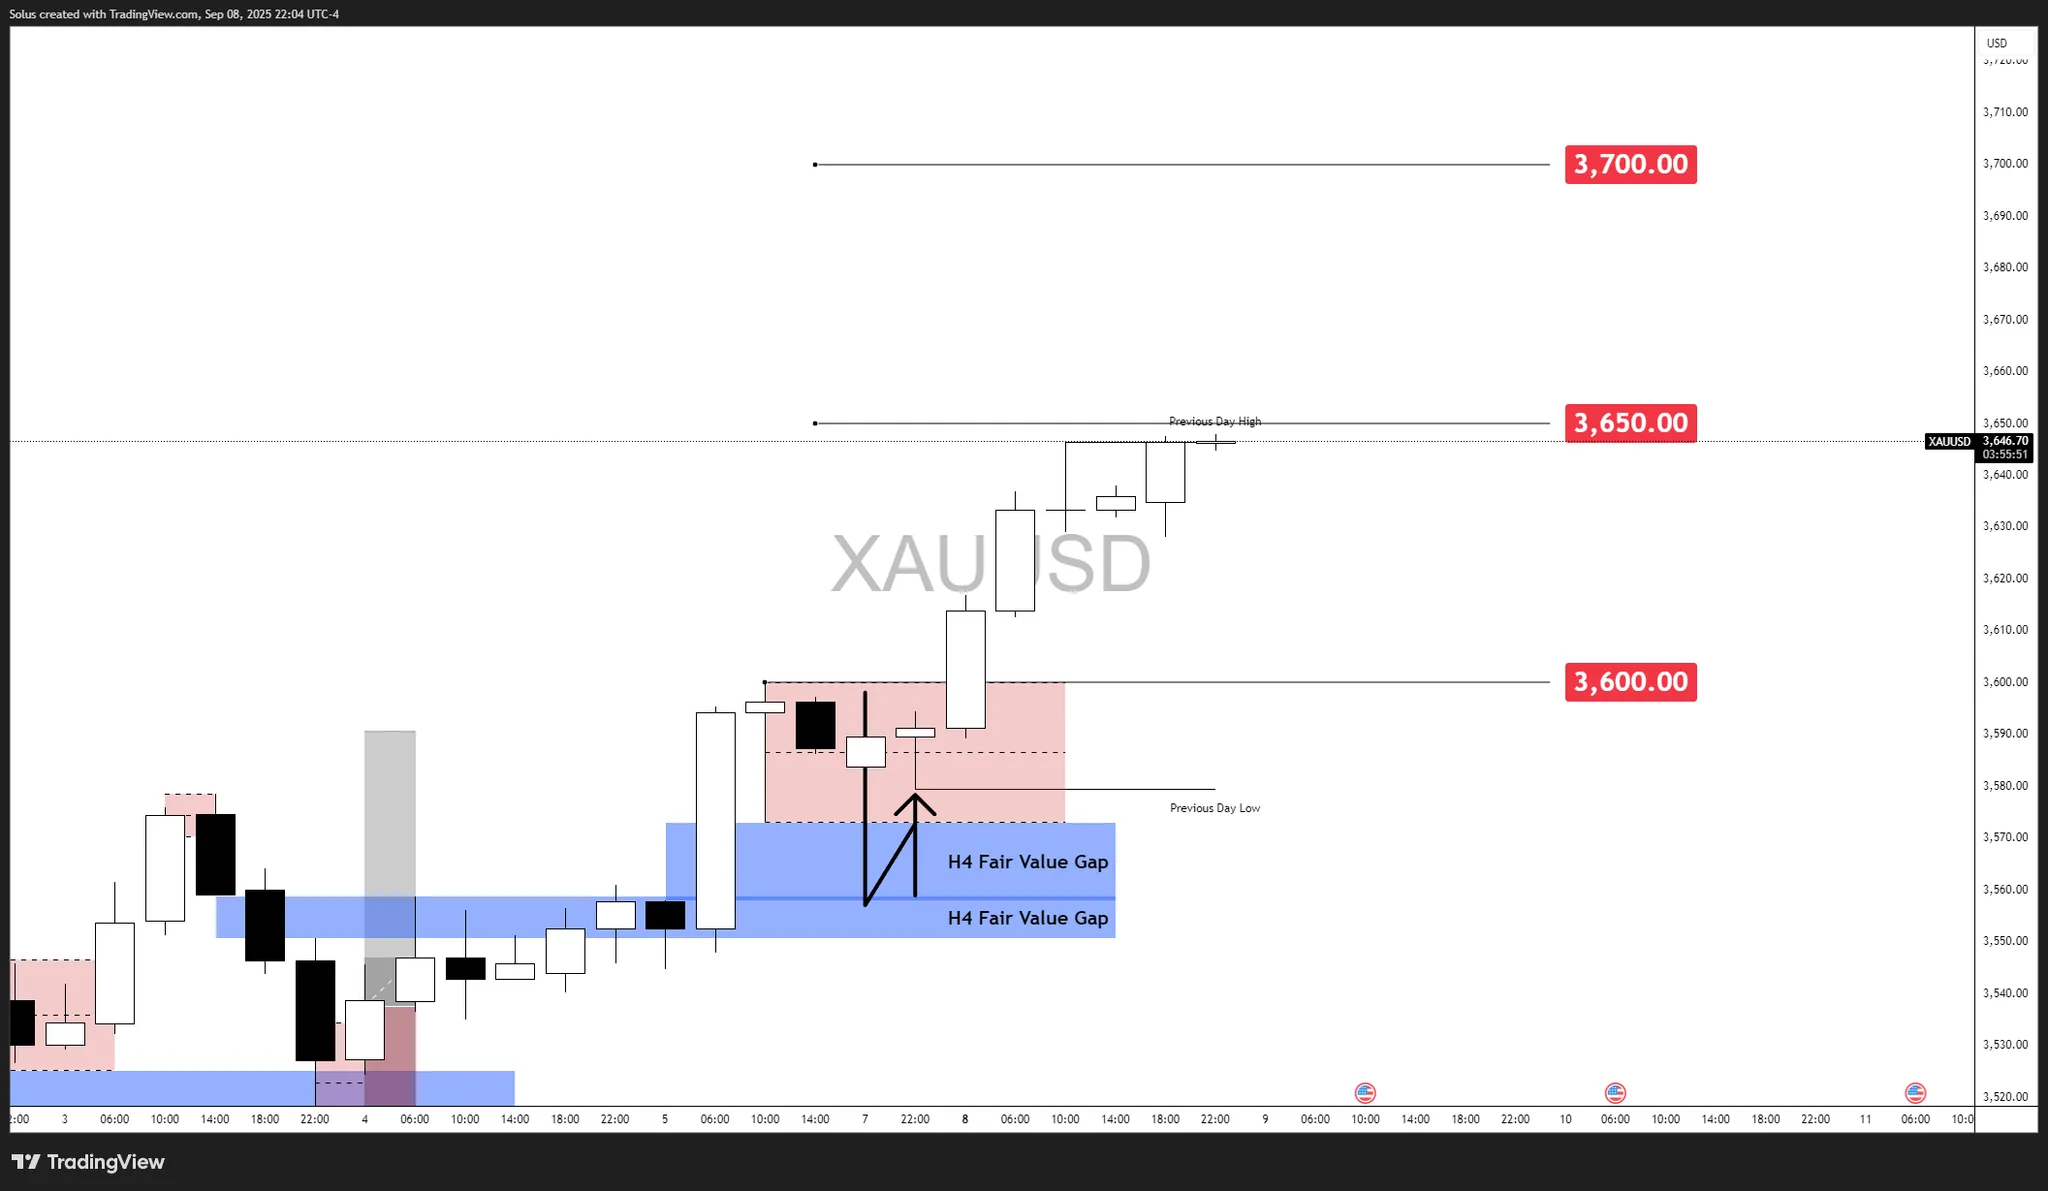
The move extended into the $3,640–$3,650 zone, aligning with our projected bullish continuation path. Each retest of intraday imbalances attracted fresh demand, confirming market conviction that dips remain buying opportunities. The current structure shows price consolidating just under $3,650 – the next pivotal resistance before $3,700 comes into view.
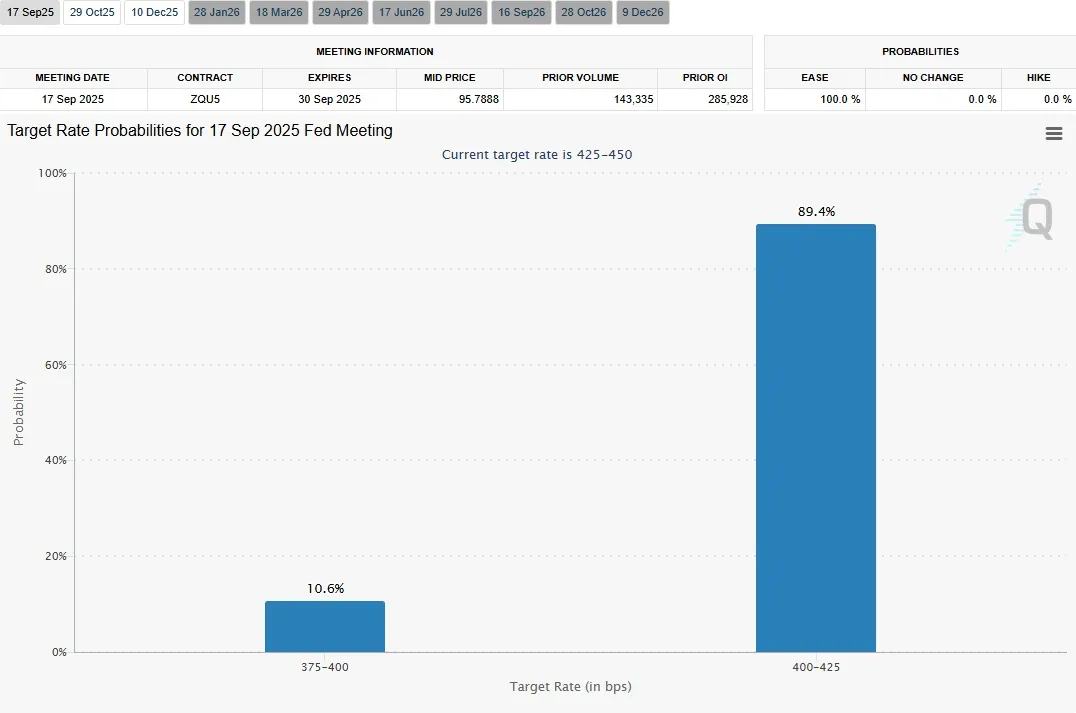
The CME FedWatch Tool now prices an 89% probability of a 25 bp Fed rate cut at the September 17 meeting, with a smaller 10% chance of a 50 bp move.
This overwhelmingly dovish repricing is critical for gold. A confirmed rate cut would:
Together, these dynamics create a macro backdrop where gold’s floor remains supported, even if technicals temporarily stretch into overbought territory. Traders will watch whether CPI/PPI confirm the Fed’s dovish path—cool inflation could propel gold beyond $3,650 toward the $3,700 target zone.
Rate expectations are the beating heart of this move. With FedWatch showing nearly 90% odds of easing, gold has a clear policy-driven tailwind. Pair that with central-bank accumulation and risk-hedging flows, and dips have struggled to develop follow-through. If CPI/PPI confirm a cooling trend, the path of least resistance remains higher into the Fed meeting.
Gold’s is consolidating beneath the $3,650 resistance, with multiple H4 Fair Value Gaps (FVGs) forming below current levels.
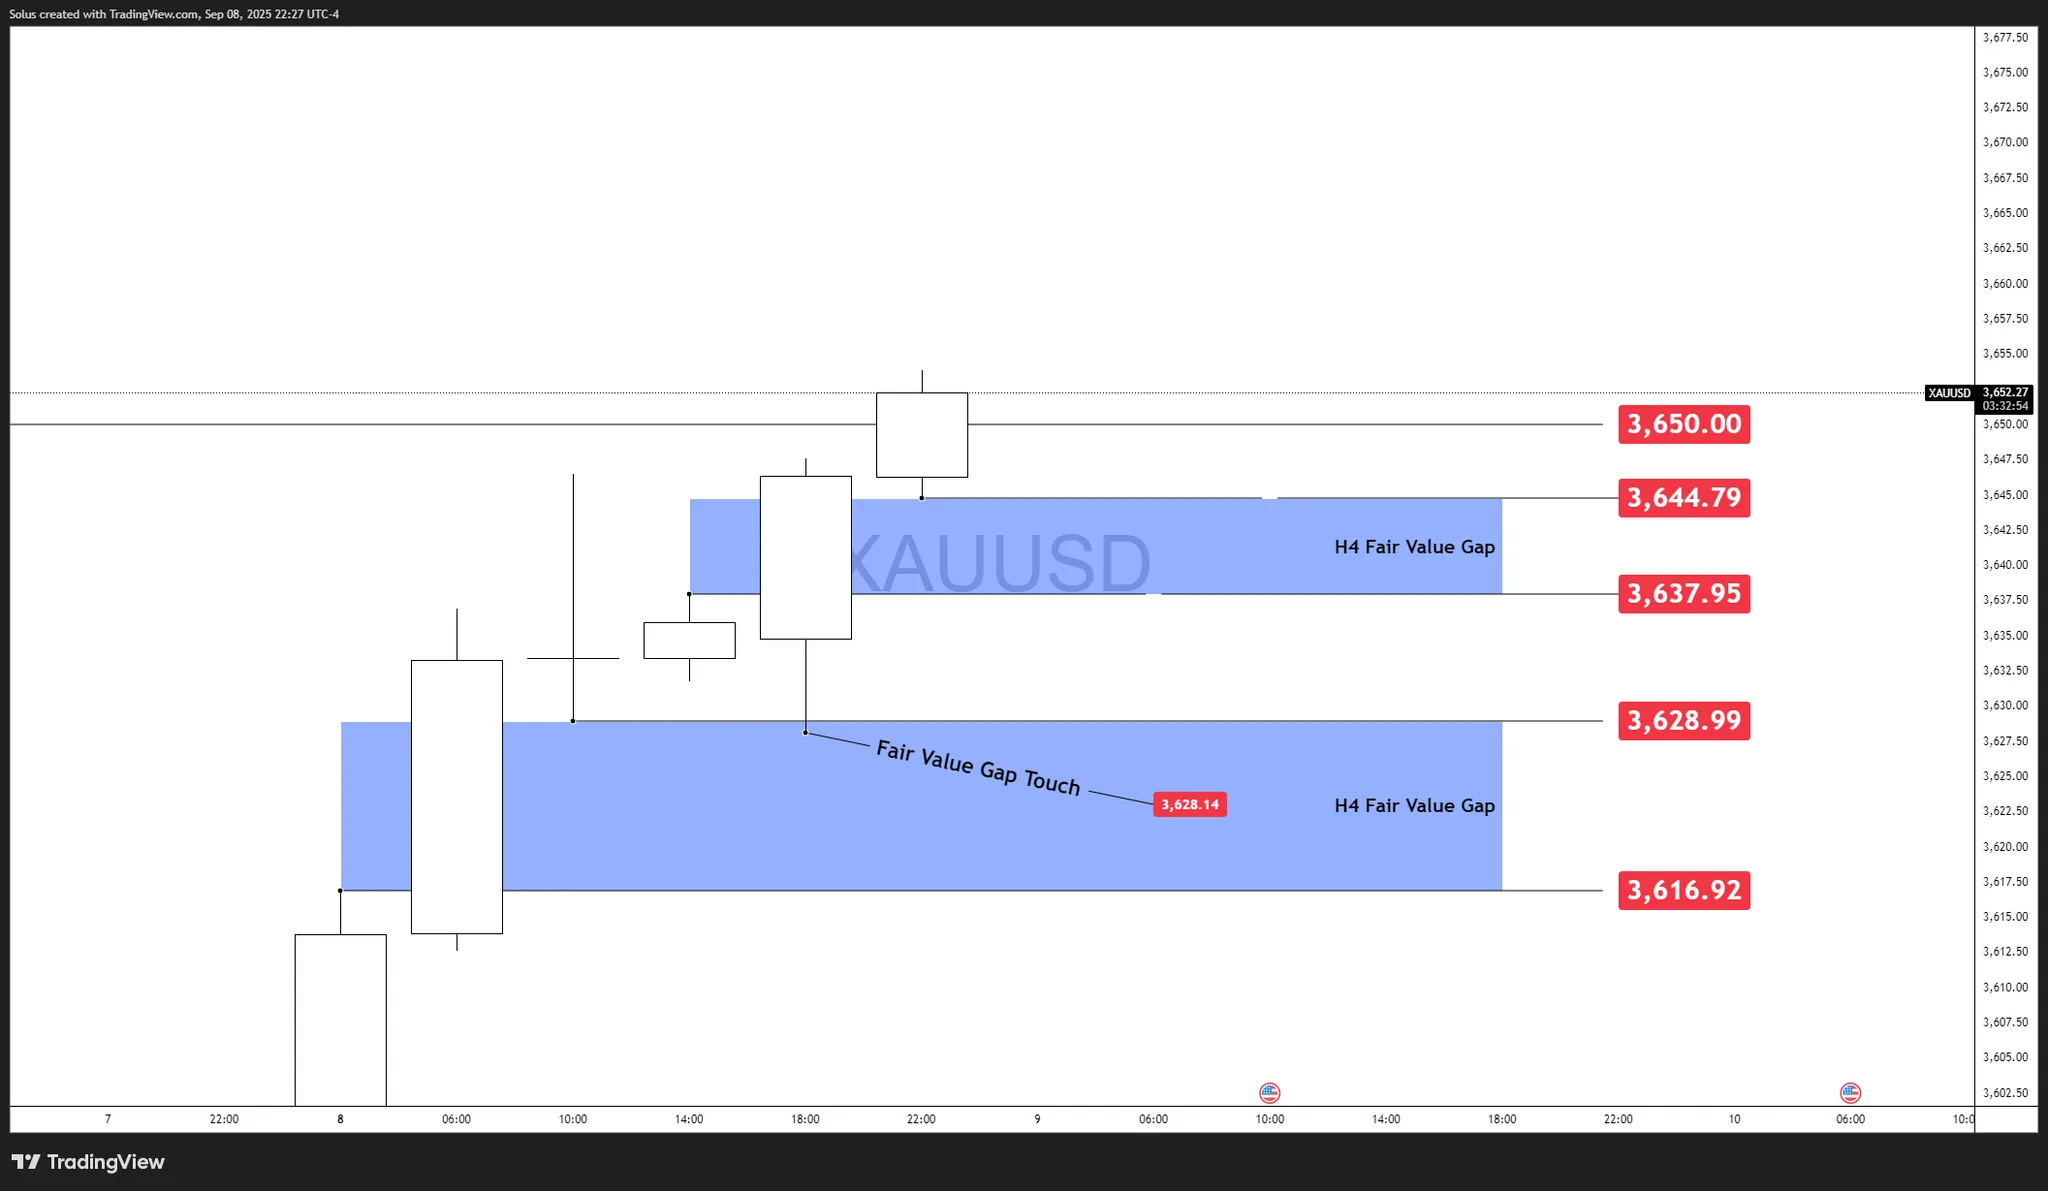
Prior to this move, the FVG at $3,630 – $3,616 served as a point-of-interest for bounce to the upside.
These FVGs between $3,616 – $3,645 are pivotal zones where buyers may attempt to step back in if price retraces. The reaction at these imbalances will dictate whether gold clears $3,650 for continuation or fades back into deeper retracement.
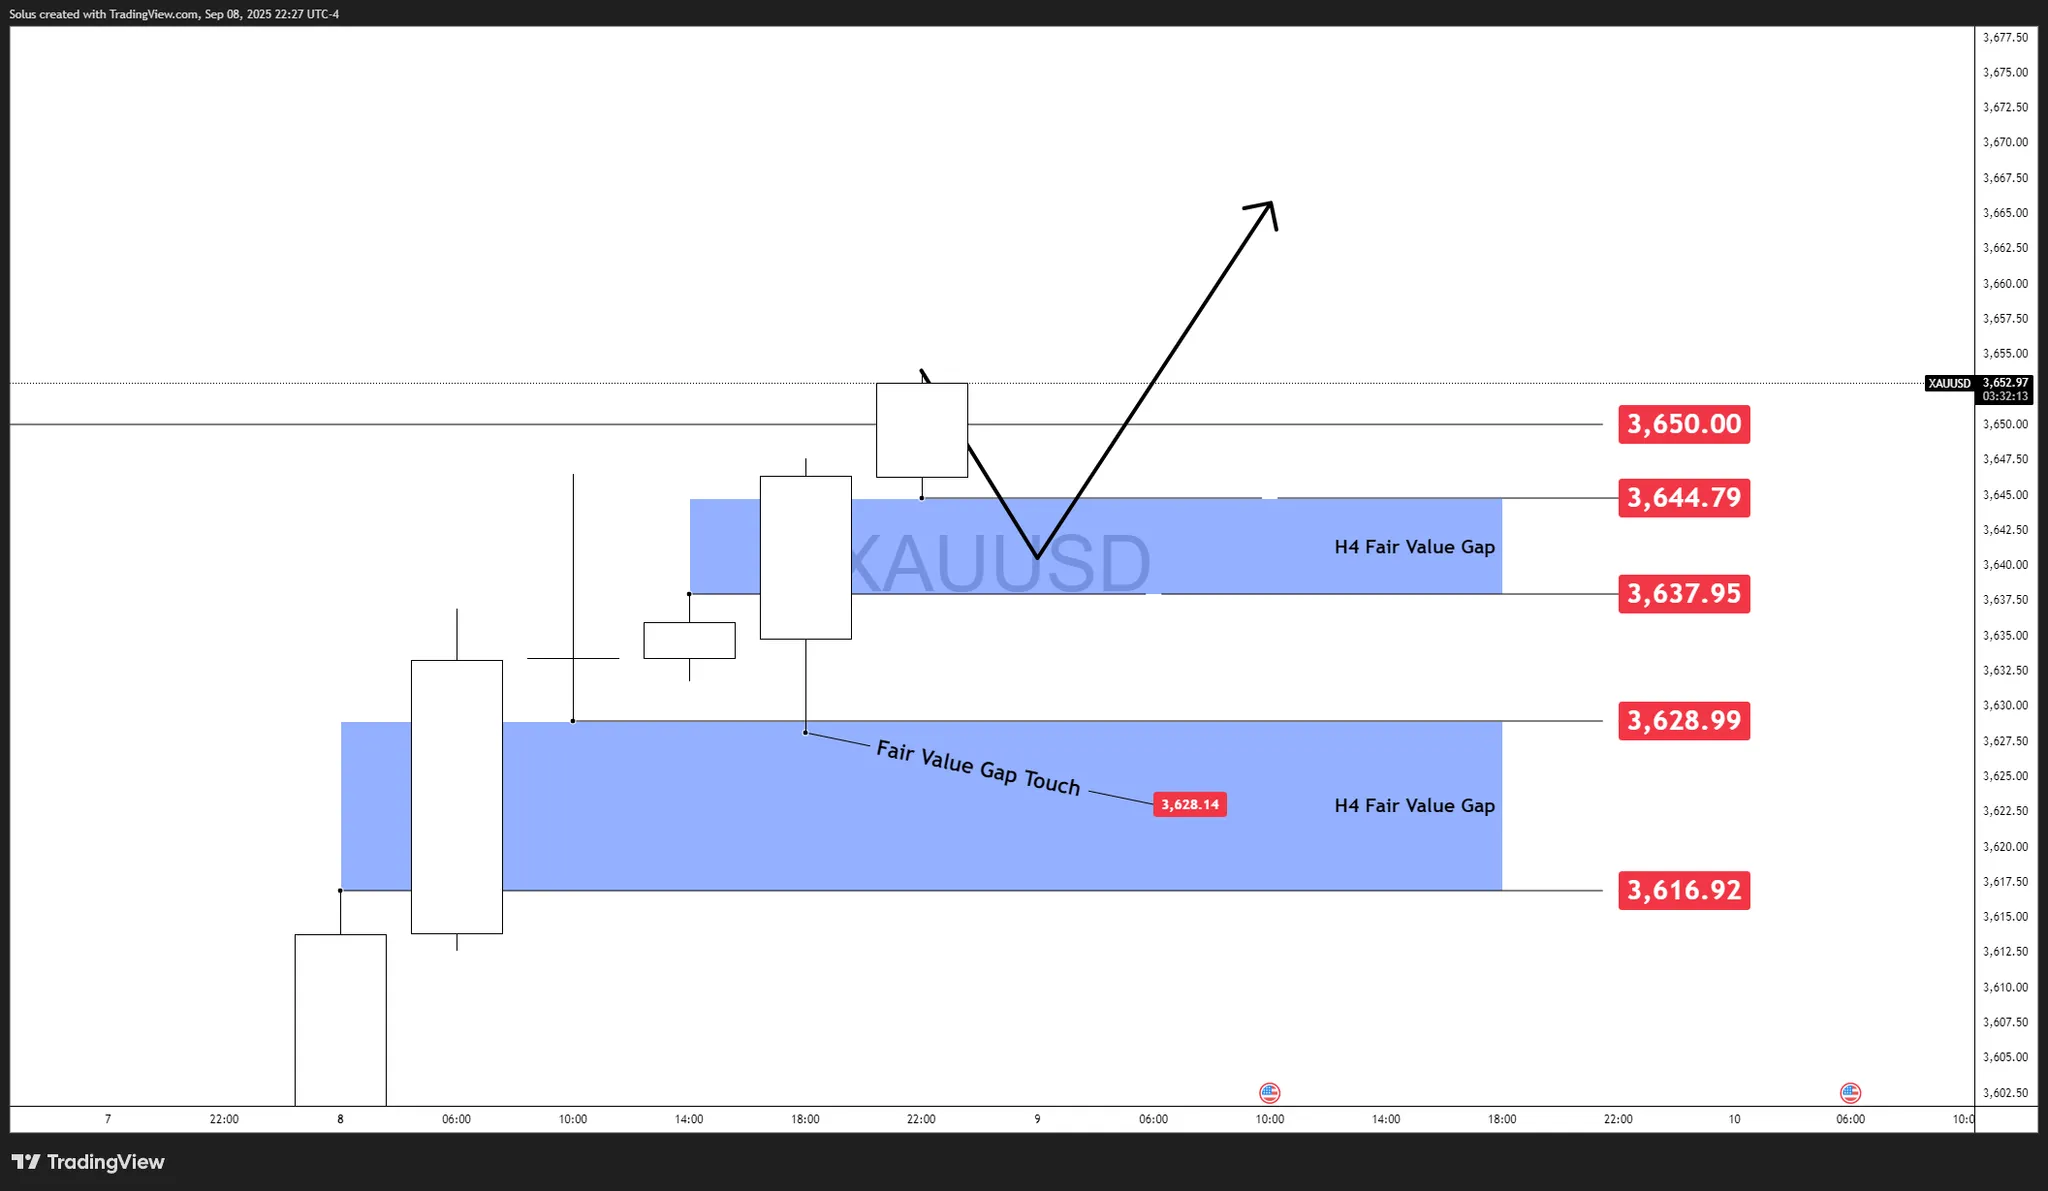
The bullish case hinges on whether buyers can hold the FVGs and reclaim $3,650 with conviction.
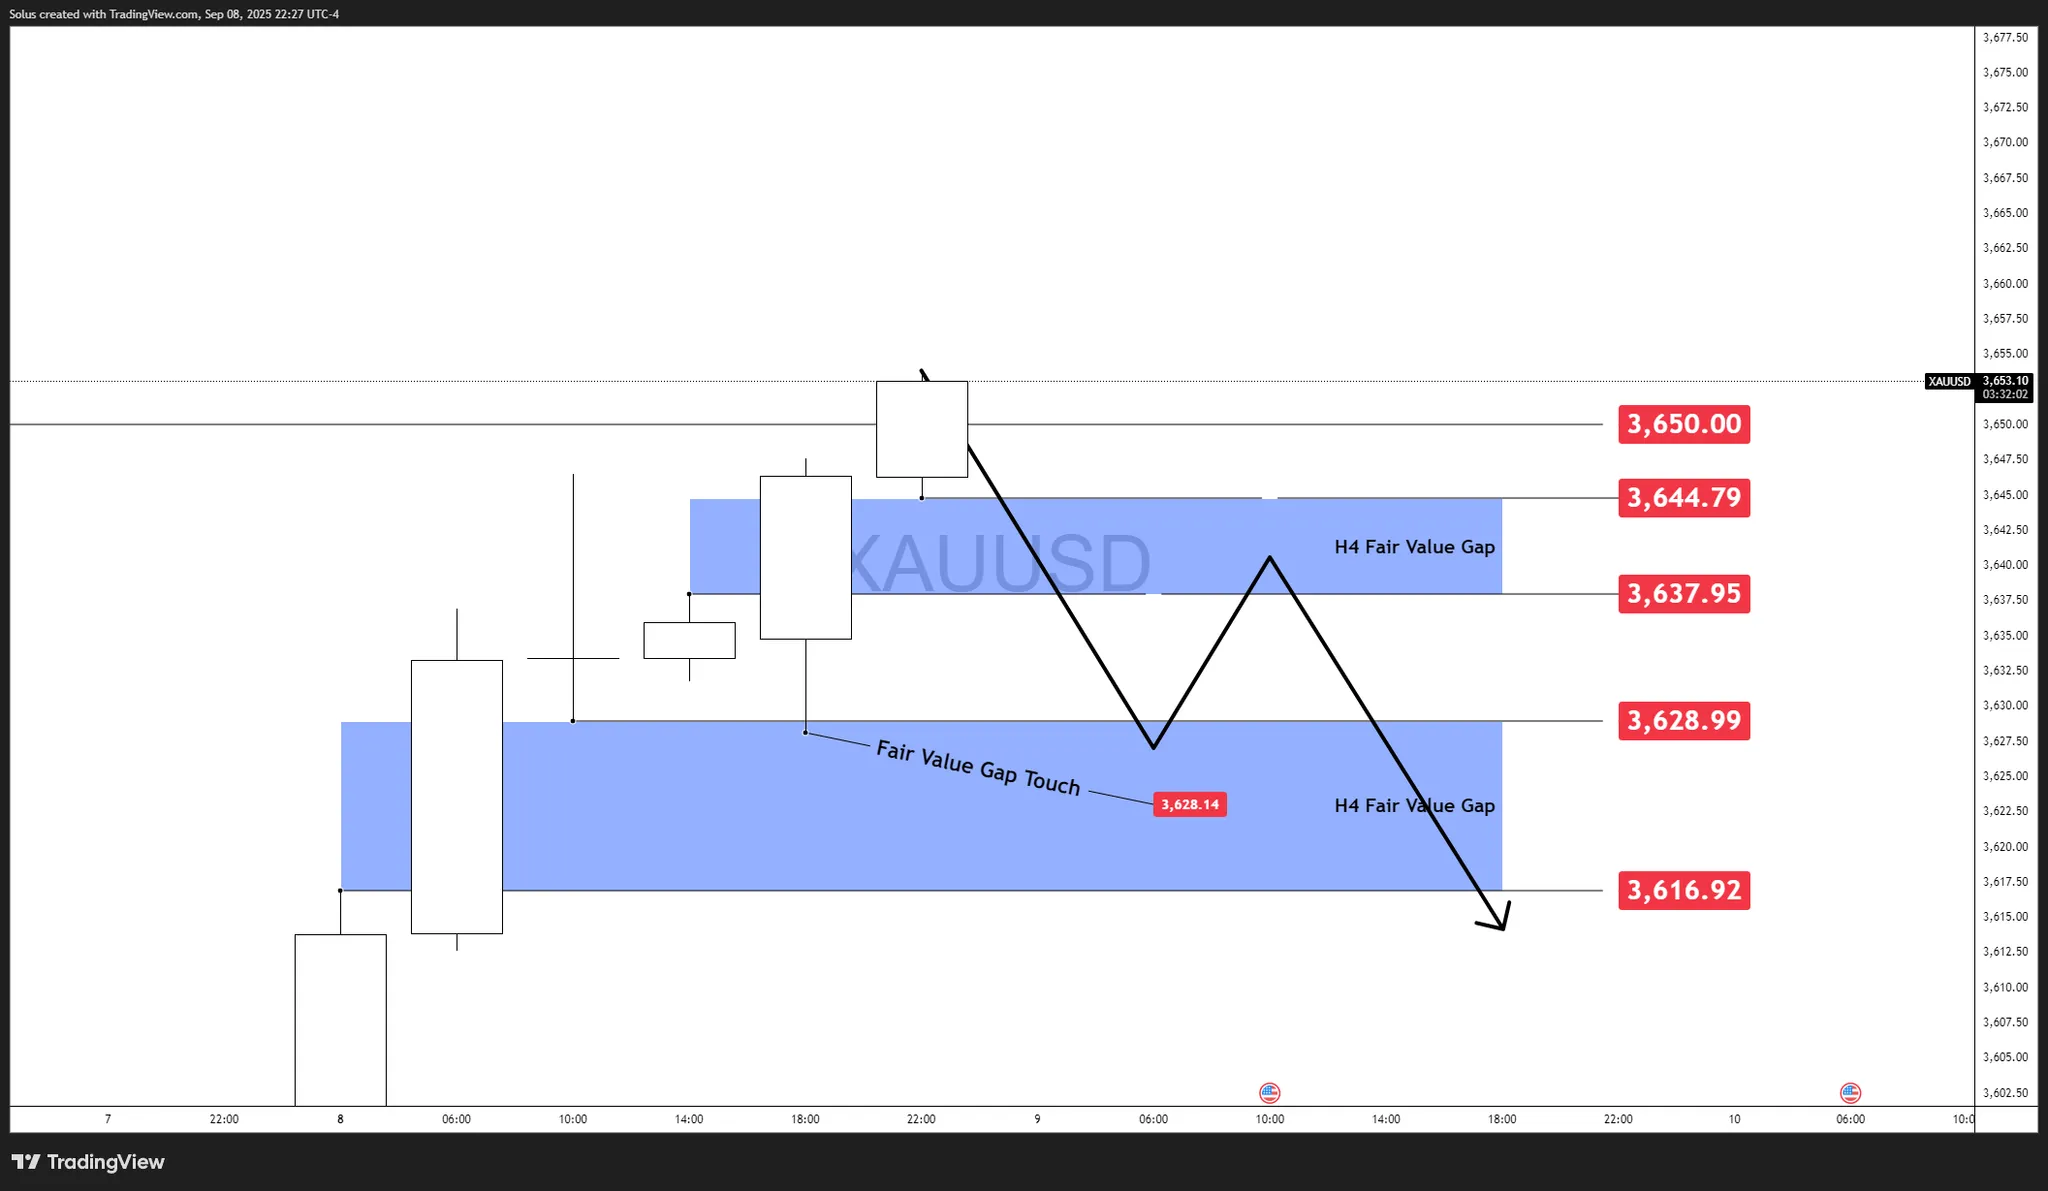
Alternatively, a sustained rejection under $3,650 combined with a hot CPI or stronger USD could trigger a deeper pullback.
While both bullish and bearish paths are clear on the chart, gold is sitting at a pivotal juncture. With CPI/PPI ahead and Fed cut odds already priced, chasing moves without confirmation risks being trapped in volatility. Traders should wait for a confirmed breakout above $3,650 or a decisive breakdown through the $3,628–$3,616 zone before committing to directional trades.
Natural gas price ended the bullish correctional rally by testing the resistance at $3.210, then begin forming bearish waves, affected by the negativity of the indicators and providing negative momentum, to notice its stability near $3.100.
The continuation of facing negative pressures will confirm its surrender to the previously suggested scenario, to keep waiting for targeting $2.810 level, and breaking this barrier will extend the losses directly towards $2.620 reaching the next main target at $2.390.
The expected trading range for today is between $2.820 and $3.150
Trend forecast: Bearish
Gold prices reached fresh record highs on Monday, with the bright metal extending its rally beyond the $3,630 mark. It currently trades not far below an intraday peak of $3,646.41, as investors keep dropping the US Dollar (USD). The Greenback’s selling spiral was triggered by a tepid Nonfarm Payrolls (NFP), which showed the country added a modest 22K new jobs in August. The country added 79K in July, and lost 12K in June, making it a third consecutive discouraging report.
Tepid job creation pretty much confirmed the Federal Reserve (Fed) will cut interest rates when it meets next week, with market participants even increasing bets for a larger interest rate cut of 50 basis points (bps).
During the upcoming days, the United States (US) will publish inflation-related figures. The July Producer Price Index (PPI) will be out on Wednesday, while the August Consumer Price Index (CPI) will be out on Thursday. The latter is foreseen at 2.9% YoY, higher than the 2.7% posted in July. The core annual reading is expected to remain steady at 3.1%. Also on Thursday, the European Central Bank (ECB) is scheduled to announce its decision on monetary policy. The ECB is widely anticipated to keep interest rates on hold this time.
From a technical point of view, the daily chart for XAU/USD shows that bulls are in full control despite overbought conditions. Technical indicators head firmly north at extreme levels, without signs of changing course anytime soon. At the same time, the pair is developing above all its moving averages, with the 20 Simple Moving Average (SMA) gaining upward traction above the 100 and 200 SMAs.
The near-term picture also skews the risk to the upside. The 4-hour chart shows that technical indicators keep heading higher within overbought readings, partially losing their upward strength but still aiming north. At the same time, a bullish 20 SMA stands at around $3,571, which is well above the longer ones, reflecting the latest run to record highs. Corrective declines should now find buyers around $3,600 for the bullish trend to remain alive.
Support levels: 3,625.85 3,608.40 3,593.70
Resistance levels: 3,650.00 3,675.00 3,690.00


")


