The main tag of GoldPrice Articles.
You can use the search box below to find what you need.
[wd_asp id=1]
The main tag of GoldPrice Articles.
You can use the search box below to find what you need.
[wd_asp id=1]
The sharp advance cleared multiple hurdles, including a breakout above a downtrend line, likely confirmed with a close above it today. A long-term uptrend line was also reclaimed, adding weight to the bullish shift following last week’s $2.89 swing low, which found footing at the rising channel’s lower boundary. These breakouts mark a clear end to the recent bearish correction, setting the stage for further gains.
Today’s rally past resistance zones like the downtrend line boosts the odds of a third upswing within the rising channel, triggered by a break above the $3.59 swing high. First, the 200-day moving average at $3.46—tested twice as resistance in October—looms as the next key test. A third attempt could break through, but expect some pullback before a sustained reclaim, given its prior rejections.
The extent of any pullback will shed light on the pattern’s strength. A minor dip toward $3.18 could reinforce support, but a deeper drop would question the breakout’s staying power. The weekly chart’s one-week bullish reversal, with minimal overlap into last week’s range, adds to the optimistic outlook.
Symmetry between the current upswing and prior measured moves points to a $3.71 pivot, where advances align. For now, $3.18 support and $3.46 resistance frame the trade. A close above $3.18 locks in bullish momentum, while $3.59 is the gateway to higher targets. Watch today’s close for confirmation—buyers are back, but the 200-day line will test their resolve.
For a look at all of today’s economic events, check out our economic calendar.
The 10-day average has anchored the uptrend, and today’s low finding support there reinforces its role. A decisive drop below $51.28 signals weakness, with a break past Friday’s $50.62 low paving the way for a deeper pullback. The 20-day average at $48.77, rising and positioned above the short-term rising channel’s top, emerges as a logical next support. Only a failure there would flag a more significant correction, so watch these levels closely.
Last week’s close in the lower half of the weekly range—after five weeks of upper-third finishes—suggests fading bullish momentum. The Relative Strength Index (RSI) dipped below 70 after a month in overbought territory, further supporting this cooling. The outside week’s aggressive selling hints at an early sentiment shift, making any rally suspect without clearing key hurdles.
A push above today’s $52.78 high would signal short-term strength, but only a sustained break past $54.49 confirms renewed upside conviction. Until then, rallies face resistance, with sellers poised to counter. The prior overbought run amplifies correction risks, though the bullish structure holds for now.
Silver’s trend remains upward if $51.28 support persists, but the RSI pullback and weekly weakness warrant caution. A close above $52.78 keeps bulls in play, while a drop below $50.62 targets $48.77. Monitor today’s close for directional cues—$54.49 is the gateway to higher prices, but a deeper breather looms if support gives way.
For a look at all of today’s economic events, check out our economic calendar.
Spot Gold trades near its all-time high of $4,379.76 a troy ounce, up on a daily basis on Monday. The positive tone of global equities limits XAU/USD’s near-term bullish potential, but underlying political and trade woes keep the bright metal afloat.
Market participants are keeping an eye on the United States (US) – China trade relationship. US President Donald Trump demanded that Beijing buy additional soybeans and take action on fentanyl to take back the threat of additional levies. Beijing, however, seems less worried.
According to data released at the beginning of the day, the Chinese Gross Domestic Product (GDP) rose 1.1% in the three months to September, beating the market’s expectations of 0.8%. The annualized figure posted a healthy 4.8%, as expected. Other than that, the country reported that Retail Sales in the year to September were up 3%, while Industrial Production in the same period increased 6.5%, both beating expectations of 2.9% and 5% respectively.
The figures suggest China has little to worried about what the US may or may not do, as the economy is doing well regardless of the White House actions and threats.
Meanwhile, the macroeconomic calendar has little to offer these days, although the United Kingdom (UK), Canada, and the US will release fresh Consumer Price Index (CPI) data. The US CPI will be released regardless of the government shutdown on Friday, according to the Bureau of Labor Statistics (BLS).
The XAU/USD pair is hovering around $4,350, and the daily chart shows bulls are in full control of the metal. In the mentioned time frame, technical indicators resumed their advances within overbought territory after correcting extreme readings. At the same time, the pair is far above all bullish moving averages, with the $3,0 SMA currently at around $3,983.
In the near term, the risk skews to the upside, although the momentum faded. Technical indicators stand far above their midlines, but lack directional strength. Meanwhile, intraday slides below a bullish 20 SMA were quickly reversed, with the pair currently well above the indicator. The 20 SMA provides support in the $4,278 price zone.
Support levels: 4,323.80 4,311.40 4,300.00
Resistance levels: 4,355.60 4,367.10 4,379.80
Gold price (XAU/USD) trades in a tight range around $4,250.00 during the European trading session on Monday. The precious metal stabilizes after Friday’s corrective move, which pushed it lower from the all-time high of $4,380 to near $4,200.
The yellow faced intense selling pressure on Friday after comments from United States (US) President Donald Trump signaled that an additional 100% tariffs announced by Washington on imports from China will not be sustained for long.
The scenario of easing global trade tensions diminishes the appeal of safe-haven assets, such as Gold.
“High tariffs were not sustainable though it could stand,” Trump said in an interview with Fox Business over the weekend. Trump expressed optimism that he could reach a fair deal with Chinese leader Xi Jinping in the meeting scheduled later this month in October.
Broadly, the outlook of the Gold price is upbeat as traders remain highly confident that the Federal Reserve (Fed) will cut interest rates in the policy meeting later this month. According to the CME FedWatch tool, traders are almost certain that the Fed will reduce interest rates by 25 basis points (bps) to 3.75%-4.00% in the October policy meeting.
Ahead of the Fed’s policy meeting, investors will pay close attention to the US Consumer Price Index (CPI) data for September, which will be released on Friday.
Lower interest rates by the Fed bode well for non-yielding assets, such as Gold.
Gold price corrects from its all-time high near $4,380 posted on Friday. The overall trend of the Gold price remains bullish as the 20-day Exponential Moving Average (EMA) slopes higher around $4,011.89. The upward-sloping trendline from the August 22 low around $3,321.50 will act as key support for the Gold price.
The 14-day Relative Strength Index (RSI) stays above 60.00 for a long period, suggesting a strong bullish momentum.
On the upside, the Gold price would struggle to extend its upside above the fresh all-time high of $4,380. Looking down, the psychological level of $4,000 would act as key support.
Gold has played a key role in human’s history as it has been widely used as a store of value and medium of exchange. Currently, apart from its shine and usage for jewelry, the precious metal is widely seen as a safe-haven asset, meaning that it is considered a good investment during turbulent times. Gold is also widely seen as a hedge against inflation and against depreciating currencies as it doesn’t rely on any specific issuer or government.
Central banks are the biggest Gold holders. In their aim to support their currencies in turbulent times, central banks tend to diversify their reserves and buy Gold to improve the perceived strength of the economy and the currency. High Gold reserves can be a source of trust for a country’s solvency. Central banks added 1,136 tonnes of Gold worth around $70 billion to their reserves in 2022, according to data from the World Gold Council. This is the highest yearly purchase since records began. Central banks from emerging economies such as China, India and Turkey are quickly increasing their Gold reserves.
Gold has an inverse correlation with the US Dollar and US Treasuries, which are both major reserve and safe-haven assets. When the Dollar depreciates, Gold tends to rise, enabling investors and central banks to diversify their assets in turbulent times. Gold is also inversely correlated with risk assets. A rally in the stock market tends to weaken Gold price, while sell-offs in riskier markets tend to favor the precious metal.
The price can move due to a wide range of factors. Geopolitical instability or fears of a deep recession can quickly make Gold price escalate due to its safe-haven status. As a yield-less asset, Gold tends to rise with lower interest rates, while higher cost of money usually weighs down on the yellow metal. Still, most moves depend on how the US Dollar (USD) behaves as the asset is priced in dollars (XAU/USD). A strong Dollar tends to keep the price of Gold controlled, whereas a weaker Dollar is likely to push Gold prices up.
The GBPJPY pair is under strong bearish trading in Friday’s trading, suffering extra losses by its approach from the extra support at 200.45, forming quick bullish rebound, reaching 203.15 level, announcing its attempt to regain the bullish bias.
Note that the stability of the trading above 201.70 level is important to increase the chances of renewing the bullish attempts, repeating the pressure on 203.10 obstacle, and surpassing it will make it achieve extra gains by its rally towards 203.95, while the price return to settle below 201.70 will force it to form new bearish waves, waiting for attacking 200.45 level again.
The expected trading range for today is between 201.70 and 203.00
Trend forecast: Bullish
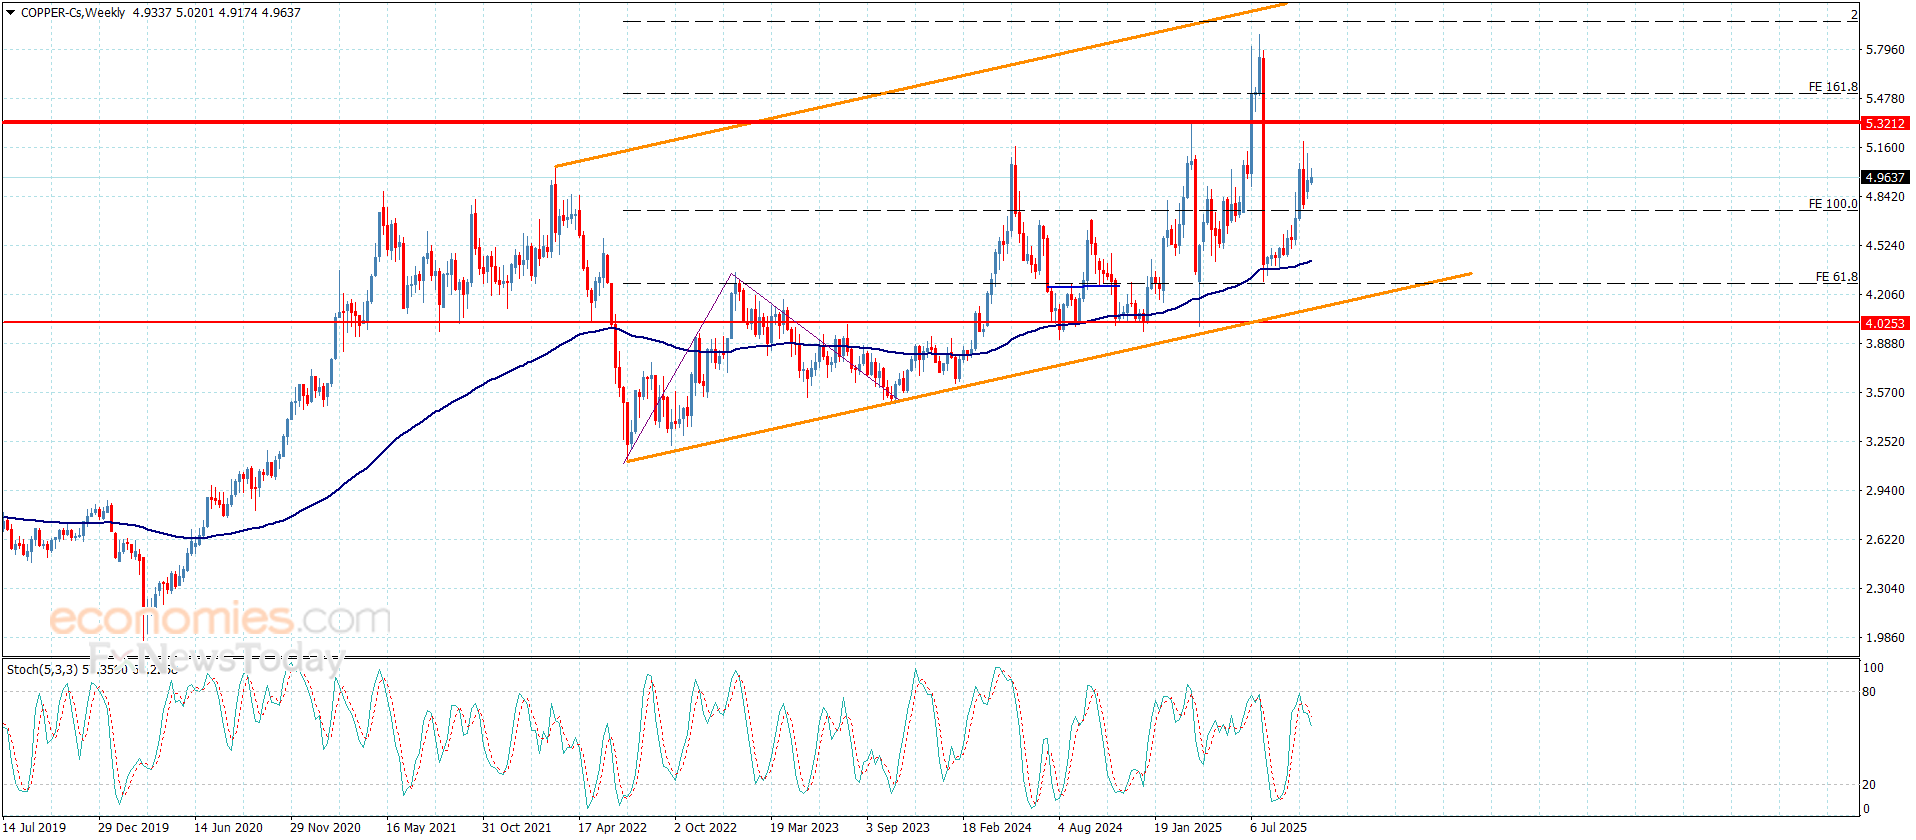
Copper price surrendered to the dominance of the sideways bias, due to its continuous neediness to the positive momentum, besides the stability of the barrier at$5.0600, fluctuating near $4.9500 level without recording any of the previously waited positive targets.
Stochastic decline below 80 level might increase the chances for a temporary corrective decline, to repeat the pressure on the extra support at $4.7500, while its success in surpassing the barrier and holding above it will renew the chances of recording extra gains by its rally towards $5.2000 and $5.3200 directly.
The expected trading range for today is between $4.7500 and $5.0600
Trend forecast: Fluctuated
Copper price surrendered to the dominance of the sideways bias, due to its continuous neediness to the positive momentum, besides the stability of the barrier at$5.0600, fluctuating near $4.9500 level without recording any of the previously waited positive targets.
Stochastic decline below 80 level might increase the chances for a temporary corrective decline, to repeat the pressure on the extra support at $4.7500, while its success in surpassing the barrier and holding above it will renew the chances of recording extra gains by its rally towards $5.2000 and $5.3200 directly.
The expected trading range for today is between $4.7500 and $5.0600
Trend forecast: Fluctuated
Silver price (XAG/USD) trades 0.7% higher to near $52.30 during the late Asian trading session on Monday. The white metal rebounds after a steep corrective move seen on Friday from the all-time high of $54.50.
The precious metal faced intense selling pressure after comments from United States (US) President Donald Trump signaling that the additional 100% tariffs announced on imports from Beijing won’t last long. “High tariffs were not sustainable, though they could stand,” Trump said, Fox Business reported.
Signs of easing global trade tensions diminish the appeal of safe-haven assets, such as Silver.
Trade frictions between the US and China stemmed after Beijing announced export controls on rare earth minerals.
For major updates on US-China trade relations, investors will focus on the meeting between US President Trump and Chinese leader Xi Jinping, which is scheduled later this month at the Asia-Pacific Economic Cooperation meeting in South Korea. Before that, US Treasury Secretary Scott Bessent is scheduled to meet his Chinese counterpart, Vice Premier He Lifeng, later this week.
Meanwhile, firm expectations that the Federal Reserve (Fed) will reduce interest rates atleast by 50 basis points (bps) in the remaining year will keep the Silver price on the front foot. Lower interest rates by the Fed bode well for non-yielding assets, such as Silver.
According to the CME FedWatch tool, traders have almost priced in atleast 50-basis-points (bps) reduction in interest rates in the remaining year and see a 4.8% chance that the Fed could cut borrowing rates by 75 bps.
Silver price retraces from the all-time high of around $54.50 posted on Friday. However, the near-term trend remains bullish as the 20-day Exponential Moving Average (EMA) slopes higher, which trades around $49.00.
The 14-day Relative Strength Index (RSI) oscillates above 60.00, suggesting that a strong bullish momentum remains intact.
Looking down the 20-day EMA would remain a key support. On the upside, the all-time high of $54.50 might act as key barrier.
Silver is a precious metal highly traded among investors. It has been historically used as a store of value and a medium of exchange. Although less popular than Gold, traders may turn to Silver to diversify their investment portfolio, for its intrinsic value or as a potential hedge during high-inflation periods. Investors can buy physical Silver, in coins or in bars, or trade it through vehicles such as Exchange Traded Funds, which track its price on international markets.
Silver prices can move due to a wide range of factors. Geopolitical instability or fears of a deep recession can make Silver price escalate due to its safe-haven status, although to a lesser extent than Gold’s. As a yieldless asset, Silver tends to rise with lower interest rates. Its moves also depend on how the US Dollar (USD) behaves as the asset is priced in dollars (XAG/USD). A strong Dollar tends to keep the price of Silver at bay, whereas a weaker Dollar is likely to propel prices up. Other factors such as investment demand, mining supply – Silver is much more abundant than Gold – and recycling rates can also affect prices.
Silver is widely used in industry, particularly in sectors such as electronics or solar energy, as it has one of the highest electric conductivity of all metals – more than Copper and Gold. A surge in demand can increase prices, while a decline tends to lower them. Dynamics in the US, Chinese and Indian economies can also contribute to price swings: for the US and particularly China, their big industrial sectors use Silver in various processes; in India, consumers’ demand for the precious metal for jewellery also plays a key role in setting prices.
Silver prices tend to follow Gold’s moves. When Gold prices rise, Silver typically follows suit, as their status as safe-haven assets is similar. The Gold/Silver ratio, which shows the number of ounces of Silver needed to equal the value of one ounce of Gold, may help to determine the relative valuation between both metals. Some investors may consider a high ratio as an indicator that Silver is undervalued, or Gold is overvalued. On the contrary, a low ratio might suggest that Gold is undervalued relative to Silver.
Gold price (XAU/USD) trades in negative territory around $4,245 during the early Asian session on Monday. The precious metal edges lower as the recent record-breaking rally seems overstretched and physical demand eases after the festive rush. Traders brace for China’s Q3 Gross Domestic Product (GDP) data later on Monday, along with Industrial Production and Retail Sales reports for September.
The yellow metal ended last week on a positive note, bolstered by festive demand in India and strong ETF buying. However, some profit-taking or consolidation cannot be ruled out in the near term as ongoing fundamentals are already priced in and physical demand wanes.
“Gold prices are likely to see some corrections/ consolidation as ongoing fundamentals are already priced in and physical demand wanes post mid-week,” said Pranav Mer, Vice President, EBG – Commodity & Currency Research, JM Financial Services Ltd.
On the other hand, the escalating US-China trade tensions, worries about uncertainty and global geopolitical risks could boost the safe-haven assets like Gold. US trade officials condemned China’s expansion of export controls on rare earths, while Beijing accused Washington of causing global panic over supply chain disruption. “Trade uncertainty is one driver helping to launch gold prices to all-time highs,” said Sam Stovall, chief investment strategist of CFRA Research in New York.
Gold has played a key role in human’s history as it has been widely used as a store of value and medium of exchange. Currently, apart from its shine and usage for jewelry, the precious metal is widely seen as a safe-haven asset, meaning that it is considered a good investment during turbulent times. Gold is also widely seen as a hedge against inflation and against depreciating currencies as it doesn’t rely on any specific issuer or government.
Central banks are the biggest Gold holders. In their aim to support their currencies in turbulent times, central banks tend to diversify their reserves and buy Gold to improve the perceived strength of the economy and the currency. High Gold reserves can be a source of trust for a country’s solvency. Central banks added 1,136 tonnes of Gold worth around $70 billion to their reserves in 2022, according to data from the World Gold Council. This is the highest yearly purchase since records began. Central banks from emerging economies such as China, India and Turkey are quickly increasing their Gold reserves.
Gold has an inverse correlation with the US Dollar and US Treasuries, which are both major reserve and safe-haven assets. When the Dollar depreciates, Gold tends to rise, enabling investors and central banks to diversify their assets in turbulent times. Gold is also inversely correlated with risk assets. A rally in the stock market tends to weaken Gold price, while sell-offs in riskier markets tend to favor the precious metal.
The price can move due to a wide range of factors. Geopolitical instability or fears of a deep recession can quickly make Gold price escalate due to its safe-haven status. As a yield-less asset, Gold tends to rise with lower interest rates, while higher cost of money usually weighs down on the yellow metal. Still, most moves depend on how the US Dollar (USD) behaves as the asset is priced in dollars (XAU/USD). A strong Dollar tends to keep the price of Gold controlled, whereas a weaker Dollar is likely to push Gold prices up.
Gold (XAU/USD) is trading around $4,230 per ounce, regaining traction after one of the most volatile weeks in modern market history. Following a record surge to $4,380, the precious metal suffered a dramatic reversal that erased nearly $1 trillion in market value within hours. The sharp correction, driven by a temporary strengthening of the U.S. dollar and recalibration of safe-haven flows, triggered widespread profit-taking but failed to alter the long-term structural uptrend. Even as short-term technical exhaustion took hold, gold’s dominant macro pillars—central bank accumulation, geopolitical tension, and weakening global yields—remain firmly intact.
The 2025 rally in gold stands as one of the most powerful in decades, with the metal up 54% year-to-date, the highest annual return since 1979. The rally has been fueled primarily by unprecedented central bank purchases, led by China and India, as part of an ongoing de-dollarization strategy. These strategic flows have redefined gold’s market structure, lifting physical demand to record highs and tightening supply. According to INVERCO data, European gold investment funds saw returns exceeding 100% this year, ranking among the top-performing assets globally. In parallel, global exchange-traded funds (ETFs) linked to gold reported surging inflows amid investor demand for protection against U.S. debt concerns and monetary policy uncertainty.
Gold’s breakout through $4,000 marked its ninth consecutive weekly advance—the longest streak since August 2020—driven by persistent geopolitical risk and expectations of near-term rate cuts by the Federal Reserve. The move to $4,380 represented the largest single-week trading range on record, with volatility levels not seen since the 2008 crisis. Technical readings signaled extreme overextension as momentum reached levels comparable only to April 2006. Analysts warned of “exhaustion risk” as bulls pushed into resistance zones between $4,084–$4,113, with upper projections stretching toward $4,583. Short-term traders began locking in gains, prompting a retracement to $4,200—a natural pause in a structurally bullish cycle rather than the onset of a reversal.
The epicenter of gold’s latest surge lies in Japan, where trading volume in spot gold soared by 300%, marking one of the largest single-country increases in history. The spike reflects both investor anxiety and strategic hedging, as Japanese institutions seek insulation from currency depreciation and regional instability. The surge in yen-based gold contracts has positioned Japan as a major price driver in the global market, amplifying liquidity and contributing to the intraday volatility seen in recent sessions. Analysts note that the increase is not purely speculative—large pension and insurance funds are actively expanding allocations as part of long-term diversification away from negative real yields.
The gold market’s sharp selloff coincided with an extraordinary liquidity migration toward digital assets, most notably Bitcoin (BTC-USD), which surged above $106,000 as gold corrected. Over $1 trillion was withdrawn from gold positions, temporarily weighing on prices but revealing an important cross-asset relationship: investors are not abandoning gold, but reallocating between tangible and digital safe-havens. The correlation between BTC and gold flipped negative in October, with institutional traders exploiting arbitrage between both markets. The short-term shift has raised speculation that Bitcoin is increasingly viewed as a high-beta hedge alongside gold rather than a competing asset. However, institutional sources confirm that large funds, including BlackRock (NYSE:BLK), maintain significant physical gold exposure as a stabilizer against digital volatility.
Friday’s pullback was exacerbated by a modest rebound in the U.S. Dollar Index (DXY), which climbed 0.1%, making dollar-denominated gold temporarily more expensive for foreign buyers. Meanwhile, comments from former U.S. President Donald Trump, signaling a softer stance on China tariffs, dampened immediate demand for defensive assets. U.S. gold futures for December delivery closed at $4,213.30, down 2.1% on the session. Still, markets continue to price in two 25-basis-point rate cuts by the Federal Reserve—one in October and another in December—creating a favorable backdrop for non-yielding assets like gold. With the next FOMC meeting scheduled for October 29, traders are recalibrating exposure around inflation data and real yield trends, both of which remain supportive of continued gold strength through year-end.
Physical demand across Asia remains robust. In India, festival season has pushed gold premiums to decade highs, while Chinese retail demand continues to accelerate amid local equity market weakness. Combined Asian consumption is expected to exceed 1,300 tons in 2025, the highest level since 2011. These flows are reinforcing the physical floor around $3,850–$3,900, limiting downside risk. The Shanghai Gold Exchange reported record withdrawals of 321 tons in September alone, underscoring how retail and institutional appetite remains firm even as speculative Western flows unwind. This divergence between physical and paper markets supports the thesis that gold corrections are transitory within an ongoing super-cycle.
Across Europe, mutual and pension funds have recorded one of their strongest performances in recent history. Data from INVERCO show that equity funds in Spain gained 31.66% in the first nine months of the year, yet defensive strategies like gold outperformed by a wide margin. At Generali Investments, strategists warned that risk assets are moving into narrow valuation ranges, but gold remains justified as a strategic hedge amid record-low euro credit spreads. Deutsche Bank’s CIO, Christian Nolting, maintains a cautiously optimistic tone, highlighting “temporary setbacks” but reaffirming that gold’s long-term trajectory remains underpinned by structural imbalance between supply and demand. Meanwhile, U.S. ETFs continue to attract inflows as Treasury yields stabilize near 4%, signaling investor confidence in gold as a medium-term store of value.
From a technical standpoint, XAU/USD faces immediate resistance between $4,084–$4,113, representing the upper bounds of the recent breakout channel. A weekly close above $4,308 would confirm renewed bullish momentum toward $4,583–$4,592, with extreme targets at $4,753. On the downside, support is firmly anchored near $3,859, coinciding with the monthly open, while $3,782 marks the 61.8% Fibonacci retracement of the May advance. A break below that would suggest deeper correction potential toward $3,666, though such a scenario remains improbable given the underlying macro tailwinds. Volatility indicators remain historically elevated, with the average weekly range exceeding $300, emphasizing the need for disciplined position sizing.
Persistent fiscal instability and geopolitical escalation continue to drive the safety premium embedded in gold’s valuation. The ongoing U.S. government shutdown debate and rising debt service costs have eroded confidence in the dollar’s long-term stability, pushing sovereign funds to diversify reserves. Simultaneously, conflicts across the Middle East and Eastern Europe have elevated gold’s geopolitical hedge function, with risk premiums adding an estimated $250–$300 to current spot prices. Analysts at Vontobel emphasize that these structural factors—ranging from fiscal deficit expansion to central bank balance-sheet constraints—create an environment where gold remains systematically favored over fiat currencies.
Despite record highs, the rally in gold coincides with booming equity markets, underscoring investor polarization. The S&P 500 (SPX) trades near 6,664, and the Nasdaq (NDX) at 22,680, suggesting that both risk-on and risk-off assets are advancing simultaneously. This “wall of worry” dynamic reflects liquidity-driven exuberance amid expectations of 2026 fiscal stimulus and AI-led productivity growth. Yet, historical data show that periods when gold and equities rise together often precede macro rebalancing phases. For diversified investors, this alignment strengthens the case for gold as both a hedge and a performance enhancer within multi-asset portfolios.
Global mine output has struggled to keep pace with investment demand. Production growth remains capped below 1.5% annually, while recycling flows are down nearly 18% year-over-year. Meanwhile, central bank holdings have reached 37,000 tons, a post–Bretton Woods record. Nations such as China, Turkey, and India continue to accumulate reserves as a direct counterbalance to U.S. Treasury exposure. With real yields hovering near zero and global inflation expectations edging higher, gold’s opportunity cost remains minimal. The interplay between constrained supply and consistent demand supports a sustained upward trajectory into 2026.
Gold’s sharp pullback from record highs represents a technical breather, not a structural reversal. The combination of central bank accumulation, Asian physical demand, and macro uncertainty continues to underpin a bullish thesis for XAU/USD. As long as prices hold above $3,850, the risk-reward dynamic remains favorable for long positioning. Upside targets stretch toward $4,500, with potential extension to $4,750 under sustained dollar weakness and further rate cuts. In a world of fragile fiscal stability and geopolitical unpredictability, gold remains the most credible global hedge. Trading stance: BUY — structural bull trend intact.