The main tag of GoldPrice Articles.
You can use the search box below to find what you need.
[wd_asp id=1]
The main tag of GoldPrice Articles.
You can use the search box below to find what you need.
[wd_asp id=1]
The Gold price (XAU/USD) attracts some buyers to near $3,445 during the early Asian session on Monday. The precious metal rises to over a one-month high due to escalating Middle East tensions and rising bets of a Federal Reserve (Fed) rate cut.
Investors ignored the upbeat US economic data released on Friday. Data released by the University of Michigan on Friday showed that the Consumer Sentiment Index rose to 60.5 in June versus 52.2 prior. This reading came in above the market consensus of 53.5.
Renewed geopolitical concerns in the Middle East following an Israeli attack on Iran continue to underpin the Gold price, a traditional safe-haven asset. Iranian officials underscored that they would “respond firmly to any adventurism” from Israel.
“Israel knocking out Iranian targets is causing a little bit of geopolitical scare in the market. Prices will stay elevated in anticipation of what is to come, the retaliation by Iran,” said Daniel Pavilonis, senior market strategist at RJO Futures.
The Fed is expected to leave its policy rate in the 4.25%-4.50% range at its June meeting on Wednesday. However, traders now expect a quarter-percentage-point rate cut by September. Before last week’s US inflation data, traders had expected the Fed to wait until December to deliver a second rate cut. Rising expectations of a Fed rate cut lift interest-bearing assets like Gold.
Gold has played a key role in human’s history as it has been widely used as a store of value and medium of exchange. Currently, apart from its shine and usage for jewelry, the precious metal is widely seen as a safe-haven asset, meaning that it is considered a good investment during turbulent times. Gold is also widely seen as a hedge against inflation and against depreciating currencies as it doesn’t rely on any specific issuer or government.
Central banks are the biggest Gold holders. In their aim to support their currencies in turbulent times, central banks tend to diversify their reserves and buy Gold to improve the perceived strength of the economy and the currency. High Gold reserves can be a source of trust for a country’s solvency. Central banks added 1,136 tonnes of Gold worth around $70 billion to their reserves in 2022, according to data from the World Gold Council. This is the highest yearly purchase since records began. Central banks from emerging economies such as China, India and Turkey are quickly increasing their Gold reserves.
Gold has an inverse correlation with the US Dollar and US Treasuries, which are both major reserve and safe-haven assets. When the Dollar depreciates, Gold tends to rise, enabling investors and central banks to diversify their assets in turbulent times. Gold is also inversely correlated with risk assets. A rally in the stock market tends to weaken Gold price, while sell-offs in riskier markets tend to favor the precious metal.
The price can move due to a wide range of factors. Geopolitical instability or fears of a deep recession can quickly make Gold price escalate due to its safe-haven status. As a yield-less asset, Gold tends to rise with lower interest rates, while higher cost of money usually weighs down on the yellow metal. Still, most moves depend on how the US Dollar (USD) behaves as the asset is priced in dollars (XAU/USD). A strong Dollar tends to keep the price of Gold controlled, whereas a weaker Dollar is likely to push Gold prices up.
WTI crude oil is surging amid escalating geopolitical tensions, with Israel’s recent strikes on Iran fueling a rally that pushed prices above the $74.00 handle on Friday. At the time of writing, WTI is trading just below $72.00 after Iran responded with its own missile barrage, marking a near 20% gain for June and reversing much of the weakness observed earlier this year.
Despite broad-based pressure in the first half of 2025, the recent price surge has lifted WTI back above several key technical levels, with bullish momentum building across multiple timeframes.
From a longer-term perspective, WTI has reclaimed the 12-month Simple Moving Average (SMA), currently sitting at $69.46. This level now serves as dynamic support. Above, resistance is forming at the 23.6% Fibonacci retracement of the March 2022 high to the April 2025 low, located at $71.71.
WTI Oil Monthly Chart
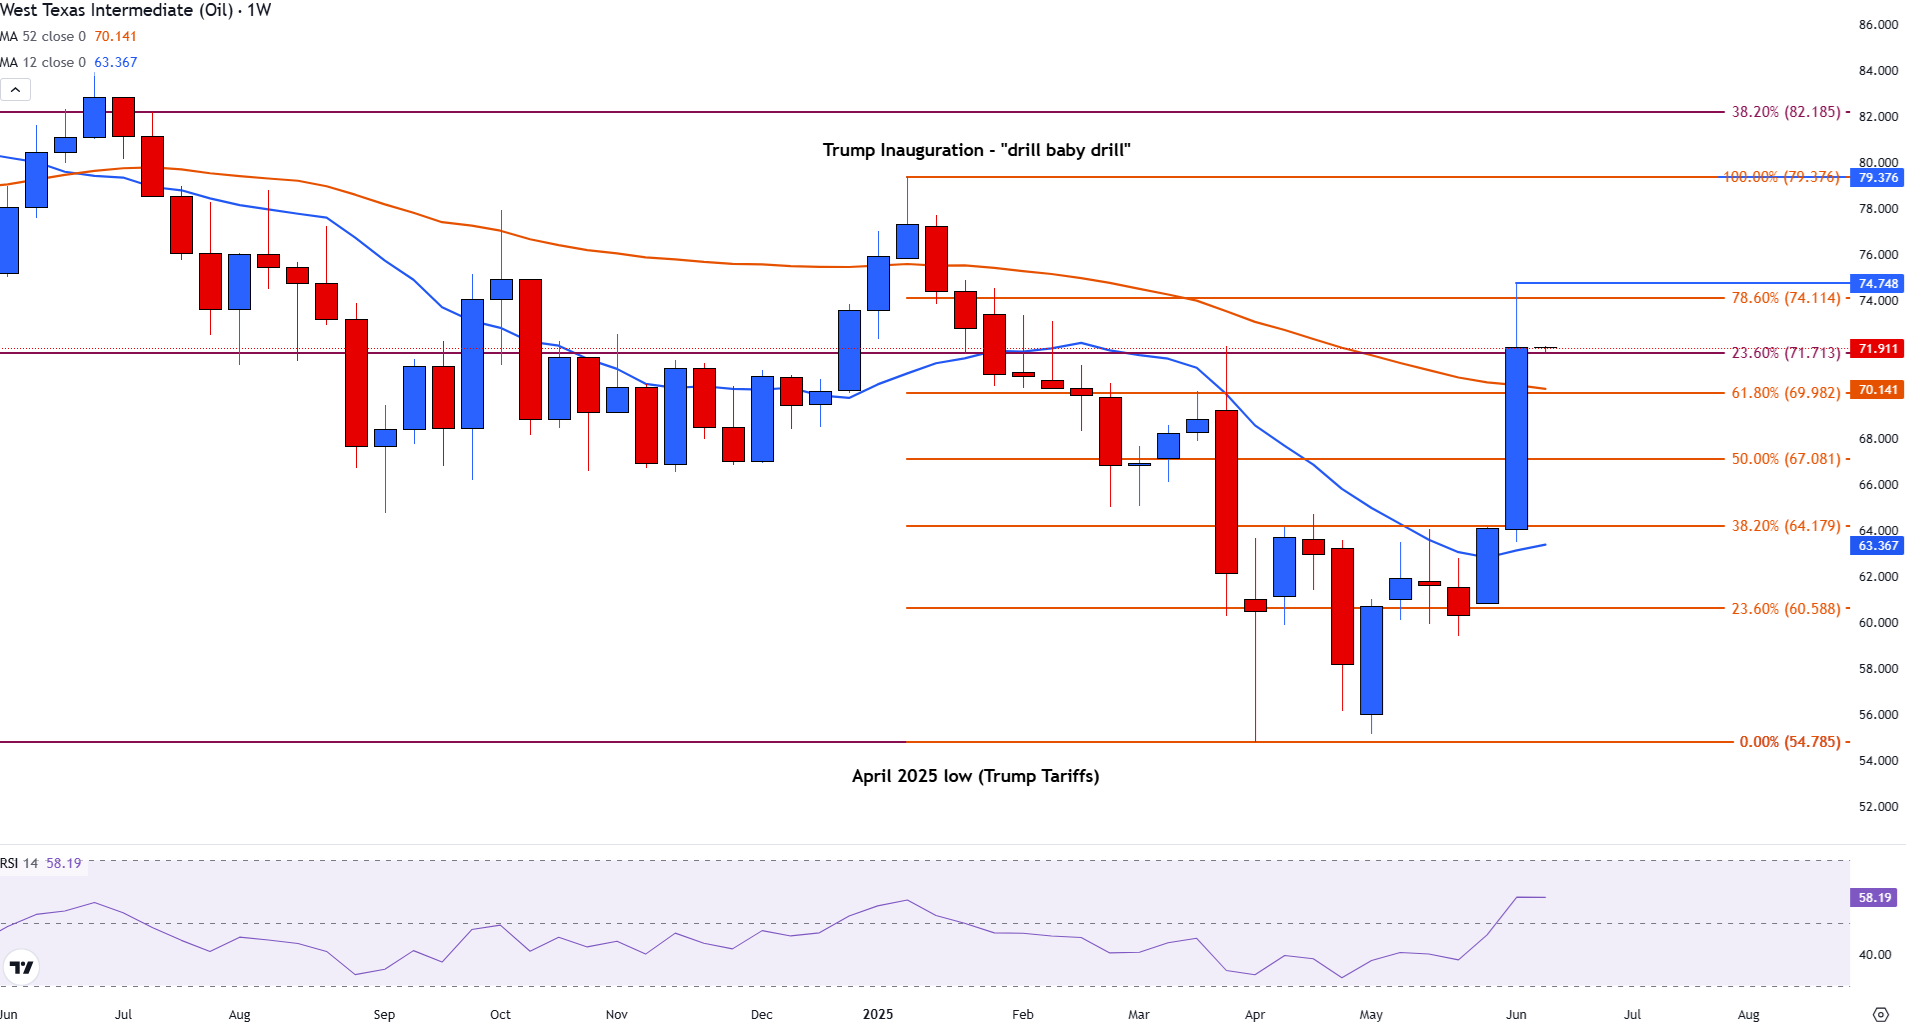
On the weekly chart, WTI broke above the 12-week SMA at $63.29 following the Iran-Israel escalation, marking a pivotal shift in sentiment. This surge has brought prices up to the 78.6% Fibonacci retracement of the January–April decline at $74.11. The 12-week SMA continues to offer support near $63.31, underlining a strong base for bulls.
WTI Oil Weekly Chart
Zooming into the daily chart, Friday’s bullish momentum drove a decisive move above both the 100-day and 200-day SMAs, strengthening the case for further upside. Technical confluence with long-term Fibonacci levels adds credibility to the breakout.
The Relative Strength Index (RSI) on the daily timeframe currently sits at 76, signaling overbought conditions. However, with the geopolitical backdrop intensifying, fundamental support may ultimately prevail over short-term exhaustion.
WTI Oil Daily Chart
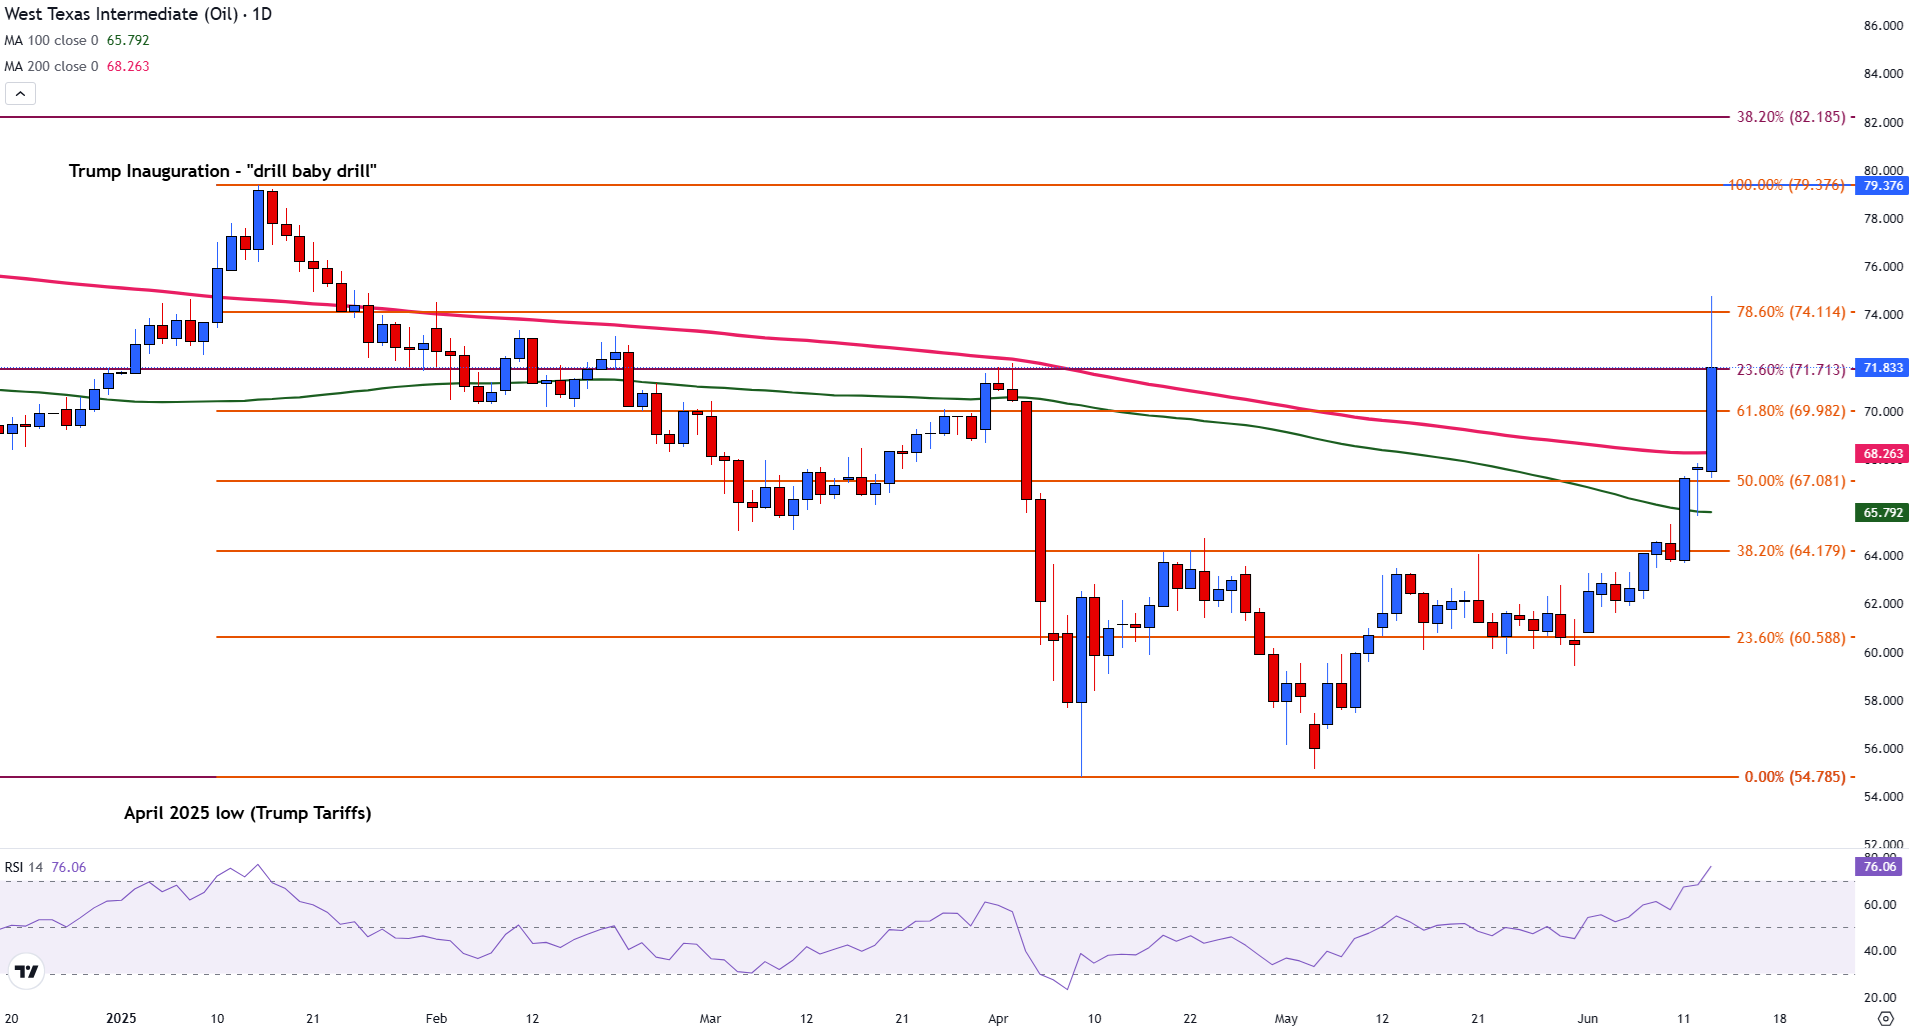
If WTI breaks and holds above $74.11 early next week, momentum could carry it toward $76.00 and eventually $78.00. Conversely, failure to maintain levels above $71.71 may trigger a retracement, especially if geopolitical tensions ease or if market focus returns to demand-side concerns.
Silver price bounced off five-day lows of $35.46 and is climbing past the $36.00 mark on Thursday as the Greenback gets battered, falling to nearly three-year lows. At the time of writing, XAG/USD trades at $36.30, registering modest gains of 0.25% on Thursday, late in the North American session.
As Thursday’s session finishes, Silver’s uptrend appears likely to continue, with a single candlestick pattern –known as a ‘hammer’– forming in the chart. This suggests that XAG/USD could re-test the June 9 swing high at $36.88 before buyers set their sights on higher prices.
The Relative Strength Index (RSI) exited from overbought territory but, instead of aiming lower, remains flat. Therefore, the path of least resistance is tilted to the upside.
The first key resistance is the year-to-date (YTD) high, followed by the $37.00 figure. Once cleared, the next stop would be $37.49, a 13-year high set on February 29.
Conversely, if XAG/USD drops below $36.00, the first support level would be $35.40, a high from October 2012 that has since become a support level. Once surpassed, the next stop is $35.00, followed by the $34.00 and $33.00 figures,
Silver is a precious metal highly traded among investors. It has been historically used as a store of value and a medium of exchange. Although less popular than Gold, traders may turn to Silver to diversify their investment portfolio, for its intrinsic value or as a potential hedge during high-inflation periods. Investors can buy physical Silver, in coins or in bars, or trade it through vehicles such as Exchange Traded Funds, which track its price on international markets.
Silver prices can move due to a wide range of factors. Geopolitical instability or fears of a deep recession can make Silver price escalate due to its safe-haven status, although to a lesser extent than Gold’s. As a yieldless asset, Silver tends to rise with lower interest rates. Its moves also depend on how the US Dollar (USD) behaves as the asset is priced in dollars (XAG/USD). A strong Dollar tends to keep the price of Silver at bay, whereas a weaker Dollar is likely to propel prices up. Other factors such as investment demand, mining supply – Silver is much more abundant than Gold – and recycling rates can also affect prices.
Silver is widely used in industry, particularly in sectors such as electronics or solar energy, as it has one of the highest electric conductivity of all metals – more than Copper and Gold. A surge in demand can increase prices, while a decline tends to lower them. Dynamics in the US, Chinese and Indian economies can also contribute to price swings: for the US and particularly China, their big industrial sectors use Silver in various processes; in India, consumers’ demand for the precious metal for jewellery also plays a key role in setting prices.
Silver prices tend to follow Gold’s moves. When Gold prices rise, Silver typically follows suit, as their status as safe-haven assets is similar. The Gold/Silver ratio, which shows the number of ounces of Silver needed to equal the value of one ounce of Gold, may help to determine the relative valuation between both metals. Some investors may consider a high ratio as an indicator that Silver is undervalued, or Gold is overvalued. On the contrary, a low ratio might suggest that Gold is undervalued relative to Silver.
The latest developments come as Israel reportedly targeted Iran’s nuclear sites and senior military commanders, prompting retaliatory drone attacks from Iran. According to Israel’s military, over 100 drones were launched by Iran in response. The rising instability has rattled global markets, increased investor anxiety, and sent gold prices to their highest level in nearly two months, signaling a classic flight to safety.
The benchmark Brent crude price surged over 10% shortly after Israel confirmed the attack, climbing to levels not seen since January. As European markets opened, prices cooled slightly but still held a 5% gain compared to Thursday, trading around $72.80 per barrel. U.S. West Texas Intermediate (WTI) also rose, trading at $73.20.
Although prices remain well below the $100-plus highs seen during Russia’s 2022 invasion of Ukraine, traders are now pricing in potential threats to vital supply routes and oil facilities across the region. The Middle East is home to a significant share of global oil production, and any conflict that puts that at risk sends shockwaves through the market.
Yes, energy analysts are warning that this conflict, if it escalates, could disrupt oil flows—especially if Iran targets infrastructure or shipping routes like the Strait of Hormuz. This narrow waterway is one of the most critical chokepoints for global energy supplies, with nearly one-fifth of the world’s oil passing through it daily. According to Saul Kavonic, head of energy research at MST Financial, “What we see now is a very initial risk-on reaction. But over the next day or two, the market will need to factor in where this could escalate to.” Capital Economics analysts say if Iranian production or export facilities are hit, Brent crude could rise to $80–$100 per barrel, depending on the scale of the disruption. However, they also suggest that higher prices could trigger increased output from other oil-producing nations, which might limit the long-term impact.
The rising oil prices triggered widespread uncertainty across financial markets. Stock markets across Asia and Europe declined, with Japan’s Nikkei closing down 0.9% and the UK’s FTSE 100 index falling 0.4% by mid-morning.
At the same time, “safe-haven assets” like gold and the Swiss franc gained sharply. The gold price jumped 1.2% to hit $3,423.30 an ounce, marking its highest level in nearly two months.
These moves reflect growing investor concern that this latest round of violence could spiral into a wider regional conflict, with unpredictable effects on global inflation and energy supply.
It’s still unclear whether this spike in crude prices will immediately impact prices at the pump. According to Rod Dennis from the UK’s RAC motoring group, it’s “too soon” to say.
He added that “there are two key factors at play: whether higher wholesale fuel prices are sustained over the coming days and, crucially, the sort of margin retailers decide to take.”
If the conflict continues or worsens, consumers could feel the pinch in the form of higher petrol and diesel prices, especially if disruptions reach the Strait of Hormuz. Rising fuel costs also feed into higher transportation and food prices, which could affect inflation worldwide.
Analysts are warning that the current situation could either calm quickly—or spiral into a broader war. Vandana Hari of Vanda Insights told the BBC, “It’s an explosive situation, albeit one that could be defused quickly, as we saw in April and October last year.”
However, she also warned, “It could also spiral out into a bigger war that disrupts Mideast oil supply.”
If Iran’s oil infrastructure or shipping routes come under serious threat, the global energy market could face a major crisis. With multiple countries relying heavily on oil shipped from the Gulf, any major conflict could send shockwaves far beyond the region.
Oil traders and analysts will now be closely watching political and military developments. Key questions include whether Iran escalates its response, if other regional powers become involved, and how the U.S. and allies react. At the same time, OPEC and major producers may be forced to consider output changes to stabilize markets.
As the situation unfolds, the global economy faces rising uncertainty—not just over oil, but over inflation, market stability, and energy security.
Q1: Why did global oil prices surge after Israel’s strike on Iran?
Oil prices jumped due to fears that the Israel-Iran conflict could disrupt key Middle East oil supplies.
Q2: Could the Strait of Hormuz be affected by this conflict?
Yes, if tensions rise, Iran might block or disrupt oil flow through the crucial Strait of Hormuz.
Weekly support from last week was at $3.50 and it was broken on Wednesday. However, it was not confirmed with a daily close below that price level. Therefore, a weekly closing price above that level could be the sign of a false breakdown. Currently, today’s closing price will be above that price level and at a four-day closing high, another sign of strength.
Nonetheless, key support is at a minor higher swing low of $3.44, while this week’s low was at $3.45. If the slightly lower $3.44 level fails, the 61.8% Fibonacci retracement at $3.38 is the next lower target where support may be seen. Then, a little lower is the 200-Day MA, now at $3.32.
A decisive breakout above today’s high of $3.62 could be the next sign of strength that has the potential to lead to higher prices. But the four-day high of $3.66 would need to be exceeded before there are clearer signs of a bottom. A recovery of the $3.66 level would establish a slightly higher swing low from this week. Solid potential resistance lies above and up to the $3.84 swing high from May. If natural gas can get above the May swing high, it has a chance to complete a rising ABCD pattern at $4.08. That price level is joined by the 61.8% Fibonacci retracement level at $4.12.
Given the two recent bounces off the area around the 200-Day MA since April, the uptrend begun from the April swing low is expected to continue. That could change if there is a decisive decline below the 200-Day line.
For a look at all of today’s economic events, check out our economic calendar.
The investment bank said current prices already reflect a 7% chance of a worst-case geopolitical scenario, one in which Iranian oil supplies are severely disrupted and the price reaction becomes “exponential rather than linear.”
As of early Friday, Brent futures surged nearly 9% to $75.36 per barrel, while WTI rose $6.16 to $74.20, following the news of Israeli strikes on Iran’s uranium enrichment facilities and military leadership. Iranian media reported explosions at the Natanz nuclear site and confirmed the death of Hossein Salami, commander of the Revolutionary Guards.
Also Read | Rs 1 lakh gold, $78 oil, 1,300 point Sensex crash: Israel’s Friday the 13th bombshellHere are the six key takeaways from J.P. Morgan’s latest oil market outlook, now playing out against an increasingly combustible geopolitical backdrop:
1. A 7% chance of a nightmare scenario already priced in
According to the J.P. Morgan, oil prices reflect a “7% probability of a worst-case scenario,” in which the impact on supply goes beyond reduced Iranian exports. In such a case, the bank said, price surge would not be gradual but “exponential,” driven by panic reactions and wider regional contagion.
2. Oil could jump to $120, pushing U.S. inflation to 5%
“An attack on Iran could spike oil prices to $120, driving U.S. CPI to 5%,” the investment bank warned.Such a move would reverse recent progress on inflation and complicate monetary policy for the Federal Reserve, which has been preparing for a potential rate-cut cycle later this year.
3. Base case oil forecast held at $60–$65
Despite the heightened tensions, J.P. Morgan said it was “downplaying geopolitical concerns” and maintaining its base case for Brent crude in the “low-to-mid $60s oil for the rest of 2025, and $60 in 2026.”
The investment bank expects oil to average $60 per barrel in 2026. This forecast assumes that regional powers will act to prevent a full-scale conflict.
4. Strait of Hormuz closure seen as unlikely
The bank downplayed fears of Iran closing the Strait of Hormuz, a key global shipping chokepoint, stating: “The closure of Hormuz is a low-risk event as Iran would be damaging its own position, both economically and politically, by irritating its main customer.”
Roughly a fifth of global oil passes through this strait, and any disruption there would have dramatic effects on energy markets.
5. Gulf nations have a stake in stability
J.P. Morgan argued that major Middle Eastern producers have strong incentives to keep hostilities from spiraling.
“Main players in the Middle East have strong incentives to keep the conflict contained given the economic transformation currently planned and implemented in the Gulf region requires a sustained absence of conflict,” the bank said, citing the sweeping economic diversification plans underway in the Gulf, which depend on prolonged regional calm.
This includes massive infrastructure and diversification efforts in Saudi Arabia and the UAE.
6. Oil surged, markets sank as tensions boiled over
Oil prices spiked while global markets sold off on Friday after Israel’s offensive on Iranian military and nuclear sites. Brent crude gained $6 to hit $75.36 a barrel, while WTI futures rose $6.16 to $74.20. Gold, another haven asset, climbed 1.5% to $3,434 per ounce.
Meanwhile, Israel said it was preparing for retaliatory missile and drone attacks, declaring a state of emergency nationwide. Iran has vowed a response after losing top military officials, including Salami, and seeing key installations in Tehran and Natanz come under fire.
U.S. Secretary of State Marco Rubio said that Washington had no role in the Israeli operation, calling it a “unilateral action.”
The sudden escalation comes amid stalled nuclear talks between Washington and Tehran and ahead of a critical vote by the International Atomic Energy Agency on June 12 in Vienna, which could trigger a snapback of United Nations sanctions on Iran.
With oil supply risks now sharply elevated and diplomatic off-ramps narrowing, J.P. Morgan’s warning looks increasingly prescient.
Also read | Oil jumps more than 12% as Israel strikes Iran, rattling investors
(Disclaimer: Recommendations, suggestions, views and opinions given by the experts are their own. These do not represent the views of The Economic Times)
Gold (XAU/USD) appreciates for the third consecutive day on Friday, and is on track for a weekly rally beyond 3%. Israel’s attack on Iran has crushed an already fragile market sentiment on Friday, triggering a rush for safety that has boosted Gold and all the traditional safe assets.
Israel attacked Iran with unprecedented strength earlier on Friday, pounding nuclear sites and killing high-ranking Revolutionary Guard Officials. Iran retaliated with a drone attack and leaving the nuclear negotiations with the US. Fears of a full-blown war in the region have fuelled an intense risk-off mood.
Technical indicators are pointing higher again. RSI studies in the 4-hour chart are high but still below overbought territory. The fundamental background is supportive, despite generalised USD strength, and bearish attempts remain limited so far.
The precious metal is trading at the top of a wedge pattern with trendline resistance at $3,425 is holding bears ahead of the May 6 high, at $3,440. Bulls need to clear these levels before shifting their focus to the $3,495 all-time high hit in late April.
On the downside, bears are being held above the $3,400 previous resistance (Jun 5 high). A pullback below here would bring the June 12 low and the bottom of the wedge pattern, both around $3,345, into focus.
Gold has played a key role in human’s history as it has been widely used as a store of value and medium of exchange. Currently, apart from its shine and usage for jewelry, the precious metal is widely seen as a safe-haven asset, meaning that it is considered a good investment during turbulent times. Gold is also widely seen as a hedge against inflation and against depreciating currencies as it doesn’t rely on any specific issuer or government.
Central banks are the biggest Gold holders. In their aim to support their currencies in turbulent times, central banks tend to diversify their reserves and buy Gold to improve the perceived strength of the economy and the currency. High Gold reserves can be a source of trust for a country’s solvency. Central banks added 1,136 tonnes of Gold worth around $70 billion to their reserves in 2022, according to data from the World Gold Council. This is the highest yearly purchase since records began. Central banks from emerging economies such as China, India and Turkey are quickly increasing their Gold reserves.
Gold has an inverse correlation with the US Dollar and US Treasuries, which are both major reserve and safe-haven assets. When the Dollar depreciates, Gold tends to rise, enabling investors and central banks to diversify their assets in turbulent times. Gold is also inversely correlated with risk assets. A rally in the stock market tends to weaken Gold price, while sell-offs in riskier markets tend to favor the precious metal.
The price can move due to a wide range of factors. Geopolitical instability or fears of a deep recession can quickly make Gold price escalate due to its safe-haven status. As a yield-less asset, Gold tends to rise with lower interest rates, while higher cost of money usually weighs down on the yellow metal. Still, most moves depend on how the US Dollar (USD) behaves as the asset is priced in dollars (XAU/USD). A strong Dollar tends to keep the price of Gold controlled, whereas a weaker Dollar is likely to push Gold prices up.
Copper price neediness to the momentum in the last trading led to delay the bullish attempts, to notice its fluctuations below the barrier near $4.8100, and providing an intraday negative rebound at $4.7100.
Note that the price success to settle above 50% Fibonacci correction level at $4.6600 will assist to reinforce the chances for activating the bullish track until breaching the mentioned barrier, while breaking this support will increase the negative pressure on the current trading, which force it to suffer extra losses by reaching $4.6000 and $4.5300.
The expected trading range for today is between $4.6600 and $4.8100
Trend forecast: Fluctuated within the bullish track
He noted that the demand for gold is being bolstered by “a blend of risk aversion and a recalibration of monetary policy expectations.”
The Producer Price Index (PPI) rose just 0.1% in May, down from a 0.2% decline in April, signaling persistent disinflationary trends.
Combined with soft consumer price data, markets are now pricing in a 55-basis-point rate cut by the Federal Reserve in 2025, likely starting in September.
U.S. Treasury yields retreated, and the Dollar Index (DXY) hovered near a three-month low, supporting non-yielding gold.
Silver (XAG/USD) is trading at $36.30, having slipped to an intraday low of $35.98. The metal is consolidating within a symmetrical triangle pattern, suggesting price compression as traders await a directional breakout.
While gold has surged on haven flows, silver’s upside remains capped by lingering concerns around industrial demand and global manufacturing trends.
Gold price is gaining roughly 1.50% in Asian trading on Friday, underpinned by intense flight to safety amid escalating geopolitical tensions between Israel and Iran.
Israel said earlier on that it attacked Iranian nuclear targets to block Tehran from developing atomic weapons.
Several Iranian media outlets now claim that Iran will declare a war on Israel and retaliate “soon.”
Iran’s Armed Forces General staff responded on Friday, warning that Israel and the US will “pay a very heavy price”.
Against this backdrop, US President Donald Trump has convened a meeting of the National Security Council in the White House situation room later in the day at 15 GMT.
Investors run for cover in the traditional safe-haven assets such as Gold price, the US Treasury bonds and the Japanese Yen (JPY) in times of market panic and uncertainty.
Therefore, the ultimate store of value, Gold price, is seeing unabated demand as it extends its winning streak into a third consecutive day on Friday, sitting at the highest level in seven weeks.
Gold buyers now aim for the record high of $3,500 if the Mid East conflict intensifies, with Iran initiating a harsh response to the Israeli pre-emptive strikes on Iran’s main enrichment facility in Natanz.
However, the strengthening haven demand for the US Dollar (USD) could impede Gold price rally.
Markets shrug off the latest trade headlines as geopolitics dominate alongside risk-off flows.
Reuters reported that tariffs on a range of imported household appliances, which are currently at 50% for most countries, would take effect on an additional range of “steel derivative products” on June 23.
Looking ahead, all eyes will remain on Iran’s probable retaliation to the Israeli strikes and the US’ response to the Middle East conflict.
The University of Michigan (UoM) Consumer Sentiment and Inflation Expectations could play second fiddle to the geopolitical headlines.
Markets ramp up odds for a US Federal Reserve (Fed) interest rate cut in September following softer-than-expected US Consumer Price Index (CPI) and Producer Price Index (PPI) data released earlier in the week.
Having closed Thursday above the critical resistance at $3,377, the 23.6% Fibonacci Retracement (Fibo) level of the April record rally, Gold price solidified its bullish momentum on Friday.
The 14-day Relative Strength Index (RSI) holds firm above the midline, currently near 62, suggesting that there is more room for the upside.
The next stiff resistance is spotted at the $3,450 psychological level, above which the lifetime high of $3,500 will be threatened.
On the downside, the immediate support is aligned at the $3,400 threshold, below which the resistance-turned-support of the 23.6% Fibo level at $3,377 will come into play.
Deeper declines will likely challenge the 21-day Simple Moving Average (SMA) of $3,325.


 & Silver Price Forecast: XAU/USD Soars on Safe-Haven and Tariff Fears")