The main tag of GoldPrice Articles.
You can use the search box below to find what you need.
[wd_asp id=1]
The main tag of GoldPrice Articles.
You can use the search box below to find what you need.
[wd_asp id=1]
The GBPJPY pair didn’t settle above the support of the minor bullish channel at 198.70, forcing it to suffer deep losses by its decline to 195.35, facing the moving average 55 that supports the stability of 78.2%Fibonacci correction level as appears in the above image.
Noticing the beginning of forming bullish waves since this morning, but it couldn’t regain the bullish bias until surpassing the obstacle at 196.60, which allows it to resume the rise and achieve extra gains that might extend to 197.05 and 197.40, while the decline below 195.35 and holding below it will confirm its surrender to the bearish bias domination, which forces it to suffer extra losses by reaching 194.55.
The expected trading range for today is between 195.70 and 196.90
Trend forecast: Bullish
The (silver) price rose in its last intraday trading, but it remains under the dominance of the bearish correctional trend on the short-term basis, with the continuation of its trading alongside a bias line that indicates the negative pressures, and its stability below EMA50 reinforces this pressure and limits the strength of the current rise.
The (RSI) began showing negative overlapping signals after reaching overbought levels, indicating the weakness of the positive momentum and a potential return to the selling pressure on the near-term basis unless they breached the resistance levels.
Get high-accuracy trading signals delivered directly to your Telegram. Subscribe to specialized packages tailored for the world’s top markets:
To view the full performance report for this week, visit the following link:
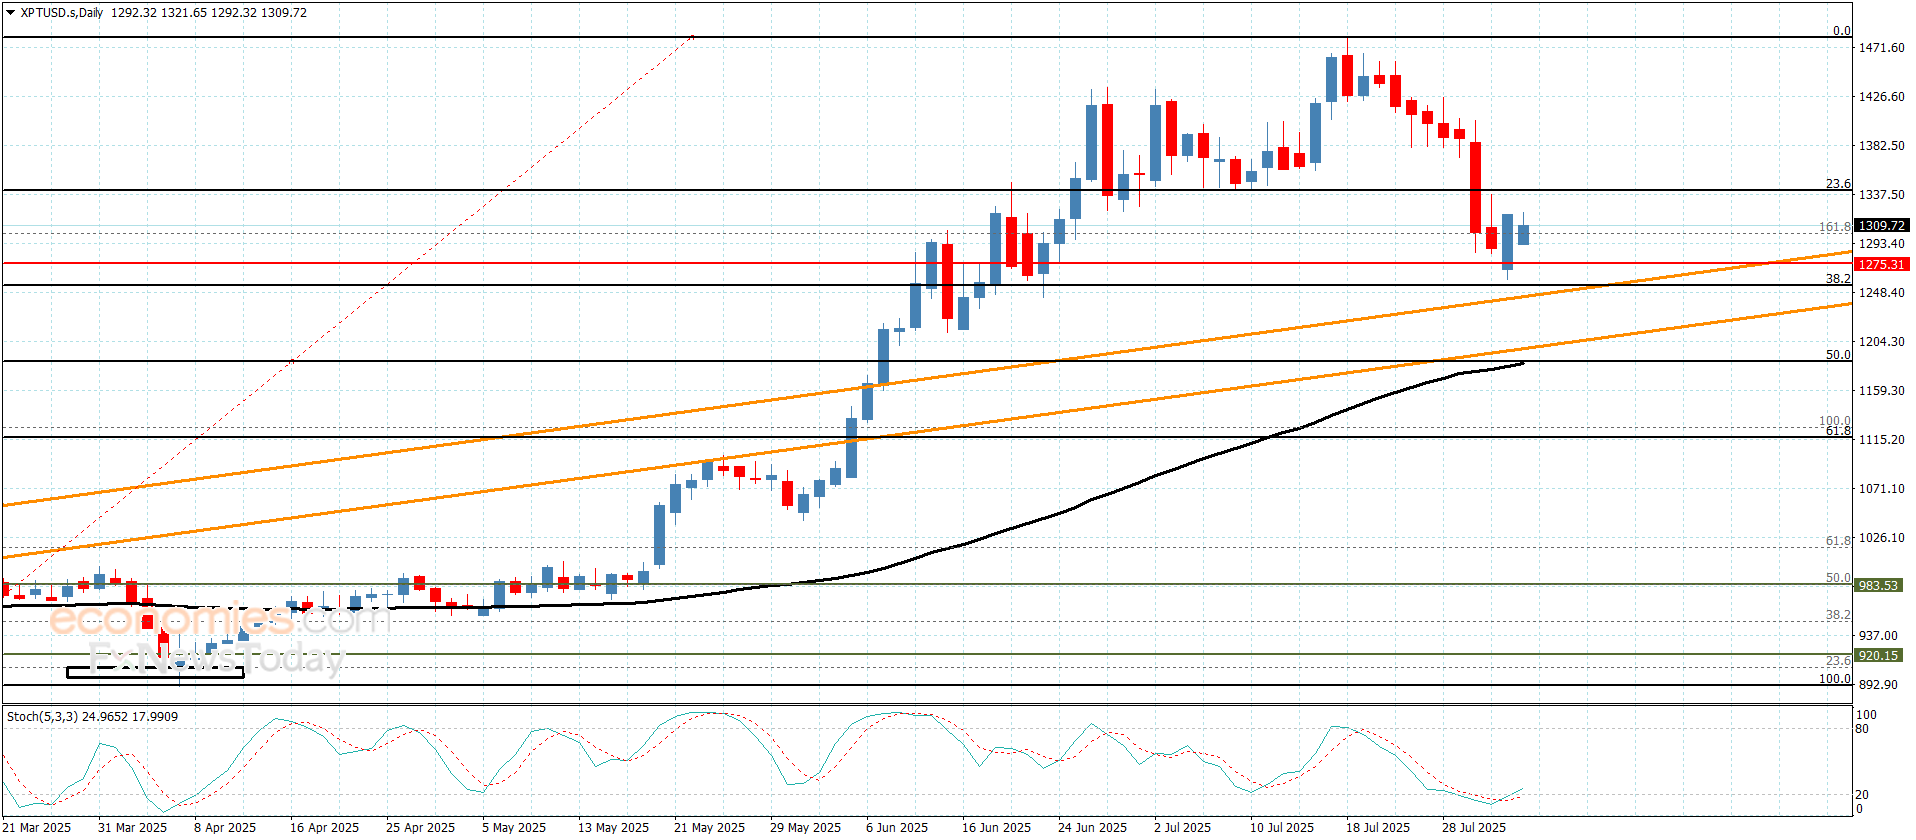
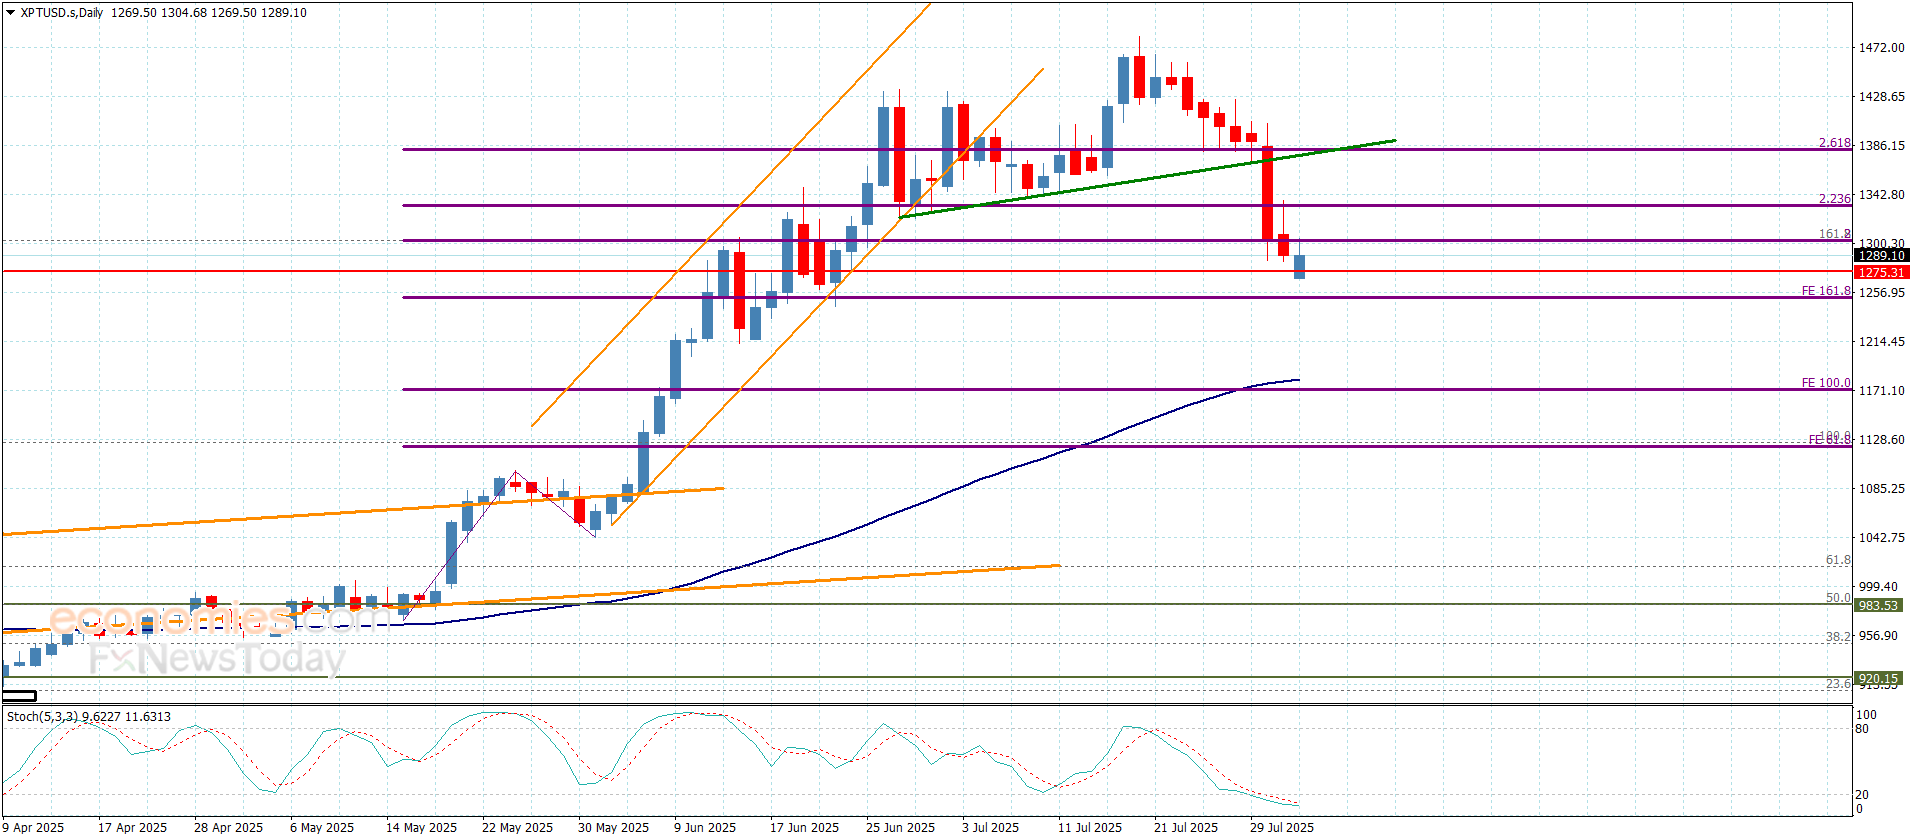
Platinum price ended its last bearish correctional attack by hitting $1260.40 level, approaching from the second correctional target, to notice forming some bullish waves, to settle near $1310.00.
Note that the continuation of forming main support at $1245.00 level against the current trading, beside stochastic attempt to provide positive momentum will increase the chances of activating the bullish attempts, to expect its rally towards $1342.00 and surpassing this barrier might extend the trading towards $1383.00, representing the initial main target for the bullish attempts.
The expected trading range for today is between $1270.00 and $1342.00
Trend forecast: Bullish
Silver (XAG/USD) continues to struggle under the weight of a stronger US Dollar, extending its decline from the 14-year high of $39.53 reached on July 23. At the time of writing, the white metal is trading near $36.50 during the American trading session, down nearly 4.5% so far this week, with traders turning cautious ahead of Friday’s key US Nonfarm Payrolls (NFP) report at 12:30 GMT.
Technically, on the daily chart, Silver has broken below the ascending channel that had supported its uptrend since early April, marking a clear shift in market structure. This breakdown suggests bullish momentum has faded and a deeper correction may be unfolding. The metal is now hovering just above the 50-day Exponential Moving Average (EMA) at $36.54, which acts as immediate support. A daily close below this zone could expose the next key downside target at the 100-day Simple Moving Average (SMA) near $34.65.
Momentum indicators reinforce the bearish case. On the daily chart, the Relative Strength Index (RSI) has slipped to 40, signaling weakening momentum and a slide toward oversold territory. Meanwhile, the MACD has turned negative, with a bearish crossover in place, signaling further downside risks.
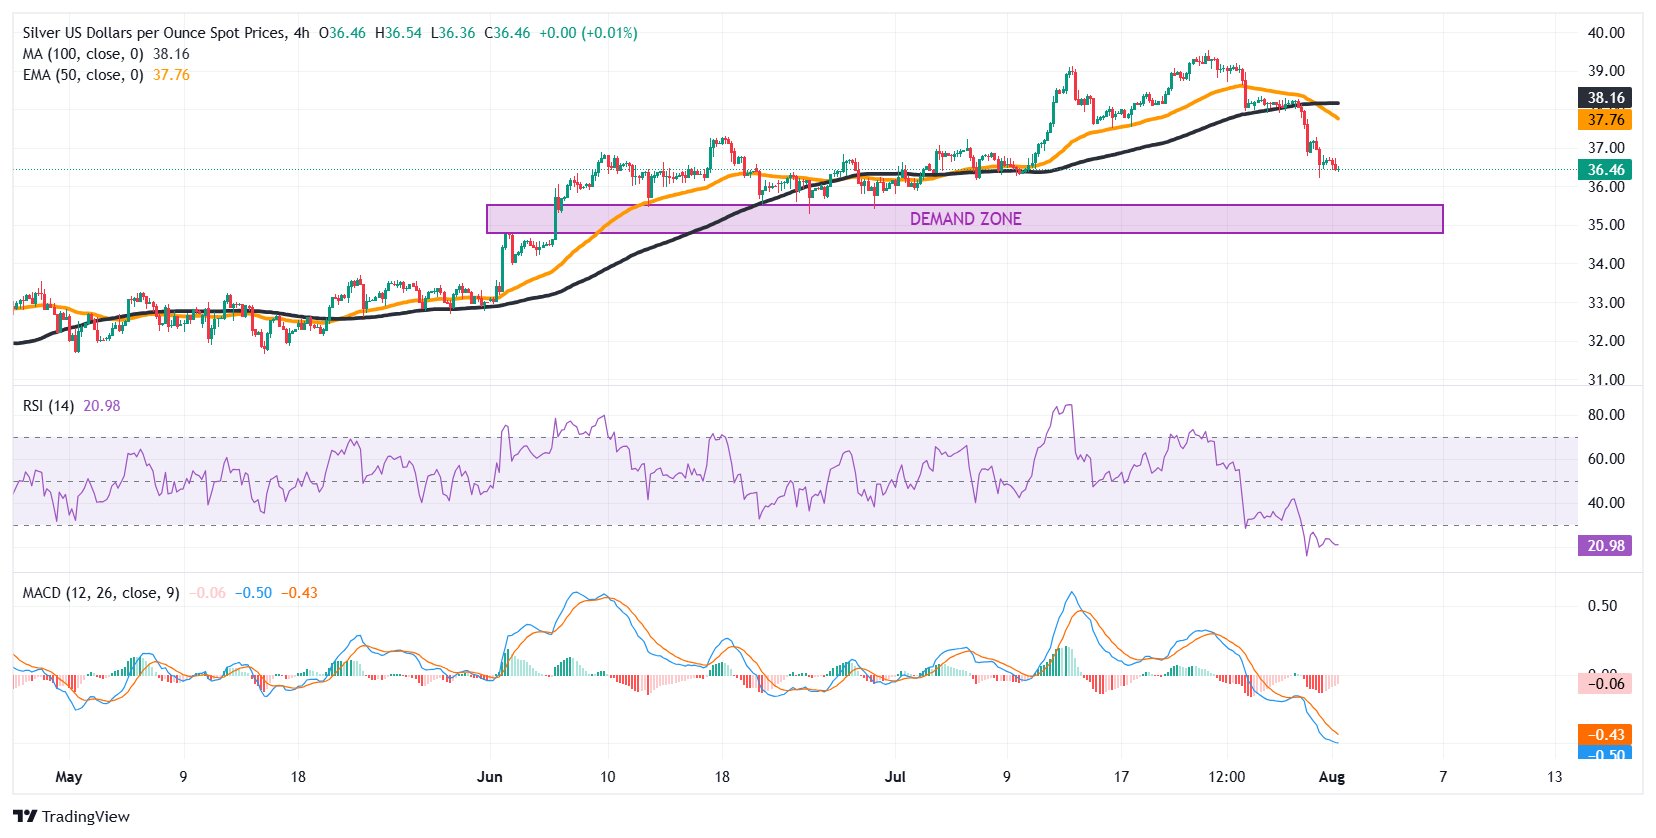
Zooming into the 4-hour timeframe, Silver has broken below both the 50-EMA and 100-SMA, underscoring persistent short-term selling pressure. Price is now approaching a key demand zone in the $35.30-$35.70 range, which could offer some near-term support. However, with the 4-hour RSI plunging to oversold levels near 21, a short-term bounce is possible. Still, the MACD remains deep in negative territory, suggesting the broader bias remains tilted to the downside — unless a softer-than-expected NFP print sparks a reversal.
Silver is a precious metal highly traded among investors. It has been historically used as a store of value and a medium of exchange. Although less popular than Gold, traders may turn to Silver to diversify their investment portfolio, for its intrinsic value or as a potential hedge during high-inflation periods. Investors can buy physical Silver, in coins or in bars, or trade it through vehicles such as Exchange Traded Funds, which track its price on international markets.
Silver prices can move due to a wide range of factors. Geopolitical instability or fears of a deep recession can make Silver price escalate due to its safe-haven status, although to a lesser extent than Gold’s. As a yieldless asset, Silver tends to rise with lower interest rates. Its moves also depend on how the US Dollar (USD) behaves as the asset is priced in dollars (XAG/USD). A strong Dollar tends to keep the price of Silver at bay, whereas a weaker Dollar is likely to propel prices up. Other factors such as investment demand, mining supply – Silver is much more abundant than Gold – and recycling rates can also affect prices.
Silver is widely used in industry, particularly in sectors such as electronics or solar energy, as it has one of the highest electric conductivity of all metals – more than Copper and Gold. A surge in demand can increase prices, while a decline tends to lower them. Dynamics in the US, Chinese and Indian economies can also contribute to price swings: for the US and particularly China, their big industrial sectors use Silver in various processes; in India, consumers’ demand for the precious metal for jewellery also plays a key role in setting prices.
Silver prices tend to follow Gold’s moves. When Gold prices rise, Silver typically follows suit, as their status as safe-haven assets is similar. The Gold/Silver ratio, which shows the number of ounces of Silver needed to equal the value of one ounce of Gold, may help to determine the relative valuation between both metals. Some investors may consider a high ratio as an indicator that Silver is undervalued, or Gold is overvalued. On the contrary, a low ratio might suggest that Gold is undervalued relative to Silver.
A decisive and sustained breakout above today’s high would put gold back into the pennant formation. Potential support would then be around the moving averages. If this scenario begins to unfold and momentum stays muted, the pennant pattern may be in the process of expanding its footprint as consolidation continues.
This week’s low establishes a higher swing low, which retains the pattern of recent higher swing lows. Moreover, the recent upside breakout of the pattern failed to follow-through and generated a lower swing high. New trendlines have been added to the expanded parameters of the pattern, while the initial boundary lines remain as dotted blue lines.
The new territory of the pennant shows that consolidation could continue for another month or so before a decisive breakout from the new parameter’s triggers, given the location of the pennant triangle apex. Key price levels are last week’s lower swing high of $3,349 and this week’s higher swing low at $3,268. Trendlines indicate a narrower price range but are less unreliable as a signal.
The weekly chart provides supporting evidence that strength could be maintained within the newly formed pennant boundaries. This week’s low found support near the long-term 20-Week MA. It was followed by a rally that looks likely to end the week in the green and near the highs for the week. Unless there is a sharp selloff before the closing of the session, gold will form a bullish hammer candlestick pattern. It is interesting to note that this bullish candlestick pattern will follow last week’s bearish shooting star pattern.
For a look at all of today’s economic events, check out our economic calendar.
The U.S. dollar index (DXY) surged to its highest level since May 29, making gold more expensive for non-dollar holders. This currency pressure has reinforced bearish momentum for gold in the short term, with traders cautious following another firm set of U.S. macro readings. The Federal Reserve left its benchmark rate unchanged at 4.25%-4.50% on Wednesday and gave no signal for a September rate cut.
Recent U.S. economic data—GDP, jobless claims, and PCE inflation—all supported the Fed’s hawkish hold, reinforcing reluctance to pivot dovishly. “Gold remains weighed by reduced bets for Fed rate cuts for the rest of 2025,” said Han Tan, chief market analyst at Nemo.Money.
While the macro backdrop leans bearish for gold, geopolitical risks are offering partial support. Former President Donald Trump reintroduced aggressive tariffs targeting Canada, Brazil, India, and Taiwan—moves that could drag on global economic growth and potentially lift safe-haven demand.
June inflation data already reflected early tariff impacts, with price increases on some imported goods. The full economic implications remain unclear, but growing trade tensions could eventually support gold as investors hedge broader global risk.
Physical gold demand picked up in Asia this week as lower spot prices spurred buying interest, especially from Indian and Chinese markets. However, continued price swings and weak sentiment prevented a stronger rebound in physical flows. With gold hovering below key technical levels, retail interest remains tepid.
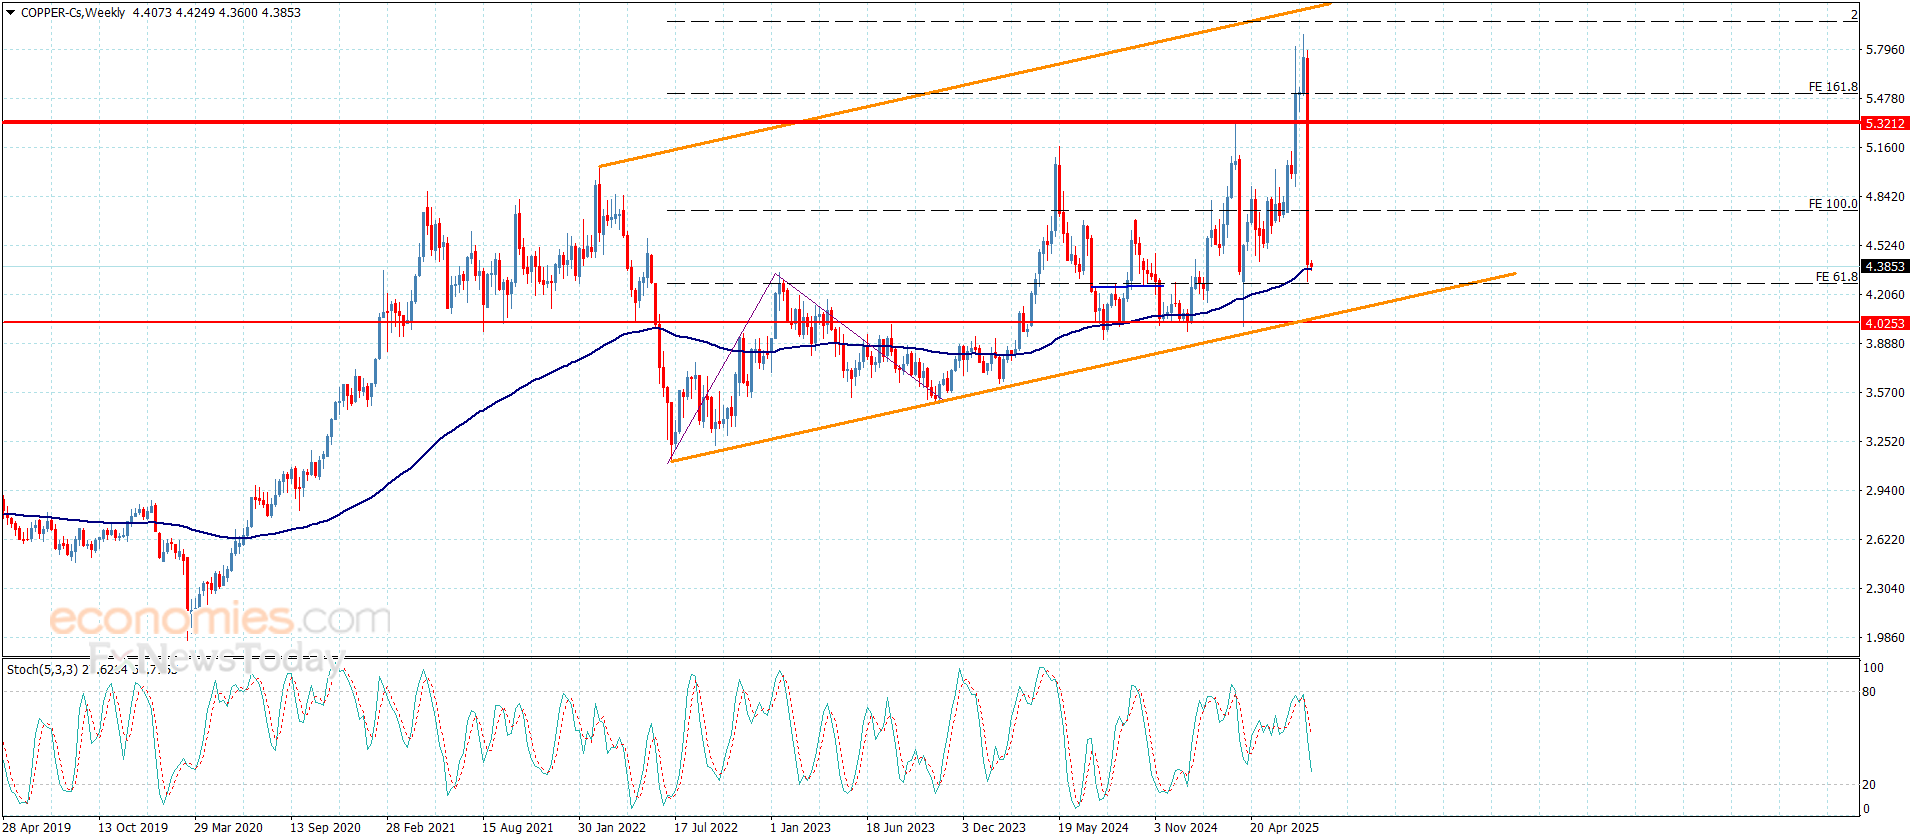
Copper price continued to form bearish trading, to reach the target at $4.2600 forming an intraday support against the current trading, despite the main stability within the bullish channel’s levels, the attempt of providing negative momentum from the main indicators that might push the price to press on the current support, while breaking it will extend the losses to $4.1600 reaching the support of the bullish channel at $4.0550.
Reminding you that activating the bullish attack again requires forming several bullish waves, to settle above $4.7400 level, to ease the mission of recording several gains that might begin at $4.9800.
The expected trading range for today is between $4.1600 and $4.6200
Trend forecast: Bearish
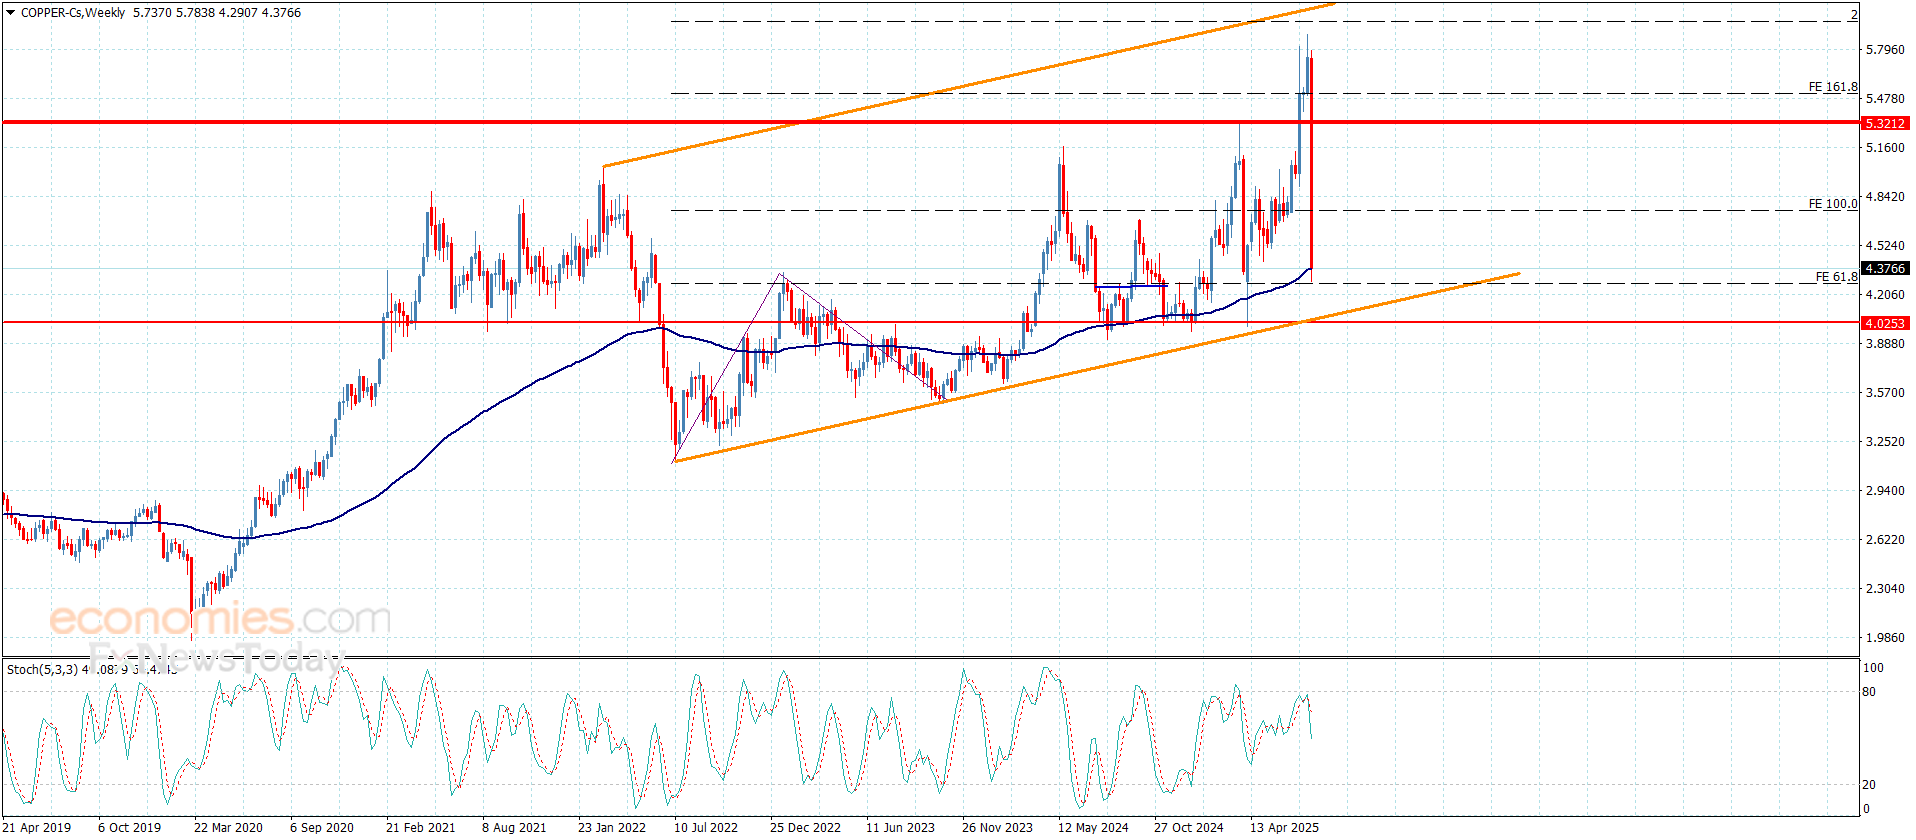
Copper price continued to form bearish trading, to reach the target at $4.2600 forming an intraday support against the current trading, despite the main stability within the bullish channel’s levels, the attempt of providing negative momentum from the main indicators that might push the price to press on the current support, while breaking it will extend the losses to $4.1600 reaching the support of the bullish channel at $4.0550.
Reminding you that activating the bullish attack again requires forming several bullish waves, to settle above $4.7400 level, to ease the mission of recording several gains that might begin at $4.9800.
The expected trading range for today is between $4.1600 and $4.6200
Trend forecast: Bearish
This week’s drop confirmed a failure of a bull pennant pattern. Since it is a trend continuation pattern, a breakdown shows a weakening of the near-term uptrend and the potential for a correction greater than what was seen most recently. Gold is now below the 50-Day MA, with the 200-Day MA becoming a possibility. The 200-Day line is currently at $3,003.
The first pullback from the $3,500 record high reached in April was an approximate match with the 38.2% Fibonacci retracement and a successful test of support at the 50-Day MA. A falling ABCD pattern points to a possible minimum downside target of $3,072. That would exceed the 38.2% level at $3,139. Notice that the 50% retracement target is a little lower at $3,041. So, the $3,072 to $3,041 levels can be seen as a potential zone of support.
A sustained rally above $3,334 would be needed before there were signs of a potential failed breakdown. Moreover, moving averages are in the process of confirming bearish indications. Both the 20-Day and 50-Day MA have converged with the trendline at the bottom of the pennant and will be crossing below the line. They also show potentially strong resistance.
The weekly chart confirms the bearish potential for gold short-term as a bearish shooting star candlestick pattern triggered earlier in week and led to a four-week low of $3,268. A three-week lower close looks likely this week as the sellers remain in charge on a weekly basis. But on the weekly chart gold is at a potentially significant support level as the low for the week hit the 20-Week MA for the first time since it was reclaimed in January. This is one of the reasons to also consider a bullish scenario regardless of how clear the bearish side looks.
For a look at all of today’s economic events, check out our economic calendar.
A decisive rally above today’s high will trigger a one-day bullish reversal, confirmed by a daily close above it. But an advance above the recent lower swing high at $3.19 presents a more reliable level to indicate that demand is improving and may continue. An advance above $3.19 will trigger a bullish reversal of the short-term decline that began from the $3.63 swing high. If triggered, the 20-Day MA, now at $3.29 and falling, is the first upside target and it could easily be surpassed if demand continues to improve.
Subsequently, the area around the 200-Day MA, currently at $3.64, identifies the next upside target. Particularly, given that the 50-Day MA just converged with the 200-Day line and they identify a similar price level as possible resistance. An AVWAP line that began off the April swing low, also shows support around those two lines. Given the confluence of indicators, the price zone could potentially act like a magnet as price is drawn towards it. Nevertheless, it identifies a potentially significant pivot zone, as a decisive rally above it will signal a breakout and further confirm strength.
The establishment of support near the long-term trendline shows the possible completion of the bearish correction that began following the trend high of $4.90 in March. Notice that the volatility of the long-term uptrend has been contained within a large rising parallel trend channel (purple).
Resistance was successfully tested multiple times at the beginning of year, eventually leading to a sustained correction. Given the symmetrical nature of the channel, a bounce off one side points to the other side. Once the other side is reached, as happened today with a touch of the bottom of the channel, a move to the other side is possible.
For a look at all of today’s economic events, check out our economic calendar.