The main tag of GoldPrice Articles.
You can use the search box below to find what you need.
[wd_asp id=1]
The main tag of GoldPrice Articles.
You can use the search box below to find what you need.
[wd_asp id=1]
The price of (Silver) declined in its last intraday trading, amid the dominance of the negative signals on the (RSI), after reaching overbought levels with the stability of the critical resistance level at $39.10, which forced it to attempt to gain the required positive momentum for breaching it, which led the price to break a minor bullish bias line that supports the last move of the price, which might put it under negative pressure temporarily, where it approaches from leaning on the support of EMA50, amid the dominance of the main bullish trend on the short-term basis and its trading alongside a supportive bias line for the trend.
Therefore, our expectations suggest a rise in (silver) price in their upcoming intraday trading, especially if the support settles at $38.40 level, to target the mentioned resistance level at $39.10.
Expected trading range for today: Between the support at $38.40 and resistance at $39.10
Today’s forecast: Neutral
High-accuracy trading signals delivered directly to your Telegram. Subscribe to specialized packages tailored for the world’s most important markets – all powered by BestTradingSignal.com .
The longer the subscription, the greater the savings and the more value you get.
Weekly performance report available here: Trading Signal Results – Week of July 14–18, 2025
The (ETHUSD) price declined in its last intraday trading, to attempt to offload some of its clear overbought conditions on the (RSI), especially with the beginning of the negative signals emergence, to gather its positive strength that might assist it to recover and rise again, leaning on the support of its EMA50, amid the dominance of the main bullish trend and its trading alongside a minor bullish bias that supports this trend.
Therefore, our expectations suggest a rise in the (ETHUSD) price in the upcoming intraday trading, conditioned by the stability of the support at $3,500, to target the critical resistance level at $3,800.
The expected trading range is between $3,450 support and $3,800 resistance.
Today’s forecast: Bullish
High-accuracy trading signals delivered directly to your Telegram. Subscribe to specialized packages tailored for the world’s most important markets – all powered by BestTradingSignal.com .
The longer the subscription, the greater the savings and the more value you get.
Weekly performance report available here: Trading Signal Results – Week of July 14–18, 2025
Gold price is licking its wounds below $3,400 early Friday, having bounced off the $3,350 psychological mark. Despite the recent pullback from five-week highs, Gold price remains on track to book a weekly gain.
Markets have turned a bit in Friday’s Asian trading, assessing the gravity of the ongoing military conflict between Thailand and Cambodia.
Both Asian nations have requested the United Nations Security Council to call an emergency meeting on Friday, according to China’s CCTV News.
The neighbours are locked in a bitter spat over an area known as the Emerald Triangle, where the borders of both countries and Laos meet, and which is home to several ancient temples.
Investors remain worried that the clash between these two countries does not translate into a wider regional conflict.
Risk-off flows revive the haven demand for both the US Dollar (USD) and Gold price, fuelling a bounce in the former while capping the latter’s downside.
Additionally, markets remain wary ahead of next week’s crucial US Federal Reserve (Fed) and the Bank of Japan (BoJ) monetary policy decisions.
Hence, a short-covering recovery in Gold price cannot be ruled out as the USD heads for the biggest weekly drop on easing trade tensions.
US trade deals with Japan, Indonesia and Philippines, as well as, some progress on the US and European Union (EU) trade negotiations have helped ebb fears over a potential tariff war restarting as the August 1 deadline nears.
Besides, the mid-tier US Durable Goods Orders data could keep traders entertained heading into the weekend.
Gold price extended the downside on Thursday and settled below the 23.6% Fibonacci Retracement (Fibo) level of the April record rally at $3,377, then a powerful resistance-turned-support.
However, the 14-day Relative Strength Index (RSI) remains above the midline, currently near 52, keeping buyers hopeful.
They need to recapture the abovementioned Fibo level of $3,377 to regain the upper hand.
Acceptance above the $3,440 static resistance is critical for a sustained uptrend, targeting the June 16 high of $3,453 next.
If the selling bias intensifies again, Gold price could challenge the $3,340 area, which is the confluence of the 21-day SMA and the 50-day SMA.
The next support on sellers’ radars is the 38.2% Fibo level of the same rally at $3,297.
Gold has played a key role in human’s history as it has been widely used as a store of value and medium of exchange. Currently, apart from its shine and usage for jewelry, the precious metal is widely seen as a safe-haven asset, meaning that it is considered a good investment during turbulent times. Gold is also widely seen as a hedge against inflation and against depreciating currencies as it doesn’t rely on any specific issuer or government.
Central banks are the biggest Gold holders. In their aim to support their currencies in turbulent times, central banks tend to diversify their reserves and buy Gold to improve the perceived strength of the economy and the currency. High Gold reserves can be a source of trust for a country’s solvency. Central banks added 1,136 tonnes of Gold worth around $70 billion to their reserves in 2022, according to data from the World Gold Council. This is the highest yearly purchase since records began. Central banks from emerging economies such as China, India and Turkey are quickly increasing their Gold reserves.
Gold has an inverse correlation with the US Dollar and US Treasuries, which are both major reserve and safe-haven assets. When the Dollar depreciates, Gold tends to rise, enabling investors and central banks to diversify their assets in turbulent times. Gold is also inversely correlated with risk assets. A rally in the stock market tends to weaken Gold price, while sell-offs in riskier markets tend to favor the precious metal.
The price can move due to a wide range of factors. Geopolitical instability or fears of a deep recession can quickly make Gold price escalate due to its safe-haven status. As a yield-less asset, Gold tends to rise with lower interest rates, while higher cost of money usually weighs down on the yellow metal. Still, most moves depend on how the US Dollar (USD) behaves as the asset is priced in dollars (XAU/USD). A strong Dollar tends to keep the price of Gold controlled, whereas a weaker Dollar is likely to push Gold prices up.
It is interesting to note that the 20-Day and 50-Day MAs recently converged and are identifying a similar price area. This reflects the decline in volatility recently that is also expressed by the pennant symmetrical triangle. The convergence of the moving averages may occur before volatility increases in a noticeable way. Notice how in January, a bull breakout of consolidation triggered as the same two moving averages converged then as well. The 50-Day line has done a relatively good job of identifying dynamic trend support since it was reclaimed in January. It’s now $3,338.
A second bull breakout attempt of the pennant is indicated on a rally above this week’s high of $3,439, with a clearer trigger above $3,451 (B). But then gold should see a clear pickup in bullish momentum if it is to have a chance to exceed the record high of $3,500. If a move above the record high can be sustained, then gold first heads towards the initial target of a rising ABCD pattern (purple) at $3,578. A little higher is the projected 227.2% target at $3,595 for a long-term rising ABCD pattern that begins from an August 2018 swing low.
Despite gold being in a strong bull trend, there is always the potential for a breakdown of the pennant and a bearish correction rather than an upside continuation. A drop below support around the interim swing low of $3,366 will show weakness and a potential failure of the pennant. Further weakness would then be indicated on a drop below the higher swing low at $3,247 (C). There is only one more day till the week is over. Be aware that this week’s weekly bullish continuation signal will not confirm on that time frame unless this week ends above last week’s high of $3,377.
For a look at all of today’s economic events, check out our economic calendar.
Today’s bearish behavior keeps the next lower support zone in sight. It is around a long-term rising trendline, and an anchored volume weighted average price (AVWAP) level around $2.96. The trendline has not been challenged since it was established by connecting to the August 2024 swing low. This contrasts with the AVWAP line, which showed support during the market corrections in October 2024 and April.
Since the two lines are marking a similar potential support area, the price area takes on greater potential significance. However, if it fails to lead to a bottom, the next lower support zone is shown from around the April swing low of $2.86 and down to a 78.6% retracement level at $2.79. There is also the completion of a bearish measured move that matches a downswing starting from an interim swing high on March 31, on a percentage basis that matches around $2.79.
Since there is only one more trading day to the week, a weekly closing price below the prior swing low of $3.15 will confirm a bearish continuation of the decline from the June swing high (A). That will open the door to a possible drop to the trendline and AVWAP price zone. If support is seen and it is followed by a bullish reversal, a new higher swing low will be established. Given the bearish implications currently in the chart, rallies are likely to encounter resistance that turns price back down.
For a look at all of today’s economic events, check out our economic calendar.
Support around last week’s swing low was marked by the confluence of an AVWAP line starting from the April trend low, the neckline breakout level of a double bottom that subsequently formed (prior resistance becomes support), and a rising trendline that is the bottom of a trend channel. A reversal from one side of the channel opens the door to the possibility of reaching the other side. Nevertheless, the presence of the channel increases the chance that lower targets may be reached.
A decisive rally above $68.34 will trigger a bullish continuation, while potential resistance is defined by the convergence of the 200-Day MA and the 20-Day MA, between $68.89 and $68.92, respectively. But given the potential for upside momentum on a bounce off the bottom of the channel, that potential resistance zone should easily be broken. If it is not, that would not be consistent with a strong bullish reversal. Crude oil has done a good job of confirming the trend channel by hitting the top line on multiple days recently and finding resistance.
Upside targets can be considered starting at the 38.2% Fibonacci retracement at $70.14, and the 50% retracement level at $71.73. The price zone around the 50% level is strengthened by an AVWAP level from the April 2024 swing high around $72.12. Crude oil might even reach the 61.8% Fibonacci retracement area at $73.31, possibly putting it near the downtrend line. A bullish reversal has the potential to reach the dashed midline line of the rising channel. Given the angle of ascent, the 61.8% targets look very possible.
For a look at all of today’s economic events, check out our economic calendar.
Gold price (XAU/USD) trades almost 0.7% lower around $3,360 during the European trading session on Thursday. The precious metal faces a sharp selling pressure as global trade worries have eased amid hopes that the United States (US) and the European Union (EU) will close a trade agreement before the August 1 tariff deadline.
On Wednesday, a report from Financial Times (FT) showed that EU officials have signaled green signal to a trade pact with the US to avert a damaging trade war. Market experts believe the US-Japan deal confirmed on Tuesday increased fears among EU officials that they could their automobile export market share in the US economy, as Washington has slashed tariffs on cars from Tokyo to 15%.
The minutes of the US-Japan deal showed that the baseline and automobile levy on imports from Tokyo to Washington will be 15%. The US charges 25% import duty on all foreign cars, which is separate from the baseline tariff rate.
Easing global trade tensions have diminished demand for safe-haven assets, such as Gold.
Meanwhile, a slight recovery move in the US Dollar (US) seen during the day has also weighed on the Gold price. Technically, a higher US Dollar makes the Gold price an expensive bet for investors.
The US Dollar Index (DXY), which tracks the Greenback’s value against six major currencies, rebounds to near 97.40 after posting a fresh over two-week low near 97.00 earlier in the day.
Going forward, the major trigger for the Gold price will be the Federal Reserve’s (Fed) monetary policy meeting, which is scheduled for next week.
Gold price faces selling pressure after failing to break the Symmetrical Triangle formation on the upside – a move that often leads to volatility expansion. The upward-sloping trendline of the above-mentioned chart pattern is placed from the May 15 low of $3,120.83, while its downward-sloping border is plotted from the April 22 high around $3,500
The 20-day Exponential Moving Average (EMA) still acts as a key support area for the Gold price around $3,355.
The 14-day Relative Strength Index (RSI) falls inside the 40.00-60.00 range, suggesting selling pressure at higher levels.
The Gold price would fall towards the round-level support of $3,200 and the May 15 low at $3,121, if it breaks below the May 29 low of $3,245.
Looking up, the Gold price will enter in an unchartered territory if it breaks above the psychological level of $3,500 decisively. Potential resistances would be $3,550 and $3,600.
Gold has played a key role in human’s history as it has been widely used as a store of value and medium of exchange. Currently, apart from its shine and usage for jewelry, the precious metal is widely seen as a safe-haven asset, meaning that it is considered a good investment during turbulent times. Gold is also widely seen as a hedge against inflation and against depreciating currencies as it doesn’t rely on any specific issuer or government.
Central banks are the biggest Gold holders. In their aim to support their currencies in turbulent times, central banks tend to diversify their reserves and buy Gold to improve the perceived strength of the economy and the currency. High Gold reserves can be a source of trust for a country’s solvency. Central banks added 1,136 tonnes of Gold worth around $70 billion to their reserves in 2022, according to data from the World Gold Council. This is the highest yearly purchase since records began. Central banks from emerging economies such as China, India and Turkey are quickly increasing their Gold reserves.
Gold has an inverse correlation with the US Dollar and US Treasuries, which are both major reserve and safe-haven assets. When the Dollar depreciates, Gold tends to rise, enabling investors and central banks to diversify their assets in turbulent times. Gold is also inversely correlated with risk assets. A rally in the stock market tends to weaken Gold price, while sell-offs in riskier markets tend to favor the precious metal.
The price can move due to a wide range of factors. Geopolitical instability or fears of a deep recession can quickly make Gold price escalate due to its safe-haven status. As a yield-less asset, Gold tends to rise with lower interest rates, while higher cost of money usually weighs down on the yellow metal. Still, most moves depend on how the US Dollar (USD) behaves as the asset is priced in dollars (XAU/USD). A strong Dollar tends to keep the price of Gold controlled, whereas a weaker Dollar is likely to push Gold prices up.
The light sweet crude oil market has shown itself to be bullish as we continue to hang around the $65 level. The $65 level also is backed up by the 50-day EMA, and it is the area that we previously had seen a lot of resistance. We had a massive move higher after the Israel airstrikes in Iran, but once the peace was signed and agreed to, oil markets collapsed. What I find interesting, though, is that we are hanging around this same area of previous resistance, and it seems like the market is getting comfortable. We have a lot of wicks to the upside. So, if we can break above the highest one, which is basically $66.50, then I think oil goes higher, probably more of a grind.
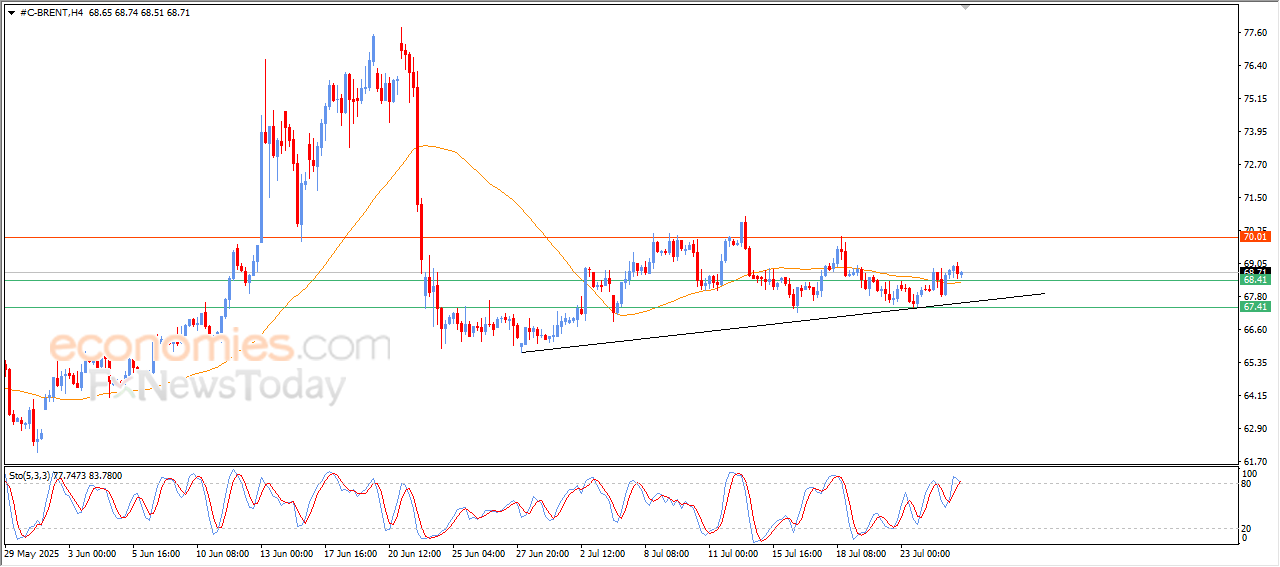
Brent looks very much the same, although we have the 50 day EMA above and the $68 level offering resistance. So, in this case, I’d like to see Brent break above $69. If we can do that, then the 200 day EMA gets targeted at $71.20. Short-term pullbacks are possible and quite frankly, we could just continue to stumble here. But I think we’ve got a situation where seasonality favors higher prices. And I do think that the market is trying to do everything it can to build up confidence to go to the upside. Because of this, I’m not really looking to short the market, but I think really at this point in time, we’re more or less in a wait and see type of situation after that wild move. I think most participants are a bit exhausted.
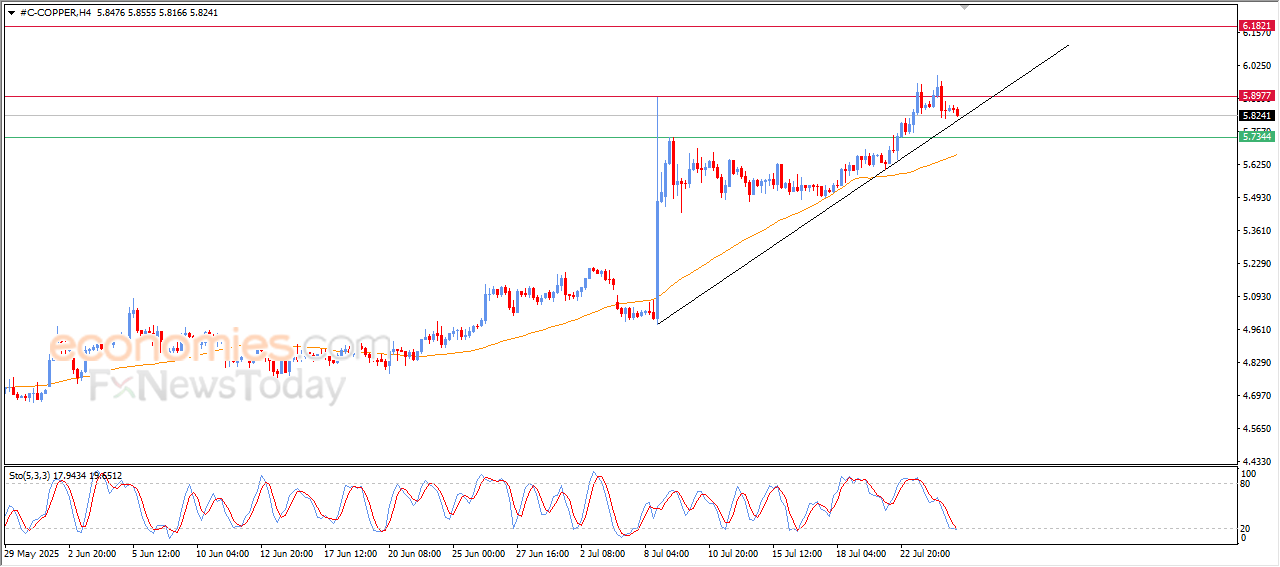
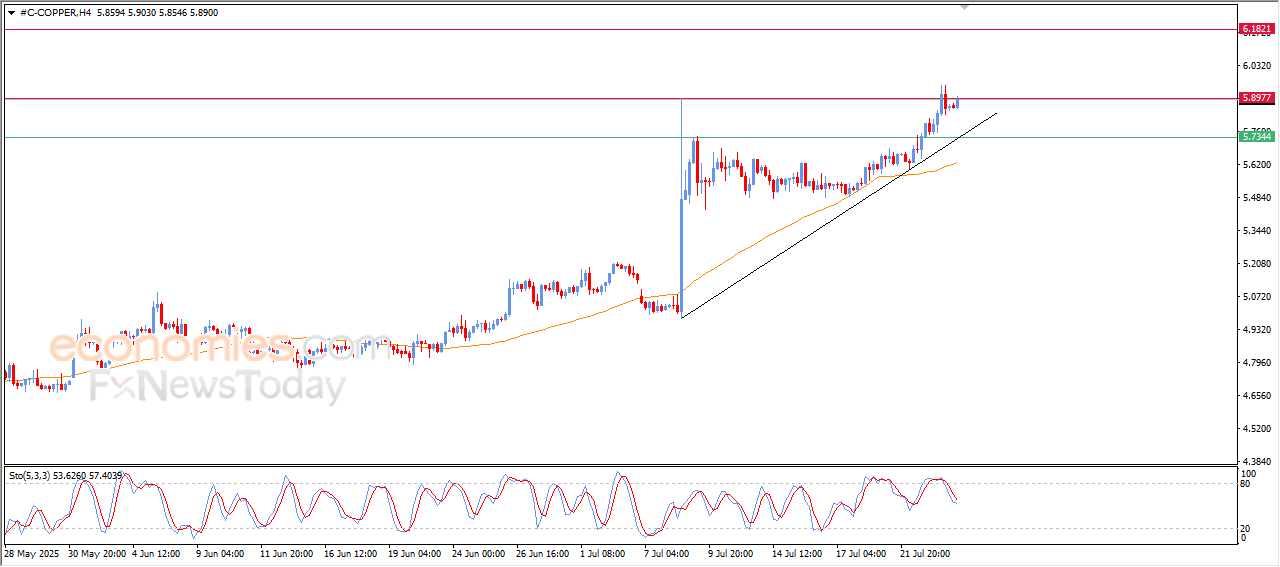
Copper price soars high in its last intraday trading, to reach the critical resistance at $5.89, which represents our yesterday’s target amid the dominance of the main bullish trend on the short-term basis and its trading alongside a supportive minor bias line for the trend, taking advantage of the dynamic support that is represented by its trading above EMA50, this rise came after the success in offloading its overbought condition on the (RSI), opening the way for achieving more gains.
Therefore, our expectations suggest a rise in (copper) price in its upcoming intraday trading, especially when breaching the mentioned resistance at $5.89, to target the next resistance level at $6.1820.
The expected trading range for today is between $5.7344 and $6.0500
Trend forecast: Bullish
High-accuracy trading signals delivered directly to your Telegram. Subscribe to specialized packages tailored for the world’s most important markets – all powered by BestTradingSignal.com .
The longer the subscription, the greater the savings and the more value you get.
Weekly performance report available here: Trading Signal Results – Week of July 14–18, 2025
Global markets witnessed steady growth in Copper Sulphate Prices, with notable surges in the USA, China, and South Africa. Our latest Copper Sulphate Price Trend Report offers in-depth analysis, forecast insights, historical trends, and an updated price chart to support smarter procurement decisions. Stay ahead with accurate data and market direction.
The Copper Sulphate Price Trend Report for Q2 2025 reflects dynamic pricing shifts across major global regions, influenced by industrial activity, agricultural demand, and market logistics. This report covers a deep dive into Copper Sulphate Prices, analyzing trends, historical data, and forecasting upcoming movements with a clear view of the Copper Sulphate price chart, index movements, and market forces.
Copper Sulphate Price Trend Analysis
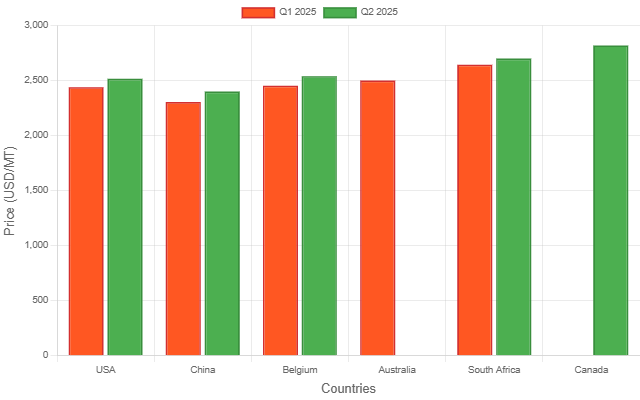
During the second quarter of 2025, Copper Sulphate Prices exhibited moderate increases in key global markets. The USA saw prices reach US$ 2516/MT, while China recorded US$ 2400/MT, showing steady domestic consumption. Belgium and Canada followed similar upward trajectories, indicating strong European and North American demand recovery.
This trend aligns with rising industrial usage and stable agricultural applications, especially in fertilizers and fungicides.
Get Real-Time Price Analysis: https://www.imarcgroup.com/copper-sulphate-pricing-report/requestsample
Copper Sulphate Price Forecast 2025
The Copper Sulphate future price is expected to remain firm in the short term due to persistent demand and limited inventory buildup. With increasing consumption from the agriculture and electronics sectors, the price of Copper Sulphate may continue on a gradual upward trend throughout the latter half of 2025.
However, macroeconomic uncertainties and trade route fluctuations could impact the forecast in select regions. Stakeholders are advised to monitor inventory levels and input costs closely.
Copper Sulphate Price Chart & Index
The Copper Sulphate price index in Q2 2025 reveals moderate yet consistent growth compared to Q1. The Copper Sulphate price chart reflects this increase across regions, notably in North America and South Africa, where industrial rebound and logistics optimization supported the trend.
The global average also rose slightly, indicating broader market strength. Users can access region-specific pricing and historical indices through our full pricing platform.
Copper Sulphate Price Historical Analysis Data
A comparative analysis of the Copper Sulphate price history from 2024 to 2025 reveals a steady recovery in prices after a subdued demand in late 2023. In 2024, prices fluctuated amid input volatility, while in 2025, the market showed stabilization and growth.
This consistency highlights the resilience of Copper Sulphate across industrial applications, especially in mining, printing, and agriculture.
Copper Sulphate Price Comparison : Q1 vs Q2 2025
Across Q1 and Q2 2025, Copper Sulphate Prices in key regions recorded incremental increases. The USA, China, Belgium, and South Africa all experienced percentage gains in pricing due to stronger demand and slightly tightened supply chains. This upward shift is expected to continue if seasonal demand persists in Q3.
Price Trends and Regional Variations
North America: The Copper Sulphate Prices in the USA and Canada rose due to higher agricultural usage and a resurgence in chemical production.
Asia Pacific: China witnessed a moderate increase driven by localized manufacturing growth and post-holiday agricultural activity.
Global: Europe and Africa, particularly Belgium and South Africa, saw significant price action due to export orders and seasonal demand spikes.
Factors Influencing Copper Sulphate Prices
Specific Future Trends and Outlooks
Near Term: Slight upward momentum expected due to seasonal planting and steady industrial activity.
Long Term: By early 2026, prices may stabilize with increased global supply unless disrupted by major geopolitical or energy factors.
Historical Trends
Recent Copper Sulphate Price Trends and Market Activity
In Q2 2025, global Copper Sulphate Prices rose consistently across all key markets. This was attributed to improved logistics, resumed mining operations, and bulk procurement by fertilizer manufacturers. Additionally, new environmental regulations in some countries have led to changes in sourcing patterns, further shaping pricing.
List of Major Copper Sulphate Suppliers
These companies serve as primary suppliers across various continents, catering to both agricultural and industrial segments.
News & Recent Development
Browse Here More Other Related Reports:
· Phosphoric Acid Price Trend Report
· Acetic Acid Price Trend Report
· Ammonium Perchlorate Price Trend Report
· Boric Acid Price Trend Report
About Us:
IMARC Group is a global management consulting firm that provides a comprehensive suite of services to support market entry and expansion efforts. The company offers detailed market assessments, feasibility studies, regulatory approvals and licensing support, and pricing analysis, including spot pricing and regional price trends. Its expertise spans demand-supply analysis alongside regional insights covering Asia-Pacific, Europe, North America, Latin America, and the Middle East and Africa. IMARC also specializes in competitive landscape evaluations, profiling key market players, and conducting research into market drivers, restraints, and opportunities. IMARC’s data-driven approach helps businesses navigate complex markets with precision and confidence.
Contact us:
IMARC Group
134 N 4th St. Brooklyn, NY 11249, USA
Email: sales@imarcgroup.com
Tel No: (D) +91 120 433 0800
United States: +1-631-791-1145