The main tag of GoldPrice Articles.
You can use the search box below to find what you need.
[wd_asp id=1]
The main tag of GoldPrice Articles.
You can use the search box below to find what you need.
[wd_asp id=1]
Quebrada Blanca mine in Chile is Teck’s largest copper project. (Image courtesy of Teck Resources.)
Copper surged to a 16-month high in London Wednesday when Teck Resources (TSX: TECK.A, TECK.B)(NYSE: TECK) lowered its copper production guidance for 2025 after persistent setbacks at its Quebrada Blanca (QB) mine in Chile and Highland Valley Copper (HVC) operation in Canada.
Prices climbed as much as 0.5% to $10,815 per tonne on the London Metal Exchange. The company said it now expects to produce 170,000 to 190,000 tons in 2025, down from its previous target of 210,000 to 230,000 tons. Teck also trimmed annual production targets for the next three years.
The QB project has long frustrated investors, coming in $4 billion over budget and years behind schedule. Current challenges include tailings storage at the high-altitude site in the Andes, as well as damage to key equipment and instability within the mine pit.
So far this year, copper prices have risen about 23%, as mounting supply concerns outweigh weak demand in major industrial economies. Analysts have cut output projections after a series of accidents and operational setbacks at mines in Chile, the Democratic Republic of Congo, and Indonesia, leading many to anticipate sizable supply deficits.
Supply worries intensified after Freeport-McMoRan (NYSE: FCX) declared force majeure at its Grasberg mine in Papua, Indonesia—the world’s second-largest copper operation—following severe flooding that halted production. The company confirmed over the weekend that all seven missing workers were found dead after the discovery of five additional bodies.
“We are in a world of unprecedented copper supply disruptions, and many of these issues are not short-term,” analysts at Jefferies wrote in a note. “Yet another miss at QB just adds more fuel to the fire.”
Citigroup analysts expect copper to climb further, forecasting prices could reach $12,000 per tonne in the first half of next year amid supply cuts and favorable macro trends, including a weaker US dollar. They project prices will gradually ease through 2026 as disrupted mines resume production.
Click on chart for live prices.
On the Chicago Mercantile Exchange, three-month copper futures rose 1.15% to $11,343 per tonne ($5.156 per pound).
(With files from Bloomberg)
Technical indicators confirm gold’s extended condition. The relative strength index (RSI) remains in overbought territory, while the slope of the bull trend has steepened notably. This upper dashed line represents the outer boundary of the advance projected from the March base. Though further upside cannot be ruled out, a brief correction would be healthy, allowing the trend to reset before a potential continuation. Without some form of pullback, the odds of a fast, sharp decline increase if momentum falters suddenly.
Initial support lies at the 10-Day moving average, currently near $3,879. A drop below today’s low would hint at the first test of that line. Should it hold, buyers could quickly regain control and drive another leg higher. Deeper support sits at the 20-Day moving average around $3,783, which may come into play if selling accelerates. Given the rapid ascent of recent weeks, a move toward the 20-Day average would not be unexpected and could help stabilize the trend.
For now, no clear weakness has emerged. A rally above today’s $4,059 high would reaffirm the dominant uptrend and continue the pattern of higher highs and higher lows. Given the enthusiasm of recent sessions, a sharp upward burst toward a potential blow-off top remains possible.
The upper estimate on the chart aligns with a measured move projection from the December swing low. Traders should remain alert, however, as any bearish follow-through from current levels could shift attention to lower targets and mark the beginning of a cooling phase.
For a look at all of today’s economic events, check out our economic calendar.
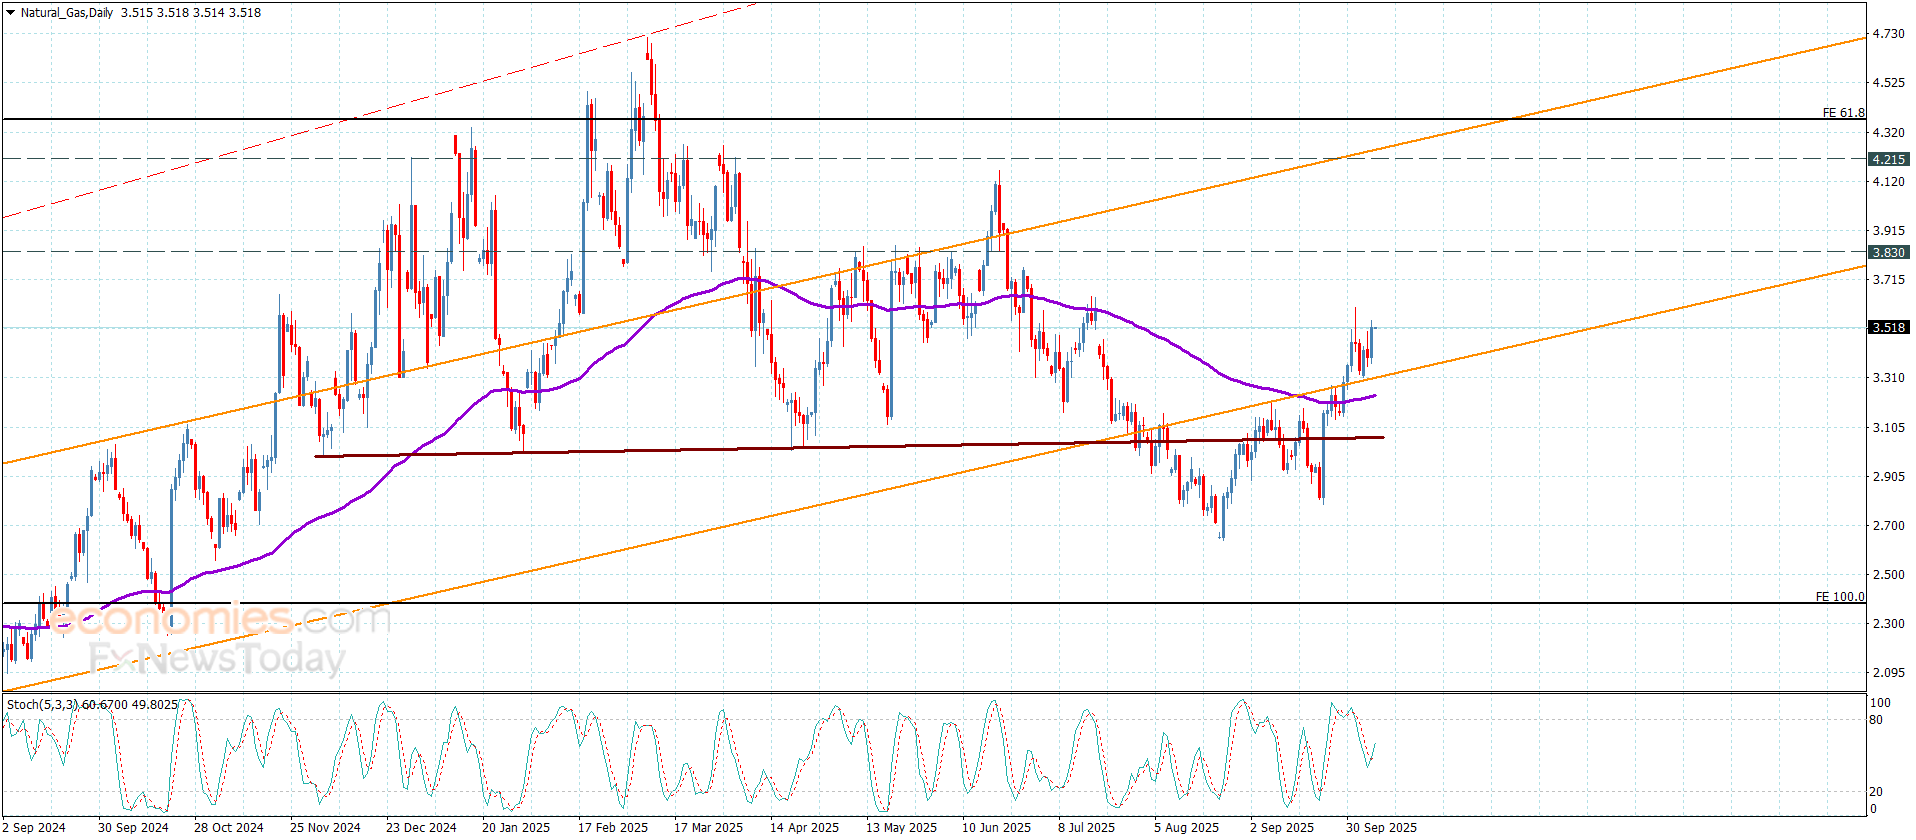
The lower high recorded today raises the potential for a double top bearish reversal if prices decline below Monday’s $3.30 low. Such a move would likely trigger additional selling pressure, especially as it coincides with a breakdown beneath the 10-Day average and tests of dynamic support along a long-term rising trendline. While the 10-Day average provides a short-term directional cue, a decisive close below the uptrend line would carry greater significance, confirming a shift in control toward sellers.
Should natural gas fall beneath the uptrend line, the broader bearish structure – defined by a descending trend channel – could reassert dominance. That scenario opens the door to retests of the recent swing lows and key moving averages. The 20-Day average, currently near $3.13, offers interim support, followed by the 50-Day at $3.02. Importantly, an anchored volume-weighted average price (AVWAP) from a major prior pivot aligns near $2.97, reinforcing the significance of that support zone.
Despite today’s weakness, buyers still have an opportunity to reclaim control. A move above the recent swing high at $3.59 would confirm a resumption of the short-term uptrend and reestablish momentum above the 200-Day average, now near $3.49. Such strength would invalidate the developing double top and signal that bullish forces remain intact. Until then, the market remains vulnerable to deeper retracements, with traders watching whether support near the 10-Day line and trendline can hold in the days ahead.
For a look at all of today’s economic events, check out our economic calendar.
A looming oversupply of crude oil is going to cause prices to take a dive as the world moves on to alternatives to hydrocarbons and economic growth remains weak. This has been the message from virtually every price forecaster for months. Yet benchmark oil prices have remained remarkably stable. Some call it a mystery. Yet there is nothing mysterious about it. Forecasts do not reflect real-life supply and demand.
“There is a bit of a mystery,” Vikas Dwivedi, global energy strategist at Macquarie, told the Financial Times this month. “The whole marketplace is looking for enormous surpluses and yet the price isn’t buckling. Instead of $67 a barrel, why are we not looking at $47 a barrel?”
There are two likely reasons why we are not looking at $47 a barrel. One of these reasons is the EU’s and the United States’ continued efforts to decimate Russia’s energy export income via additional sanctions. Since Russia is the second-largest oil producer in the world, right before Saudi Arabia, disruption in its oil flows will affect the global balance of supply and demand—and analysts know it. So do forecasters. However, they are downplaying such geopolitical risks in favor of the argument that the electrification of transport and weak economic growth in many key markets are undermining oil demand. Supply, meanwhile, is growing, according to the forecasters, and apparently this supply growth is completely disconnected from prices—which it obviously is not.
Related: Turkey Silent After Tripartite Deal That Could Get Kurdish Flowing This Week
The second reason why prices are not down all the way to $47 a barrel is China. Millions of words have been spent on media reports suggesting China‘s oil demand is close to peaking, and afterwards it will drop off a cliff. China, meanwhile, has been stocking up on crude, even with weakening demand growth, which is a fact, after over two decades of leaps and bounds. Indeed, Reuters’ Clyde Russell noted in a recent column that China’s crude oil imports have been on the rise since March this year, even if some of the crude goes into storage rather than refineries. Indeed, per Russell, “from March onwards China has been importing crude at a far higher rate than it needs to meet its domestic fuel requirements.”
This has, in turn, been keeping international oil prices stable and higher than many would like to see them, including President Donald Trump, who had cheap gas on his agenda when he took office. On the other hand, Trump strongly believes that hurting Russia’s oil export revenues would speed up the end of hostilities in Ukraine. That, however, would push prices higher, which may be why he has been in no rush to impose additional sanctions on Russia’s energy industry—unlike the EU, which just did, facing an even higher energy bill as it voluntarily gives up Russian oil.
There is also the aspect of perceived versus actual demand and consumption of oil. Oxford Energy addressed this aspect of the oil market in a recent report, dispelling rumors of an impending glut by citing storage numbers that show no sign of oversupply. Floating storage, for instance, is below the levels reached in 2022, when everyone rushed to prepare for the anti-Russian sanctions. OECD stocks, often used as a reference point for forecasts, are below the five-year average, meaning consumption is quite healthy. One final indicator of stronger-than-expected demand comes again from China, in the form of lower fuel exports, cited by Oxford Economics.
Yet this context remains largely ignored in favor of what basically amounts to a fixation on EV sales projections and GDP forecasts, plus references to OPEC+’s decision to unwind output curbs installed in 2022.
“Yes, there will be downward pressure on prices, I just don’t buy into the narrative that we’re going to see $40 oil,” Sen said. “As long as the Chinese bid is there and Opec+ spare capacity is constrained, the downside is going to be protected.” In addition to these, there is also the producer response to prices that are sub-optimal for most producers. It is inevitable and, indeed, U.S. producers are already responding by slackening the pace of production growth this year.
While forecasters forecast, oil prices remain stable, despite claims that oil market volatility has increased over the past couple of years amid a surge in the use of so-called shadow fleet tankers to transport Russian crude, creating what Reuters’ Ron Bousso called “blind spots” on the market that make it increasingly difficult for traders to glean the facts about supply-demand balance. They will remain stable for the observable future as well, as geopolitical factors continue to push them higher, while forecasts of a glut curb the upside, regardless of whether there are signs of such a glut about to materialize.
Such materialization is becoming less likely by the day, it seems. According to one of the glut-prediction forecasters, Maquarie, “The problem is, a bear market needs the element of surprise, and this has no surprise in it.”
By Irina Slav for Oilprice.com
More Top Reads From Oilprice.com
Spot Gold surpassed the $4,050 threshold on Wednesday, establishing yet another record high. The bright metal kept rallying on the back of global political woes. The United States (US) government shutdown entered its eighth day, without signs of ending anytime soon.
Investors are looking at October 15 as a critical deadline, as it would be payday for active-duty military service members. In prior shutdowns, Congress passed separate bills to keep it funded, and it could also be the case this time, should Republicans and Democrats fail to agree on a funding bill. Meanwhile, US President Donald Trump reiterated his threats of massive federal worker layoffs, blaming rival Democrats.
Meanwhile, market players gear up for the upcoming Federal Open Market Committee (FOMC) Minutes. The document should shed some light on policymakers’ considerations when they decided to cut the benchmark interest rate by 25 basis points (bps) at their meeting in September. Additionally, it could offer some clues on what’s next for monetary policy.
The XAU/USD pair keeps rallying in the American afternoon, currently trading at around $4,055. The extreme overbought conditions persist in the daily chart, but also the strong bullish momentum. Technical indicators accelerated their advances, with the Momentum indicator heading north almost vertically and the Relative Strength Index (RSI) indicator advancing beyond 87. At the same time, Gold is far above all bullish moving averages, with the closest one being the 20 Simple Moving Average (SMA) at around $3,785.
XAU/USD is also bullish in the near term. The 4-hour chart shows that technical indicators aim higher in overbought levels, while the bright metal also runs far above all its moving averages. The 20 SMA gains additional traction but stands roughly $100 below the current level, reflecting solid buying interest.
Support levels: 4,040.40 4,021.90 4,015.10
Resistance levels: 4,070.00 4,085.00 4,100.00
Platinum: Exuberant Response and Record Highs on Speculation
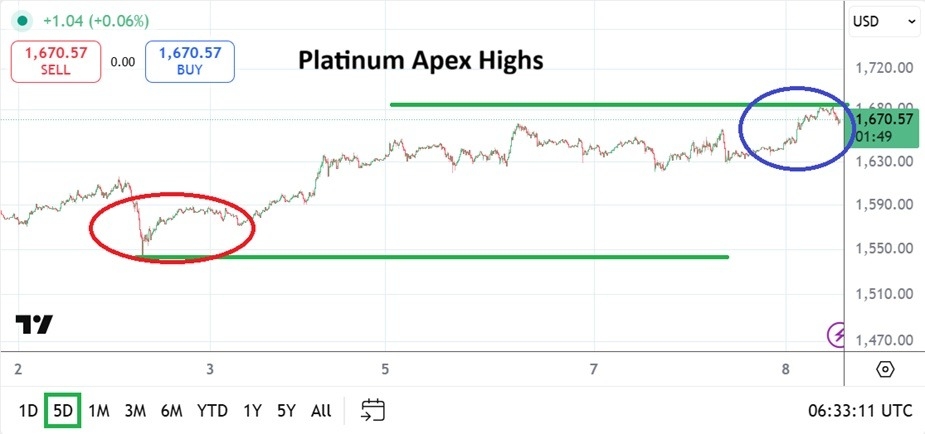
Platinum via its cash price at the time of this writing is near 1,670.00 USD, this after an early morning high took the precious metal within 1,685.00.
Platinum is trading within record prices today in response to the speculative fury being seen across the metals commodities sector. Platinum is near the 1,670.00 level as of this writing and touched an apex of 1,685.00 earlier this morning. Platinum is running fast and day traders tempted to keep pace better have serious risk management in use. The highs attained in the precious metal are noteworthy and are correlating to record values being seen in gold. Dangerous fast conditions prevail.
Platinum has always been a highly desirable metal for use in jewelry and industry. However, platinum is not viewed by long-term investors in the same manner that gold holds. While platinum is certainly an important commodity, gold is seen as a better safe haven asset. It would be difficult to call platinum a second tier metal compared to gold’s tier one status, but it might not be incorrect. However, platinum certainly has its followers and the metal is performing well.
On the 25th of September platinum began to sustain the 1,500.00 price level and build momentum upwards. At the end of July and beginning of August platinum was near the 1,300.00 ratio. At this time last year platinum was around 1,000.00 per ounce. Platinum’s ability to gain over 65% in the past year is quite an accomplishment. Fast market conditions have correlated to gold in many respects, but the dynamics are not exactly the same. The price of platinum as a reaction to the price of gold should be taken into consideration.
Fundamental traders of platinum may not like the comparison to the value of gold. However, via a speculative looking glass it is certain that momentum in platinum is feeding off of the frenzy being seen in gold. Day traders tempted to pursue platinum because it is ‘cheaper’ than gold need to understand that the speed of trading in the commodity, while perhaps not as expensive still has the capability of moving fast and being costly. This morning’s record high in platinum and the subsequent reversal are warning signs.
Just like all assets, platinum certainly has targeted values that large players and small traders are looking at numerically as psychologically important levels.
Platinum Short-Term Outlook:
Current Resistance: 1,677.00
Current Support: 1,661.00
High Target: 1,701.00
Low Target: 1,650.00
Meanwhile, the prolonged U.S. government shutdown, now stretching into its second week, continues to weigh on sentiment. The absence of official data releases has left markets without clear direction, compelling investors to rely on secondary indicators. The resulting data vacuum has amplified uncertainty, bolstering safe-haven flows into precious metals.
Silver has mirrored gold’s upward momentum, buoyed by similar macroeconomic tailwinds. Beyond its traditional role as a store of value, the metal benefits from robust industrial demand tied to the renewable energy and semiconductor sectors, which together account for roughly half of global silver consumption.
Analysts note that the combination of monetary easing expectations and resilient industrial activity continues to support its outlook.
“Silver is tracking gold’s trajectory, but it also has its own demand story from the clean energy transition,” said a commodities strategist at ING.
Global central banks remain active buyers in the bullion market. Recent data from the World Gold Council shows net purchases of 15 tonnes in August, led by Kazakhstan and Turkey, marking the sixteenth consecutive month of net accumulation.
The trend reflects efforts to diversify foreign reserves and hedge against currency volatility, particularly amid long-term concerns over debt sustainability and slowing global growth.
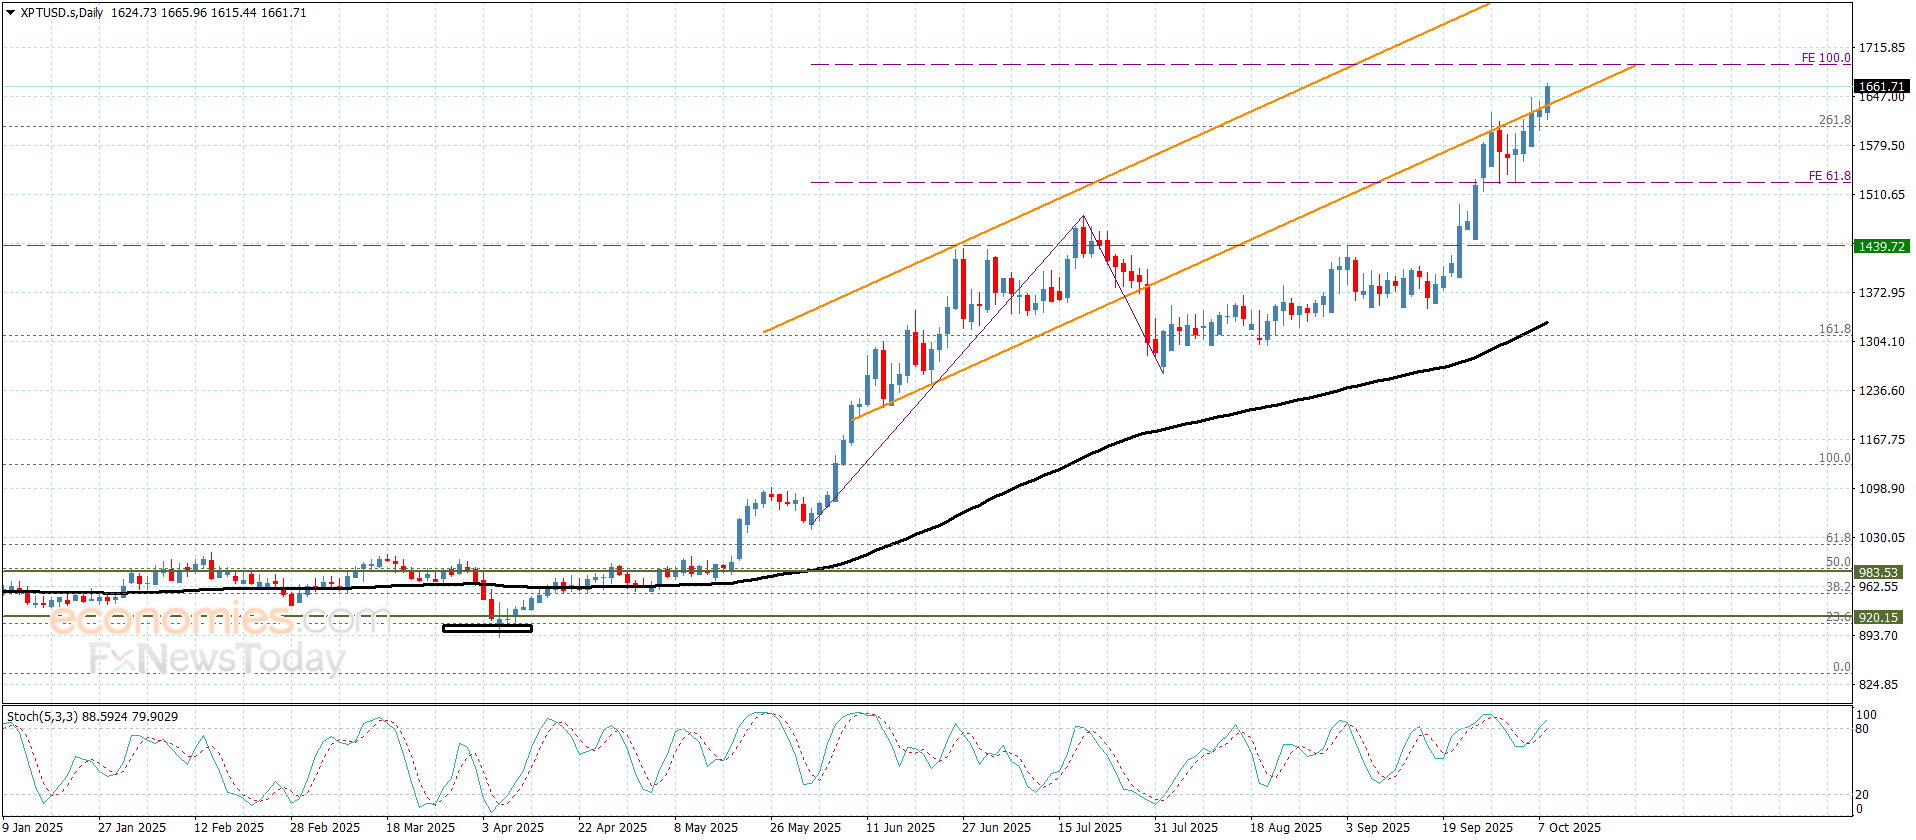
Platinum price succeeded in resuming the bullish attack by confirming surpassing the resistance to $1630.00, to notice its rally towards the initial extra target at $1660.00 to settle near it.
In general, the bullish trend scenario will remain valid by holding above $1525.00 support and the continuation of providing positive momentum by the main indicators, which will increase the chances of reaching 1690.004, surpassing this obstacle will confirm the move to a new positive phase, to target extra stations that begin at $1727.00.
The expected trading range for today is between $1600.00 and $1690.00
Trend forecast: Bullish
Copper price remains stable since yesterday below $5.0600 barrier, forming more of the intraday sideways trading, reminding you that there are positive factors, especially with its stability within the bullish channel’s levels, besides the continuation of providing positive momentum by the main indicators will increase the chances of achieving the required breach, to open the way for recording extra gains that might extend towards $5.2000 and $5.3200.
The risk of changing the positive trend of the current trading if it breaks the extra support near $4.7500, which might force it to suffer some losses by reaching $4.550 and $4.4100 before reaching the suggested positive targets.
The expected trading range for today is between $4.8800 and $5.2000
Trend forecast: Bullish
Silver (XAG/USD) regains positive traction following the previous day’s modest pullback and climbs to the $48.30 region during the Asian session on Wednesday. Moreover, the white metal remains within striking distance of its highest level since April 2011, touched earlier this week, and seems poised to appreciate further.
The recent move up witnessed over the past two weeks or so, along an ascending channel, points to a well-established uptrend and validates the positive outlook. However, the daily Relative Strength Index (RSI) is holding above the 70 mark, pointing to still overbought conditions and warranting some caution for the XAG/USD bulls. Hence, it will be prudent to wait for some near-term consolidation or a modest pullback before positioning for any further appreciating move.
Nevertheless, the XAG/USD seems poised to climb further beyond the $48.75 region, or the multi-year peak, and aim towards reclaiming the $49.00 mark. The momentum could extend further towards the April 2011 swing high, around the $49.80 zone, before bulls aim to conquer the $50.00 psychological mark for the first time.
On the flip side, any corrective slide now seems to find decent support near the $48.00 round figure. This is closely followed by the Asian session trough, around the $47.75-$47.70 region, and the overnight low, around the $47.35-$47.30 zone. A convincing break below the latter would confirm a breakdown below the aforementioned trend channel and prompt some technical selling. The XAG/USD might then weaken further towards the $47.00 mark en route to the $46.65-$46.60 support.
Silver is a precious metal highly traded among investors. It has been historically used as a store of value and a medium of exchange. Although less popular than Gold, traders may turn to Silver to diversify their investment portfolio, for its intrinsic value or as a potential hedge during high-inflation periods. Investors can buy physical Silver, in coins or in bars, or trade it through vehicles such as Exchange Traded Funds, which track its price on international markets.
Silver prices can move due to a wide range of factors. Geopolitical instability or fears of a deep recession can make Silver price escalate due to its safe-haven status, although to a lesser extent than Gold’s. As a yieldless asset, Silver tends to rise with lower interest rates. Its moves also depend on how the US Dollar (USD) behaves as the asset is priced in dollars (XAG/USD). A strong Dollar tends to keep the price of Silver at bay, whereas a weaker Dollar is likely to propel prices up. Other factors such as investment demand, mining supply – Silver is much more abundant than Gold – and recycling rates can also affect prices.
Silver is widely used in industry, particularly in sectors such as electronics or solar energy, as it has one of the highest electric conductivity of all metals – more than Copper and Gold. A surge in demand can increase prices, while a decline tends to lower them. Dynamics in the US, Chinese and Indian economies can also contribute to price swings: for the US and particularly China, their big industrial sectors use Silver in various processes; in India, consumers’ demand for the precious metal for jewellery also plays a key role in setting prices.
Silver prices tend to follow Gold’s moves. When Gold prices rise, Silver typically follows suit, as their status as safe-haven assets is similar. The Gold/Silver ratio, which shows the number of ounces of Silver needed to equal the value of one ounce of Gold, may help to determine the relative valuation between both metals. Some investors may consider a high ratio as an indicator that Silver is undervalued, or Gold is overvalued. On the contrary, a low ratio might suggest that Gold is undervalued relative to Silver.