The main tag of GoldPrice Articles.
You can use the search box below to find what you need.
[wd_asp id=1]
The main tag of GoldPrice Articles.
You can use the search box below to find what you need.
[wd_asp id=1]
Silver (XAG/USD) remains under pressure for a third day in a row on Friday, retreating further after US President Donald Trump announced he would hold off for two weeks before deciding whether the US should step into the escalating Iran–Israel standoff. This pause has eased some of the geopolitical risk premium that recently fueled safe-haven flows into precious metals, prompting traders to book profits and reassess positions as investors digest the shifting geopolitical landscape.
At the time of writing, Silver is trading around $36.00 during the American trading hours, recovering modestly after easing from an intraday low of $35.51. The metal found some support near its 100-period Moving Average (MA) on the 4-hour chart, which is acting as a key cushion for prices amid the current pullback.
From a technical perspective, Silver has begun to show signs of weakness in its recent uptrend, suggesting a potential deeper pullback as momentum wanes. After enjoying a steady climb within a neat rising channel since early June, the metal has now slipped below the channel’s lower boundary, signaling that buyers are losing grip, at least in the short run.
Currently, Silver is hovering just above its 100-period moving average around $35.65, which has reliably cushioned price dips in recent weeks. This dynamic support will be the first line of defense for bulls.
The Relative Strength Index (RSI) continues to drift lower after flashing a clear bearish divergence, reinforcing signs that bullish momentum is fading. At the same time, the Rate of Change (ROC) has slipped into negative territory, further confirming that Silver’s recent upward drive has lost steam and that the door is now open for a broader corrective phase.
Looking ahead, a sustained move back above the broken channel and a decisive break above $36.50 would be needed to revive bullish momentum and expose the next resistance around $37.00–$37.30. On the flip side, if Silver fails to defend the 100-period MA and slides below $35.50, the metal could come under increased pressure, with the next meaningful support seen at $35.00 and then $34.50. For now, the near-term bias remains cautiously tilted to the downside unless buyers regain control above $36.50 with conviction.
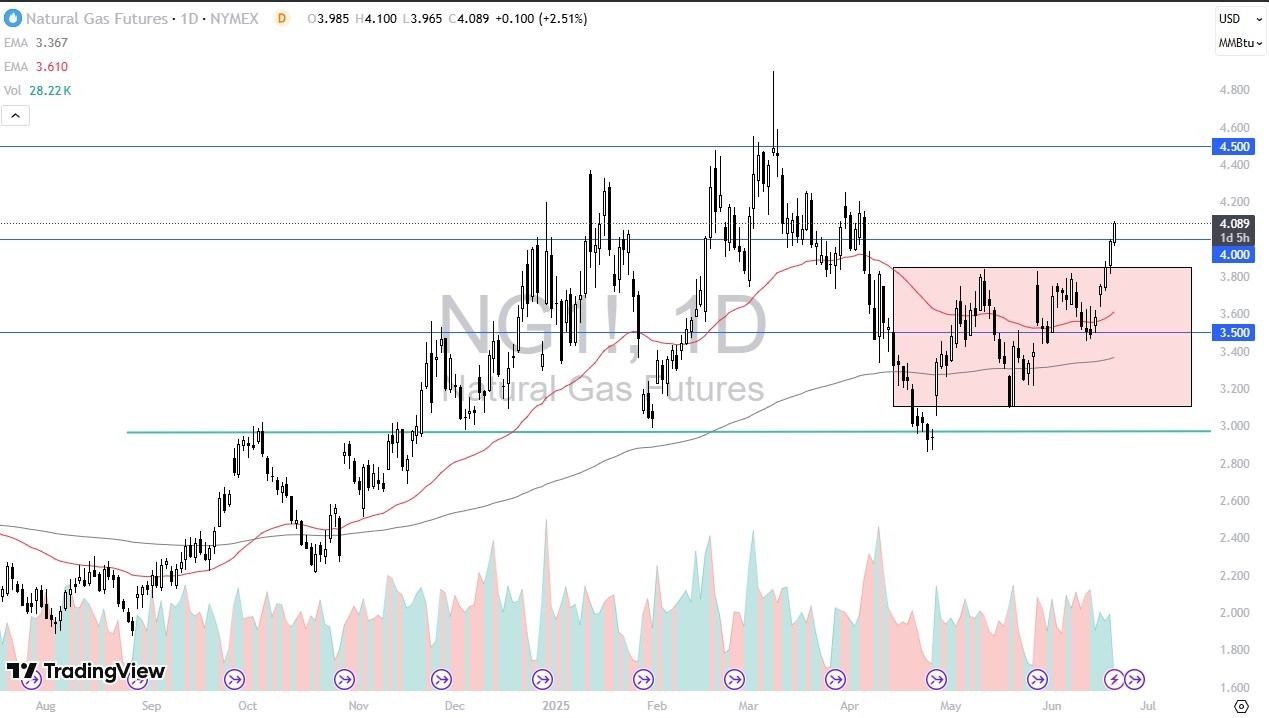
Natural gas price confirmed its move to the bullish track by providing new closes above $3.920 level, which forms the extension of an important support, to notice resuming the bullish attack and its stability near 4.100.
The stability of stochastic within the overbought level will provide extra momentum to ease the mission of hitting the target at $4.150, note that breaching this level will reinforce the chances for recording new gains that might extend to 4.220.
The expected trading range for today is between $4.050 and $4.220
Trend forecast: Bullish
Copper price didn’t succeed in recording any new gains recently below 61.8%Fibonacci correction level at$4.8100, contradicting the bullish scenario, to notice forming sideways trading by its fluctuation near 4.7500.
Note that the stability of $4.6600 as extra support besides the continuation of providing positive momentum by the main indicators, these factors make us keep preferring the bullish scenario until reaching the initial target at $4.8900 and surpassing it will ease the mission of reaching the next stations at 5.0300.
The expected trading range for today is between $4.7000 and 4.8900
Trend forecast: Bullish
Platinum price began forming some correctional trading after recording $1348.00 level, attempting to gather the gains by reaching $1275.00, which forms an extra support for the bullish scenario.
The price might be forced to form temporary sideways fluctuation until gathering the extra positive momentum, to ease the mission of reaching $1330.00, then wait to hit the next target near $1368.00, while the risk of changing the main trend will depend on the attempt of the price to decline below 1225.00 and providing repeated negative closes.
The expected trading range for today is between $1255.00 and $1330.00
Trend forecast: Bullish
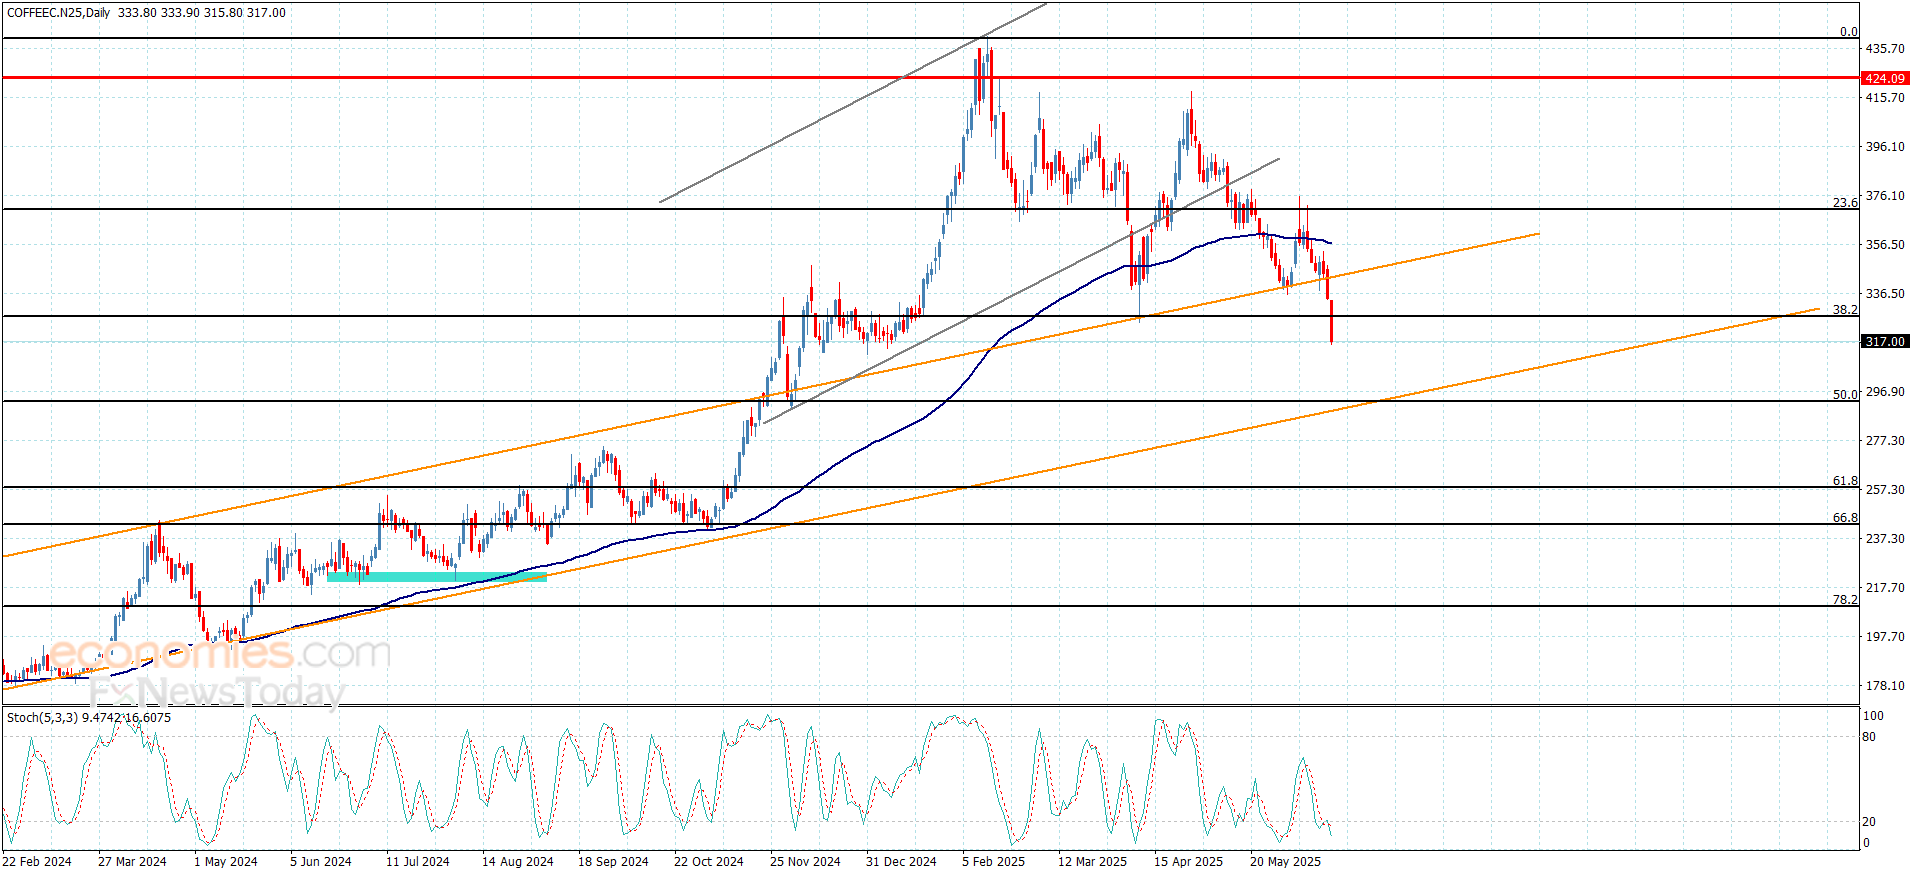
Coffee prices confirmed their surrender to the bearish bias domination yesterday below the extra support at 345.00, forming a sharp decline, and breaking 38.2%Fionacci correction level at 326.60 to settle near 317.00.
Stochastic attempts to reach the oversold levels will increase the chances for gathering the negative momentum, which makes us prefer more of the negative attempts that target 309.60 level, reaching the next support at 293.50.
The expected trading range for today is between 309.60 and 330.00
Trend forecast: Bearish
This “higher-for-longer” stance dampens demand for non-yielding assets, such as gold. “The Fed remains committed to keeping policy tight until inflation is sustainably at 2%,” the FOMC noted. This shift in tone pushed real yields higher and pressured precious metals across the board.
Silver (XAG/USD) mirrored gold’s weakness, dipping to an intraday low of $35.66 before stabilizing near $35.63. Despite the Fed-driven pressure, silver’s downside was limited by broader risk aversion and continued demand for safe-haven assets.
Technical structure remains supported by the 50-day EMA and higher-low formations, while buyers appear to be stepping in at key levels, anticipating a rebound should uncertainty deepen across global markets.
Despite monetary policy headwinds, gold and silver continue to benefit from global uncertainty. Geopolitical tensions in key regions and trade policy risks—especially the potential for new U.S. tariffs ahead of the July 9 deadline—are fueling cautious positioning across equities and commodities.
Investors remain sensitive to any escalation in global tensions or disruptions in trade flows, which could reignite demand for metals. “We’re in a holding pattern, but safe-haven appetite could return quickly if headlines worsen,” noted a Hong Kong-based metals trader.
The U.S. Dollar Index slipped modestly following the Fed’s policy announcement, offering minor support to gold and silver. A weaker greenback typically benefits dollar-denominated assets, especially when paired with a broad risk-off tone seen in global equities.
Natural gas is a major producer of electricity in this country. So again, this time of year typically isn’t this positive for natural gas, but external factors such as that and the concerns about natural gas production in Iran has led to a breakout. Now, I still favor longer term the downside. And I certainly don’t know if I want to chase natural gas in this environment. I suspect as soon as the forecast in the eastern part of the United States start to cool off, which could be a week or so away, this thing will turn right back around and start dropping.

So now I’m looking for signs of the market trying to get ahead of that. Unfortunately, natural gas is highly driven by weather forecast in basically about 15 states in the United States. That is a bulk of what moves price. This is a US contract, and a lot of my friends overseas don’t really pay too much attention to that at their own peril. So, you’ll have to stay advised of the temperatures in places like Boston or New York. But really at this point, I think you may have missed the move unless you’re a short term momentum trader. Now you’re looking for exhaustion to start shorting. It’s going to be a difficult market. Natural gas always is. It’s probably one of the hardest markets to trade in because it’s so highly specialized and it can get very thin. So, keep that in mind. But I also like the idea of if you’re patient enough, you can get pretty heavily rewarded when we come back to a more normal temperature.
Ready to trade daily Forex forecast? Here’s a list of some of the best commodities brokers to check out.
Christopher Lewis has been trading Forex and has over 20 years experience in financial markets. Chris has been a regular contributor to Daily Forex since the early days of the site. He writes about Forex for several online publications, including FX Empire, Investing.com, and his own site, aptly named The Trader Guy. Chris favours technical analysis methods to identify his trades and likes to trade equity indices and commodities as well as Forex. He favours a longer-term trading style, and his trades often last for days or weeks.
Gold price is back in the red early Friday, following a mixed close amid holiday-thinned trading on Thursday.
Traders continue to keep a close on the Middle East geopolitical developments and US Federal Reserve (Fed) commentaries for fresh trading incentives.
In the absence of top-tier economic data releases from the United States (US) on Friday, Gold price will likely remain at the mercy of the US Dollar (USD) dynamics, fuelled by the broader market sentiment, in the face of the ongoing geopolitical upheaval in the Middle East.
There has been no bad news on the Iran-Israel conflict front so far this Friday, rendering positive for markets and reviving risk flows.
US President Donald Trump reportedly said that he will give Iran a last chance to make a deal to end its nuclear program. Trump noted on Thursday that he would delay his final decision on launching strikes for up to two weeks.
Reports of the US easing its aggression on Iran are lifting higher-yielding assets at the expense of safe havens such as Gold price and the USD.
However, the end-of-the-week flows and the markets’ repositioning in the aftermath of the Fed’s policy announcements could influence the Gold price action as US traders return after the Juneteenth holiday break. Geopolitics will continue to lead the sentiment, primarily.
Technically, Gold buyers remain hopeful so long as the 14-day Relative Strength Index (RSI) holds above the midline. The leading indicator is currently pointing south, near 52.
Gold price must defend the critical short-term support of the 21-day Simple Moving Average (SMA) at $3,350 on a daily or weekly closing basis to reinforce buying interest.
If that fails, the 50-day SMA at $3,318 will be put to test. The next downside cap is aligned at $3,297, the 38.2% Fibonacci Retracement (Fibo) level of the April record rally,
Alternatively, Gold price recovery will need a clear break of $3,377, the 23.6% Fibo level of the same ascent to revisit the $3,400 supply zone.
Further upside will challenge the static resistance at $3,440 will be tested.
Buyers will then take on the two-month highs of $3,453.
In the world of financial jargon the two widely used terms “risk-on” and “risk off” refer to the level of risk that investors are willing to stomach during the period referenced. In a “risk-on” market, investors are optimistic about the future and more willing to buy risky assets. In a “risk-off” market investors start to ‘play it safe’ because they are worried about the future, and therefore buy less risky assets that are more certain of bringing a return, even if it is relatively modest.
Typically, during periods of “risk-on”, stock markets will rise, most commodities – except Gold – will also gain in value, since they benefit from a positive growth outlook. The currencies of nations that are heavy commodity exporters strengthen because of increased demand, and Cryptocurrencies rise. In a “risk-off” market, Bonds go up – especially major government Bonds – Gold shines, and safe-haven currencies such as the Japanese Yen, Swiss Franc and US Dollar all benefit.
The Australian Dollar (AUD), the Canadian Dollar (CAD), the New Zealand Dollar (NZD) and minor FX like the Ruble (RUB) and the South African Rand (ZAR), all tend to rise in markets that are “risk-on”. This is because the economies of these currencies are heavily reliant on commodity exports for growth, and commodities tend to rise in price during risk-on periods. This is because investors foresee greater demand for raw materials in the future due to heightened economic activity.
The major currencies that tend to rise during periods of “risk-off” are the US Dollar (USD), the Japanese Yen (JPY) and the Swiss Franc (CHF). The US Dollar, because it is the world’s reserve currency, and because in times of crisis investors buy US government debt, which is seen as safe because the largest economy in the world is unlikely to default. The Yen, from increased demand for Japanese government bonds, because a high proportion are held by domestic investors who are unlikely to dump them – even in a crisis. The Swiss Franc, because strict Swiss banking laws offer investors enhanced capital protection.
A one-day bullish breakout above today’s high of $3,388 will indicate that support was retained at the 20-Day line. The short-term uptrend of higher swing highs and higher swing lows, beginning from the May swing low, would be expected to continue at that point. Key resistance would then be at the recent high of $3,451, with a decisive breakout above that level signaling a continuation of the short-term uptrend and a bullish reversal, above $3,449, of the recent bearish correction.
There is a concern that bullish momentum following a recent trendline breakout has been weak. This is evidenced by the failure to hold above the $3,439 lower swing high. Today’s low of $3,347 is near-term support and if it is broken a break of the 20-Day line will have also occurred. Lower price levels for possible support are the 50-Day MA, now at $3,314, and prior support at the prior interim swing low of $3,293. The 50-Day line is a key dynamic trend indicator.
Gold bounced off support around the 50-Day line on each of the two previous bearish retracements. It should do so again if the intermediate bull trend, starting from the November swing lows, is to be retained. Nonetheless, if drop below the line occurs, support might be seen around the intersection of several trendlines at $3,271, or an interim swing low at $3,2,45.
For a look at all of today’s economic events, check out our economic calendar.
Despite bullish indications, an initial target and therefore potential resistance, marked by a rising ABCD pattern (purple), was hit at $4.08. Just something to be aware of, as a potential resistance zone begins from there and up to $4.17. The higher price point is the completion of a smaller ascending ABCD pattern (orange). In between the two price levels there is the 61.8% Fibonacci retracement at $4.12. Once there is symmetry in gains between two consecutive upswings, there is the possibility of resistance.
Of course, a rally above today’s high will provide a bullish continuation signal, with the two initial targets being $4.12 and $4.17. A decisive continuation signal above $4.17, however, would show very strong bullish momentum and therefore increase the possibility of reaching an initial higher target zone relatively rapidly.
It is interesting to note that the first measured move from the April swing low (AB, purple) was $0.98 (blue vertical). Given signs of aggressive buying seen this week, the current advance has the potential to match the first rally in the current short-term uptrend. Symmetry in price would be established at that point, and that makes it as a potential target. However, the similarity in the initial speed of this upswing relative to AB, is the clue that the market is providing.
There is also the potential for symmetry in time to occur between the two swings. The initial AB advance completed in 12 days with only two instances of a one-day pullback. Notice that the current advance reaches 12 days on June 30. Whether the upside target is reached or not, a continuation of an aggressive rally is indicated and the results following the first one-day lower daily low will provide the next clue. An immediate recovery would validate the potential for a matching measured move.
For a look at all of today’s economic events, check out our economic calendar.