The main tag of GoldPrice Articles.
You can use the search box below to find what you need.
[wd_asp id=1]
The main tag of GoldPrice Articles.
You can use the search box below to find what you need.
[wd_asp id=1]
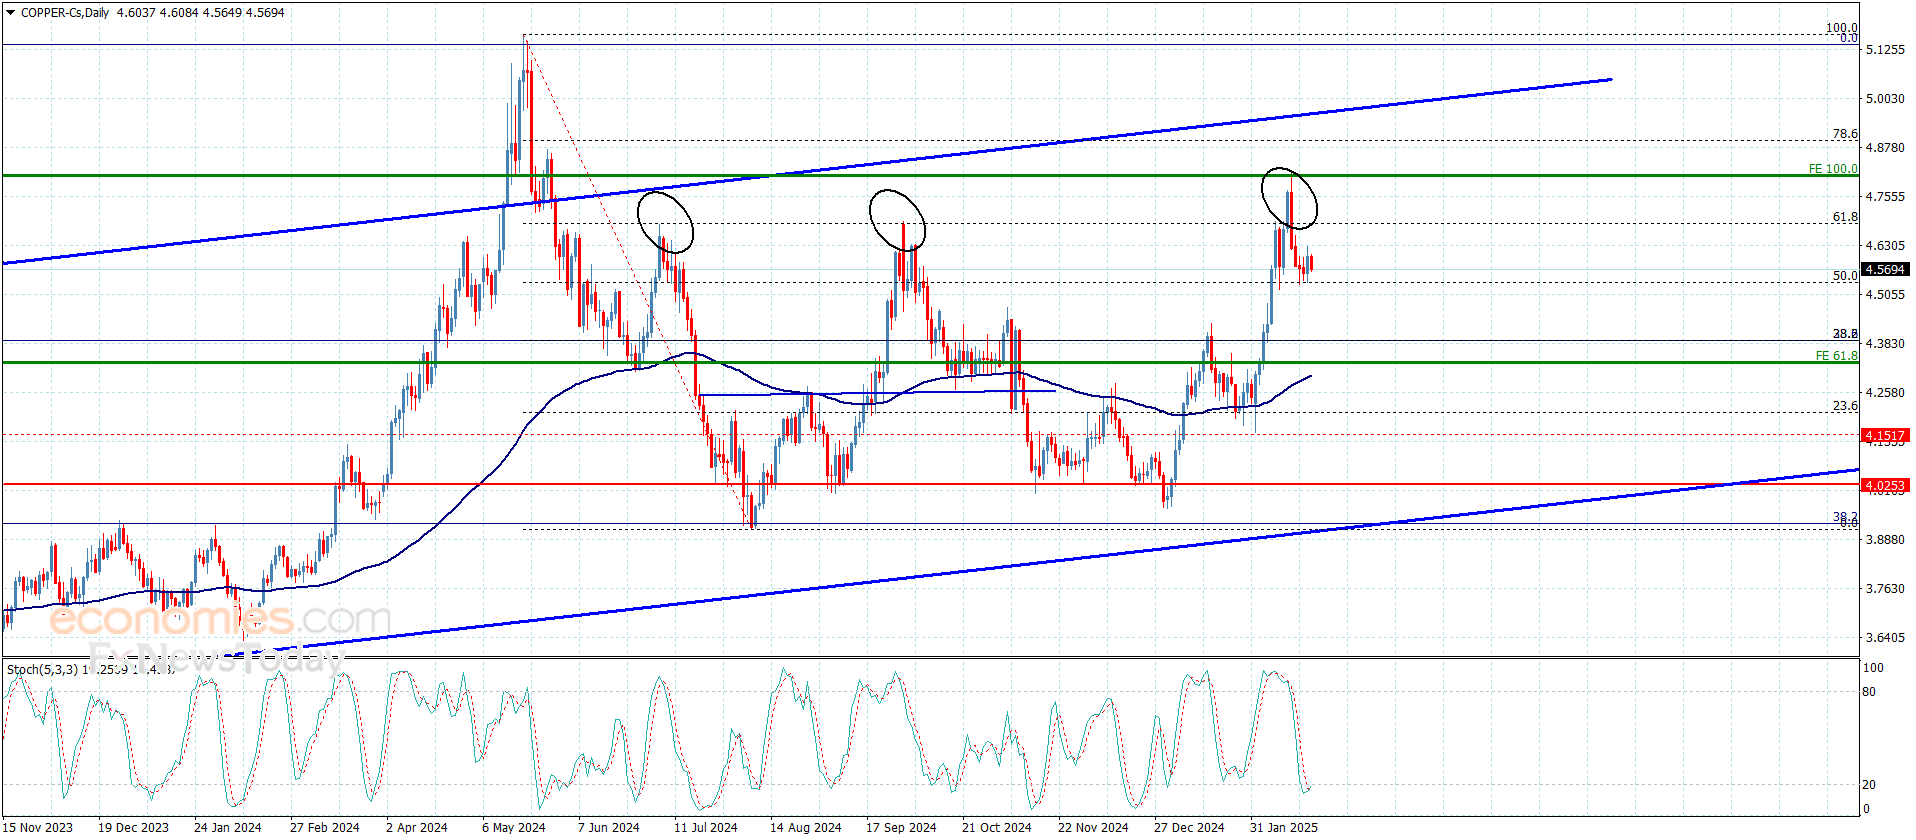
Copper price attempted to face the negative pressures by fluctuating above the initial support 4.5300$, while the continuous contradiction between the major indicators pushes the price to provide new sideways trades to keep its stability below 4.6800$ barrier.
We expect to continue providing sideways trades, noting that stochastic continuous negative momentum might assist to decline below the current support and suffer additional losses by reaching 4.4600$.
The expected trading range for today is between 4.4600$ and 4.6200$
Trend forecast: Bearish
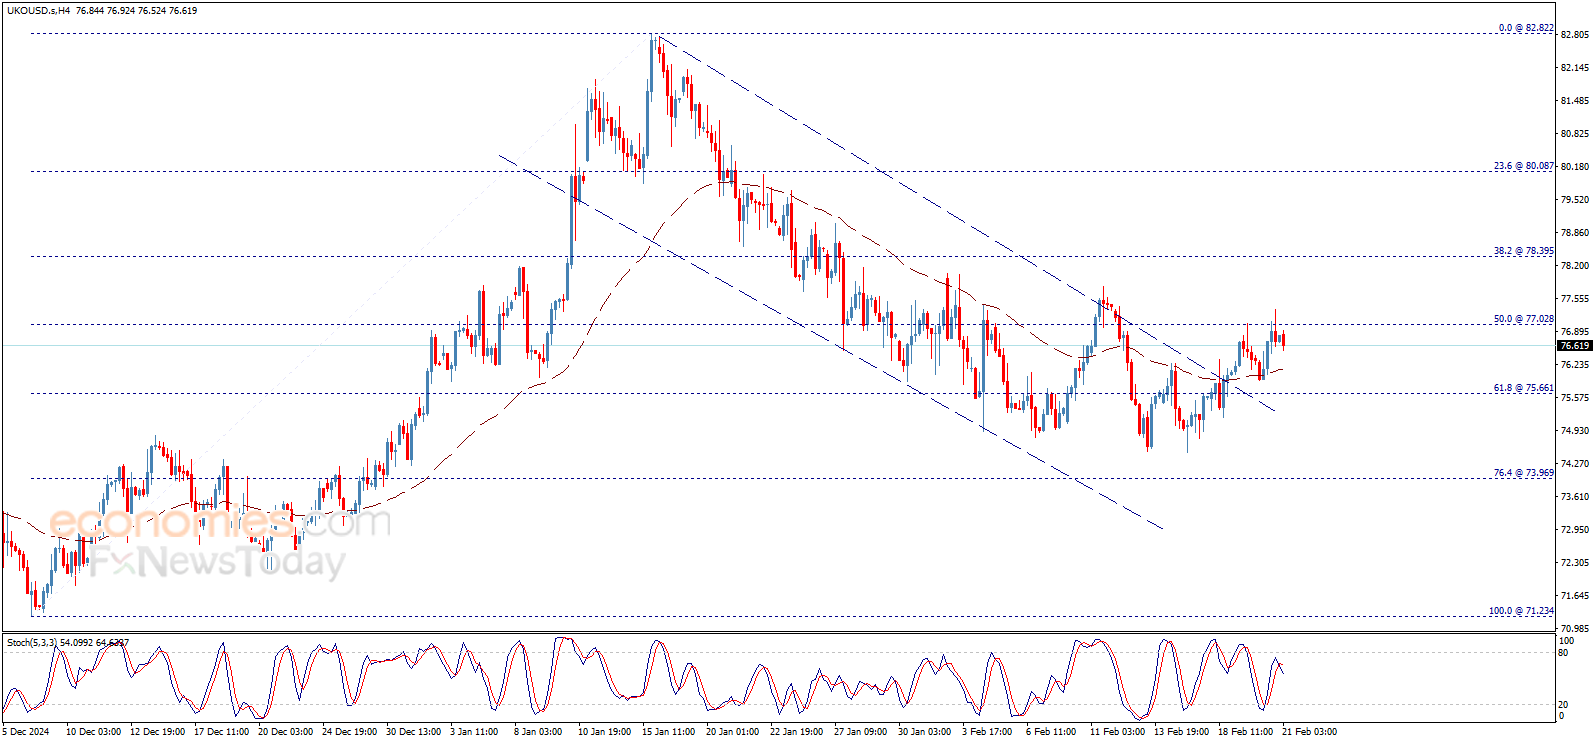
Crude oil price continued to rise yesterday to reach 72.65$ areas, noting that holding above 72.30$ supports the chances of continuing the rise in the upcoming sessions, by when we take a deeper look at the chart, we find that the recent trades are confined within rising wedge pattern that its support line meets 72.30$, which means that breaking this level will push the price to return to the bearish track again.
For more: please follow us on Telegram channel.
Gold price is on a corrective move lower from near record highs of $2,955 set on Thursday. Despite the pullback, Gold price remains on track to book the eighth consecutive weekly gain.
The latest leg down in Gold price could be attributed to profit-taking as traders reposition ahead of the first critical economic data release from the United States (US) this week – the S&P Global Preliminary business PMIs.
The data could help markets refocus on the US Federal Reserve’s (Fed) outlook on interest rate cuts after the Minutes of the January policy meeting failed to alter their expectations of two rate reductions this year.
The Minutes backed the Fed cautious stance on Wednesday as it showed that “many participants noted that the committee could hold the policy rate at a restrictive level if the economy remained strong and inflation remained elevated” in the face of Trump’s trade policies.
Persistent expectations that the Fed will likely deliver two rate cuts in 2025 continue to underpin the sentiment around the non-yielding Gold price.
That said, any adverse reaction to the strong PMI data on Gold price could be short-lived if fresh developments surrounding US President Donald Trump’s tariff plans hit the wires and strengthen the safe-haven demand for the traditional store of value – Gold.
The recent tariff talks by Trump and geopolitical tensions around Russia-Ukraine peace deal have supported the record rally in Gold price.
However, the bright metal could extend its correction from lifetime highs if traders cash in on their longs ahead of next week’s US Personal Consumption Expenditures (PCE) inflation data release.
All in all, any dip in Gold price will likely be seen as a good buying opportunity in the near term.
Gold price turns lower after failing to find acceptance above the $2,950 psychological mark on a daily candlestick closing basis.
But the 14-day Relative Strength Index (RSI) returns to the bullish zone, currently near 69.75, suggesting a ‘buy-the-dips’ trade in the Gold price.
A sustained break above the $2,950 barrier could resume the record rally. The next relevant resistances are seen at $2,970 and the $3,000 key figure.
Conversely, a fresh pullback could call for a test of the $2,900 round level, below which the February 14 low of $2,877 will be threatened.
A firm break of that level will initiate a fresh downside toward the $2,850 psychological barrier.
The S&P Global Manufacturing Purchasing Managers Index (PMI), released on a monthly basis, is a leading indicator gauging business activity in the US manufacturing sector. The data is derived from surveys of senior executives at private-sector companies from the manufacturing sector. Survey responses reflect the change, if any, in the current month compared to the previous month and can anticipate changing trends in official data series such as Gross Domestic Product (GDP), industrial production, employment and inflation. A reading above 50 indicates that the manufacturing economy is generally expanding, a bullish sign for the US Dollar (USD). Meanwhile, a reading below 50 signals that activity in the manufacturing sector is generally declining, which is seen as bearish for USD.
Next release: Fri Feb 21, 2025 14:45 (Prel)
Frequency: Monthly
Consensus: 51.5
Previous: 51.2
Source: S&P Global
Gold price returns to provide positive trades after the decline that it witnessed in the previous sessions, and according to the trading rules inside the channel, the price is on its way to build new bullish wave on the intraday basis, supported by the EMA50 that carries the price from below, besides the positive signal provided by stochastic now.
For more: please follow us on Telegram channel.
Today’s high has the potential to retain the downtrend price structure with a lower swing high. A drop below today’s low of $72.09 will establish a new lower swing high and retain the integrity of the downtrend that began from the $80.76 swing high. The downtrend remains in place unless there is a sustained rally above the February 11 interim swing high at $72.64.
However, if today’s high establishes a new lower swing high and it is subsequently broken to the upside, that could provide an early signal for a bullish change in trend. Nonetheless, a rally above today’s high prior to establishing a new lower swing high puts crude oil in a position to challenge the $72.64 swing high. Subsequently, if a $72.64 bull breakout triggers, the 200-Day MA at $74.49 becomes the next higher price target.
Alternatively, the bearish correction continues to lower price targets, starting with the 78.6% retracement at $70.03. There is also a range of prior consolidation that represents potential support below the current retracement low at $70.52. Reaching the 78.6% retracement level could signal the completion of the decline. Notice that crude oil has been trading near trend lows recently and it has been showing signs of consolidation. In other words, bearish momentum has diminished.
That could be the end of it but if not the $68.82 interim swing low marks a lower price target. A drop below Wednesday’s low of $72.07 shows weakness that could lead to lower prices if the breakdown is sustained. It may be easier to recognize on the weekly chart (not shown).
For a look at all of today’s economic events, check out our economic calendar.
Today’s bearish pullback following the $4.48 high has almost completed a 50% retracement of an internal upswing. The 50% level is at $4.02 and the low for the day so far was $4.03. Nonetheless, that is a price level measuring a shorter internal upswing while the first retracement level from the full advance is at $3.91. That price level is the convergence of both the 38.2% Fibonacci retracement of the full advance and the 61.8% retracement of the internal upswing. Therefore, baring a breakout to new highs before a pullback, that price level is the first lower target.
Subsequently, the next lower confluence potential support zone is identified from $3.75 to $3.73. It consists of a 78.6% retracement level and a 50% retracement level, respectively. Nonetheless, both the 20-Day MA and 50-Day MAs were recently reclaimed during the recent rise. There has not yet been a test of support around those moving averages other than on one-day.
Therefore, if a deeper pullback occurs, they would be obvious potential targets. Keep in mind that the price levels represented are dynamic. Currently, the 50-Day line is at $3.62 and the 20-Day is at $2.57. Moreover, there is also a minor swing low (begins the internal upswing Fibonacci measurement) and 61.8% Fibonacci retracement at $3.56 and $3.55, respectively.
Since the top channel line was successfully tested as resistance today, it may also mark a point of potential resistance in the future. Nonetheless, a decisive breakout above today’s high has natural gas heading towards, $4.56, $4.70/$4.72, followed by a 38.2% Fibonacci retracement for the full downtrend that began from the 2022 high at $10.03.
For a look at all of today’s economic events, check out our economic calendar.
Spot Gold traded as high as $2,955.18 a troy ounce on Thursday, a fresh all-time high. The bright metal kept rallying despite a dismal market mood as market players weighed in on the potential negative effects of United States (US) tariffs on the global economy.
XAU/USD retreated early in the American session as the dismal mood temporarily boosted demand for the US Dollar (USD), yet persistent fears and a free-fall in Wall Street limited the slide. The pair currently trades around $2,940, retaining its overall positive tone.
Fears rotate around US President Donald Trump’s plans for massive tariffs. Trump announced plans to impose tariffs on automobiles, semiconductors and pharmaceuticals shipped to the US as early as April 2. He also noted that tariffs could go higher throughout the year.
Concerns intensified after the Federal Open Market Committee (FOMC) released the Minutes of the January meeting, which showed officials are worried about the potential effects of tariffs on the economy.
The focus shifts now to the Hamburg Commercial Bank (HCOB) and S&P Global preliminary estimates of the February Purchasing Managers’ Indexes (PMIs) for most major economies. The PMI reports are a measure of local economic health. The US will also release the final estimate of the January Michigan Consumer Sentiment Index, while a couple of Federal Reserve (Fed) speakers will hit the wires.
Technically, the daily chart for the XAU/USD pair shows it keeps posting higher highs and higher lows, which is in line with the dominant bullish trend. Technical indicators, in the meantime, remain within overbought levels, lacking clear directional strength yet heading north, suggesting buying pressure is still strong. Finally, the same chart shows Gold develops above all its moving averages, with the 20 Simple Moving Average (SMA) heading firmly north, roughly $100 below the current level.
In the near term, and according to the 4-hour chart, XAU/USD is poised to extend its advance. The pair met intraday buyers at around a bullish 20 SMA, while the 100 and 200 SMAs head firmly north far below the shorter one. Technical indicators, in the meantime, resumed their advances after correcting overbought conditions, supporting higher highs ahead.
Support levels: 2,924.10 2,913.05 2,909.60
Resistance levels: 2,960.00 2,975.00 2,990.00
Gold price faced temporary negative pressure yesterday to approach the minor bullish channel’s support line that appears on the chart, noticing that the price begins today with bullish bias to head towards resuming the expected bullish trend on the intraday and short-term basis, and we suggest recording new historical highs in the upcoming sessions.
For more: please follow us on Telegram channel.
With the continued upward momentum in the financial markets, the question arises whether the Dow Jones Industrial Average could reach 50,000 points in the near future.
Despite the index setting new record highs in 2024, sustaining this rally requires a set of economic and political factors that bolster market optimism.
Despite the index’s strong performance last year, factors such as tightening monetary policy, escalating geopolitical tensions, and declining earnings of major companies could trigger a sharp correction, pushing the index to test the 40,000 point level again.
With Donald Trump’s return to the White House in 2025, his trade policies have begun reshaping the economic landscape; he has imposed new tariffs on Chinese and European imports, creating trade tensions that negatively affected multinational companies listed in the index.
Although some sectors such as energy and defense benefit, additional tariffs have increased inflationary pressures, and the Federal Reserve has maintained a tight monetary policy, which has driven up borrowing costs.
The Federal Reserve faces a delicate balancing act amid inflationary pressures and economic uncertainty; any rate cuts could channel liquidity into the stock market and support the index, while tightening monetary policy might trigger a sharp correction and force a retest of 40,000 points.
The Dow Jones Industrial Average is one of the most important stock market indices on the New York Stock Exchange, tracking the performance of 30 of Wall Street’s largest industrial companies. Established in 1896, it serves as a gauge of the health of the American economy.
Factors influencing the Dow include macroeconomic conditions, monetary and fiscal policies, geopolitical situations, the performance of major companies, investor sentiment, innovation and technology, and unforeseen events such as natural disasters and global crises.
The index is trading near its all-time high (around 45,000 points), which entails high risk, although lower interest rates may mitigate that risk.
There are several ways to invest in the Dow, including:
It is unlikely to crash this year, especially given that it comprises high-quality stocks closely tied to the performance of the American economy.
The Dow Jones Industrial Average embarks on a long-term bullish journey, as illustrated by the chart below, having recorded an all-time high reaching approximately 45,150 points. It then encountered strong resistance there, which forced a modest downward correction, and is now attempting to resume its upward movement near that peak.
The 50-day moving average provides underlying support for the industrial index, enhancing the prospects for the continuation of the bullish trend. However, there is an alternate view in which the index’s recent inability to break above that peak might indicate a negative technical setup, potentially forcing a short- to medium-term correction, as shown in the daily chart scenario.
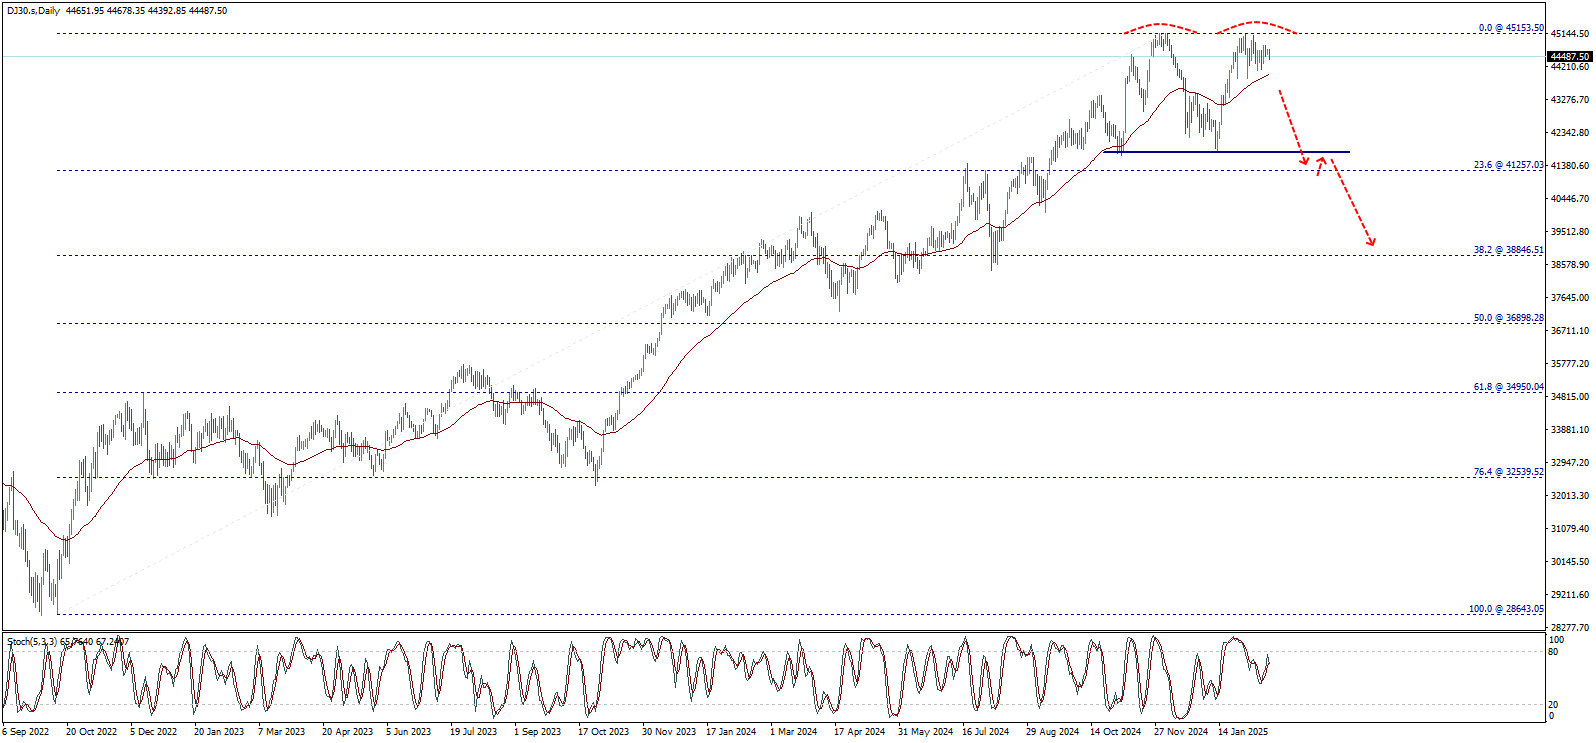
Should the index fail to surpass the 45,150-point level, it may initiate a downward wave targeting the 23.6% Fibonacci retracement level calculated from 28,643.05 up to the aforementioned peak. A closer examination of the daily chart reveals that reaching this level could lead the index to form a double-top pattern, which would trigger further short-term correction with the next target around 38,846.50 as a subsequent downside milestone.
The pivotal points to watch are support at 44,000 and resistance at 45,150; a break below this support would confirm the start of a bearish correction and the potential completion of the negative pattern, whereas a break above resistance would allow the index to resume its main upward trend.
Furthermore, on the intraday timeframes, the index is confined within a symmetrical triangle pattern since the end of last month. A break above the triangle’s resistance at 44,740 would serve as the first positive catalyst for a return to the primary bullish trend and nullify any negative potential affecting the index.
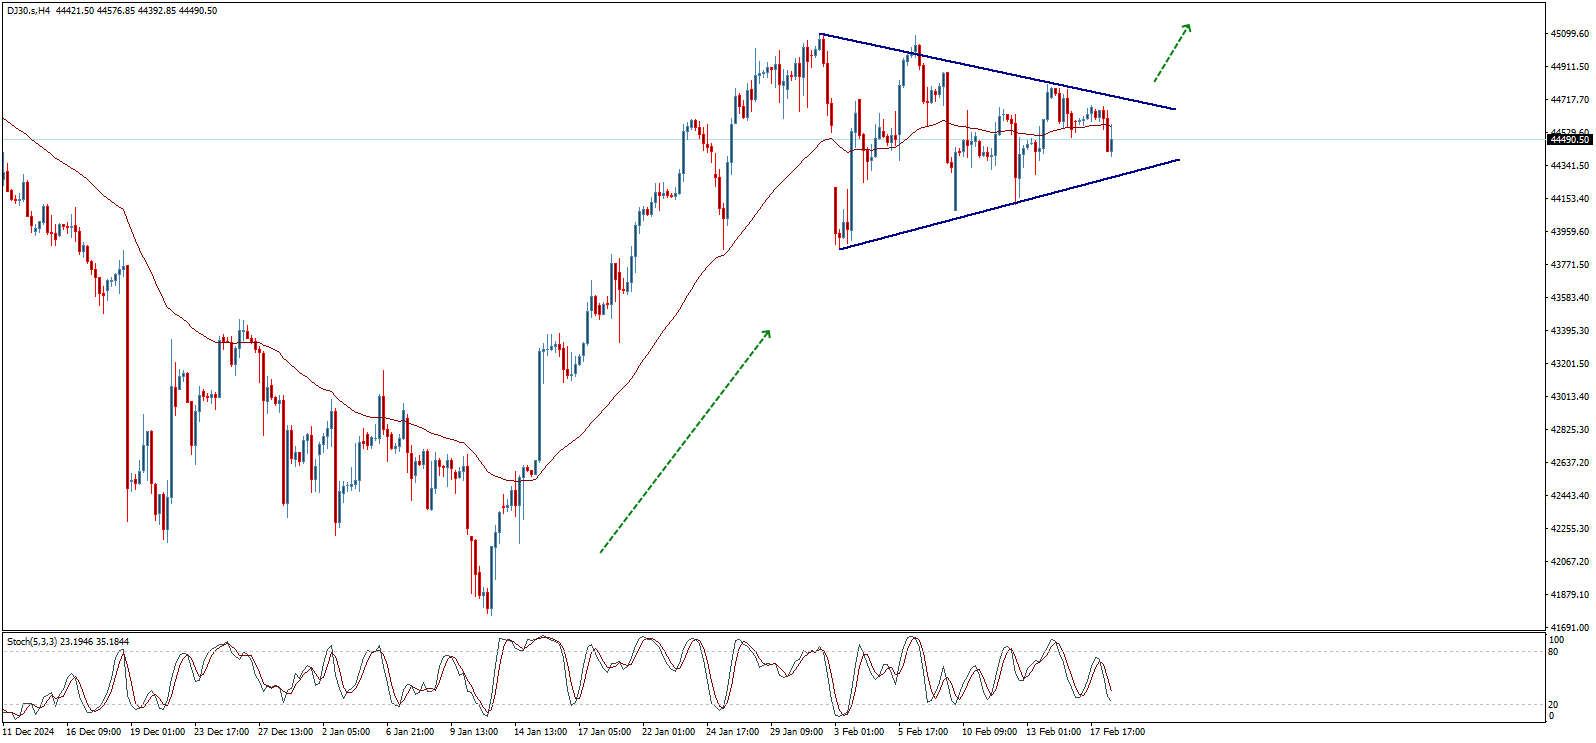
Overall, the long-term upward trend remains in place and active, and the index needs to break through levels of 44,740 and then 45,150 to pave the way for new historic highs that could reach 46,000 and then 46,500 points in the coming period. Conversely, a break below 44,000 will put the index under downward pressure and shift the short-term and intraday trend toward a decline, potentially testing support levels around 41,260 initially; breaking this support would confirm an extended bearish correction targeting 38,846.50 as the next downside objective.
Finally, the key technical analysis indicates that the long-term bullish trend is likely to continue if the index can overcome these obstacles. Securing levels above 44,740 followed by 45,150 will open the door to achieving new historic levels, while a break below 44,000 would signal a shift to a bearish path.
On the other hand, if the index fails to confirm a breach of 78.90 (note: this figure appears to be an error in the original text and is likely unrelated to the Dow) and instead experiences a downward rebound breaking the 74.60 level (another unrelated figure), it will force a transition into a downtrend with additional losses potentially reaching levels around 23,375 before any new attempt to rise. (These figures seem to be mixed with other asset analyses and might require further clarification.)
Silver price (XAG/USD) surges almost 1.5% to near $33.20 in European trading hours on Thursday. The white metal strengthens as investors remain concerned over deepening global trade tensions. United States (US) President Donald Trump announced on Wednesday that he is planning to impose tariffs on lumber, cars, semiconductors, and pharmaceuticals over the next month or sooner.
Market participants expect President Trump’s tariffs would lead to a global trade war, which would result in an economic slowdown across the globe.
Meanwhile, Donald Trump has also ordered his team to prepare reciprocal tariffs, which are expected to be unveiled in April.
On the geopolitical front, Ukraine President Volodymyr Zelenskyy feeling left out of Russia-US peace talks to end the war in Ukraine has raised some uncertainty. Ukrainian leader has condemned US Trump for initiating peace talks with Russia without his involvement in discussing the issue in Saudi Arabia.
Signs of a slowdown in the Russia-Ukraine peace talks would boost demand for safe-haven assets, such as Silver.
Meanwhile, the safe-haven demand of the US Dollar has remained weak even though traders becoming increasingly confident that the Federal Reserve (Fed) will keep interest rates in the current range of 4.25%-4.50% for longer. The US Dollar Index (DXY), which tracks the Greenback’s value against six major currencies, declines to near 106.90.
Silver price is inch far from revisiting an over three-month high of $33.40, which it posted on February 14. The outlook of the white metal is bullish as the 50-day Exponential Moving Average (EMA) has been sloping higher, which trades around $31.28.
The 14-day Relative Strength Index (RSI) oscillates in the 60.00-80.00 range, suggesting that the momentum is strongly bullish.
Looking down, the upward-sloping trendline from the August 8 low of $26.45 will act as key support for the Silver price around $30.00. While, the October 22 high of $34.87 will be the key barrier.
Silver is a precious metal highly traded among investors. It has been historically used as a store of value and a medium of exchange. Although less popular than Gold, traders may turn to Silver to diversify their investment portfolio, for its intrinsic value or as a potential hedge during high-inflation periods. Investors can buy physical Silver, in coins or in bars, or trade it through vehicles such as Exchange Traded Funds, which track its price on international markets.
Silver prices can move due to a wide range of factors. Geopolitical instability or fears of a deep recession can make Silver price escalate due to its safe-haven status, although to a lesser extent than Gold’s. As a yieldless asset, Silver tends to rise with lower interest rates. Its moves also depend on how the US Dollar (USD) behaves as the asset is priced in dollars (XAG/USD). A strong Dollar tends to keep the price of Silver at bay, whereas a weaker Dollar is likely to propel prices up. Other factors such as investment demand, mining supply – Silver is much more abundant than Gold – and recycling rates can also affect prices.
Silver is widely used in industry, particularly in sectors such as electronics or solar energy, as it has one of the highest electric conductivity of all metals – more than Copper and Gold. A surge in demand can increase prices, while a decline tends to lower them. Dynamics in the US, Chinese and Indian economies can also contribute to price swings: for the US and particularly China, their big industrial sectors use Silver in various processes; in India, consumers’ demand for the precious metal for jewellery also plays a key role in setting prices.
Silver prices tend to follow Gold’s moves. When Gold prices rise, Silver typically follows suit, as their status as safe-haven assets is similar. The Gold/Silver ratio, which shows the number of ounces of Silver needed to equal the value of one ounce of Gold, may help to determine the relative valuation between both metals. Some investors may consider a high ratio as an indicator that Silver is undervalued, or Gold is overvalued. On the contrary, a low ratio might suggest that Gold is undervalued relative to Silver.