The main tag of GoldPrice Articles.
You can use the search box below to find what you need.
[wd_asp id=1]
The main tag of GoldPrice Articles.
You can use the search box below to find what you need.
[wd_asp id=1]
Pepper price forecast tomorrow
Forecast of domestic pepper prices tomorrow January 4, 2025 increased; current pepper purchase price in localities is on average 148.200 VND/kg.
Today’s pepper price was updated on the afternoon of January 4, 2025 as follows, domestic pepper price increased sharply, the increase was from 1.000 – 2.500 VND/kg, especially in the pepper market of the province. Binh Phuoc unchanged
Specifically, pepper price today in the province Dak Nong After many stable sessions, pepper has turned to increase, increasing by 2.500 VND/kg, currently being purchased at 149.500 VND/kg; similarly, pepper price in Ba Ria – Vung Tau increased by 2.000 VND/kg compared to the previous trading session, currently being purchased at 149.000 VND/kg; pepper price in Gia Lai at 147.500 VND/kg (up 1.000 VND/kg); pepper price in the province Dak Lak is 148.000 VND/kg (up 1.000 VND/kg). Pepper price in Binh Phuoc province remains stable, currently being purchased at 147.000 VND/kg.
| Domestic pepper price updated on January 3, 2025 |
Experts say that the Vietnamese pepper industry is currently facing many challenges such as unfavorable weather, high production costs and diseases, while the pepper growing area has decreased due to the change in crop structure. However, with low inventories and a forecast of a late 2025 harvest due to prolonged drought, pepper prices are expected to increase.
In 2024, Vietnam will export about 250.000 tons of pepper, worth 1,3 billion USD, maintaining its position as the number 1 pepper exporter. worldHowever, to maintain this position, improving product quality and value added will be important factors.
 |
| Farmers in Duc Trong district, Lam Dong province harvest pepper. |
According to statistics from the International Pepper Community (IPC), it can be said that 2024 will be a year of strong increase in pepper prices in many countries. Specifically, the price of Indonesian black pepper increased from 3.887 USD/ton to 6.855 USD/ton, thereby increasing nearly 1,8 times; the price of white pepper in this country also increased by 1,5 times.
In Malaysia, the corresponding increase was 1,7 times and 1,5 times for black pepper and white pepper. Meanwhile, the price of Brazilian black pepper doubled.
For the Vietnamese market, comparing IPC data, the export price of black pepper increased 1,6 times, with the export price of white pepper being 1,7 times. Increased production and trade factors have been embedded in pepper prices, combined with reduced output in leading producing countries, which are the main reasons for the high pepper price.
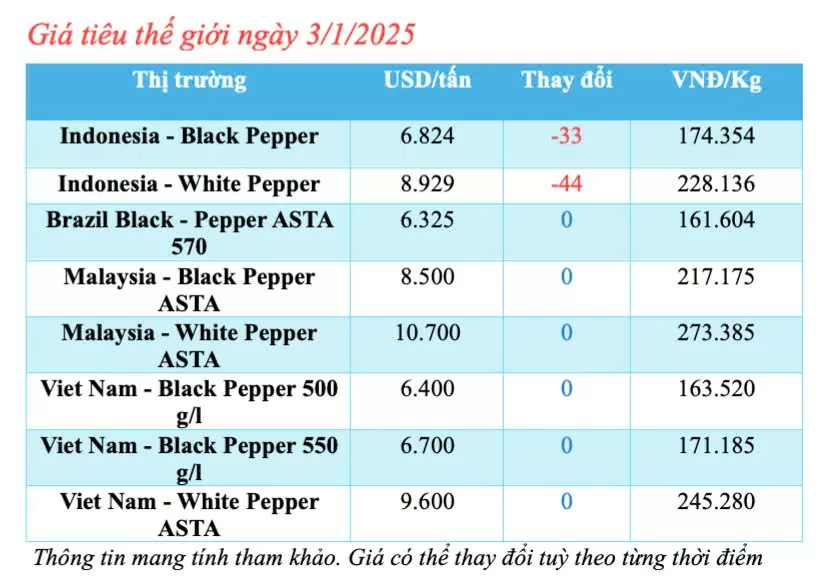 |
| Update world pepper price today January 3, 2025 |
Forecast of world pepper price tomorrow January 4, 2025
According to forecasts, world pepper prices will decrease slightly tomorrow. However, there are still increases and decreases in pepper prices in the markets of different countries.
Update on world pepper prices from the International Pepper Community (IPC) on the afternoon of January 3, 2025 as follows: the pepper market in Indonesia turned down, other markets were stable and anchored at a high level.
Specifically, IPC listed the price of Indonesian Lampung black pepper as fluctuating down compared to the previous trading session, currently at 6.824 USD/ton (down 33 USD/ton), similarly, the price of Muntok white pepper was purchased at 8.929 USD/ton (down 44 USD/ton).
The Brazilian pepper market is stable, with little fluctuation compared to the previous trading session, currently at 6.325 USD/ton.
Malaysian ASTA black pepper price is purchased at 8.500 USD/ton; ASTA white pepper price is at 10.700 USD/ton.
The export price of Vietnamese black pepper is stable, slightly decreasing, currently reaching 6.400 USD/ton for 500 g/l and 550 USD/ton for 6.700 g/l; the price of white pepper is high at 9.600 USD/ton.
*The above pepper price forecast is for reference only, the actual price will be officially available tomorrow morning (January 4, 2025) on Congthuong.vn.
Sources: https://congthuong.vn/du-bao-gia-tieu-ngay-mai-412025-gia-tieu-tang-manh-367733.html
Today’s decline puts the near-term rising trend structure at risk of being violated. Dynamic support is represented by the internal uptrend line and 20-Day line. Notice that since the 20-Day MA was reclaimed on October 29 there have been no daily closes below the line, even though intraday trading did occur below the 20-Day line.
If natural gas closes today below the 20-Day MA, it will show a change in character. This would put the 2.29 recent swing low at risk of being busted. That would then signal further weakness and increase the chance of the 50-Day MA, now at 3.13, being tested as support.
The 50-Day MA is more significant than the 20-Day MA, particularly since it shows potential support above the top boundary line of a large symmetrical triangle pattern. In addition, it is above the most recent swing low at 2.98. That swing was the first test of a prior resistance area related to the triangle formation.
It is also part of the larger trend structure of higher swing highs and higher lows, that began from the October swing low. It also resides around the initial triangle breakout trigger of 3.02. Now that the top boundary lines have fallen further, it also needs to be considered as a potential support if it approached.
In addition to bearish signs on the daily chart, the weekly chart (not shown) also looks ominous and shows bearish momentum. A bearish shooting star candle will complete today, with a likely close near the lows of the week. Further, this week’s pattern includes a long tail, derived from the bearish reversal off the top rising trend channel line (circled).
In other words, this week is the result of a bearish reversal from the top of the trend. It is supportive of a continuation lower. Nonetheless, a new bearish weekly signal will not be given unless there is a drop below this week’s low and the sellers retain control.
XAU/USD dipped on Friday, with Gold prices falling roughly two-thirds of a percent and dipping back below $2,650 per ounce as market sentiment recovers from the early week’s risk-off appetite. It’s been a wobbly start to global markets during the first week of the 2025 trading season, but investors are still looking for reasons to firm up their stance heading into the new year.
Federal Reserve (Fed) Bank of Richmond President Tom Barkin spoke to a bankers association in Maryland on Friday, highlighting that the Fed has already reduced interest rates by a full percentage point during 2024, bringing the fed funds rate down to the 4.25%-4.5% range. The US unemployment rate is also holding at historically low levels, while inflation appears to be drifting back toward the Fed’s target of 2% annually. Fed’s Barkin also downplayed the potential negative effects of incoming President Donald Trump’s plans to enact sweeping tariff proposals on his first day in office that would see the US functionally enter into simultaneous trade wars with all of the US’ closest allies and trading partners unilaterally. According to Fed policymaker Barkin, markets shouldn’t be too worried about a potential 10%-20% fee on all imported goods into the US, because the “pass-through from tariffs to prices is not straightforward, it depends on multiple factors including business supply chains, and the price elasticity of consumers.”
Coming up next week, American markets and institutions will be taking Thursday off in observation of the passing of former President Jimmy Carter, who died on December 29th at the age of 100. Friday will follow up with the first US Nonfarm Payrolls (NFP) print of 2025.
Gold prices have been caught in a rough cyclical churn through the last quarter of 2024, with XAU/USD bids routinely spinning around the $2,650 handle. Gold’s sideways grind is best highlighted by the 50-day Exponential Moving Average (EMA), which has been moving sideways since early November and is acting like a trap for bids, keeping price action constrained.
Bulls have failed repeatedly to muscle prices back above $2,720, while selling pressure remains bolstered by a near-term technical floor at the $2,600 handle.
Gold has played a key role in human’s history as it has been widely used as a store of value and medium of exchange. Currently, apart from its shine and usage for jewelry, the precious metal is widely seen as a safe-haven asset, meaning that it is considered a good investment during turbulent times. Gold is also widely seen as a hedge against inflation and against depreciating currencies as it doesn’t rely on any specific issuer or government.
Central banks are the biggest Gold holders. In their aim to support their currencies in turbulent times, central banks tend to diversify their reserves and buy Gold to improve the perceived strength of the economy and the currency. High Gold reserves can be a source of trust for a country’s solvency. Central banks added 1,136 tonnes of Gold worth around $70 billion to their reserves in 2022, according to data from the World Gold Council. This is the highest yearly purchase since records began. Central banks from emerging economies such as China, India and Turkey are quickly increasing their Gold reserves.
Gold has an inverse correlation with the US Dollar and US Treasuries, which are both major reserve and safe-haven assets. When the Dollar depreciates, Gold tends to rise, enabling investors and central banks to diversify their assets in turbulent times. Gold is also inversely correlated with risk assets. A rally in the stock market tends to weaken Gold price, while sell-offs in riskier markets tend to favor the precious metal.
The price can move due to a wide range of factors. Geopolitical instability or fears of a deep recession can quickly make Gold price escalate due to its safe-haven status. As a yield-less asset, Gold tends to rise with lower interest rates, while higher cost of money usually weighs down on the yellow metal. Still, most moves depend on how the US Dollar (USD) behaves as the asset is priced in dollars (XAU/USD). A strong Dollar tends to keep the price of Gold controlled, whereas a weaker Dollar is likely to push Gold prices up.
Silver price (XAG/USD) rises further to near $29.80 in Friday’s European session. The white metal gains as demand for safe-haven assets has improved on renewed geopolitical tensions. According to reports from Axios, US President Joe Biden discussed possible strikes on Iran’s nuclear facilities with his national security team, with few weeks remaining for President-elect Donald Trump to take administration.
Axios reported that White House National Security Advisor Jake Sullivan presented President Biden with options for a potential US attack on Iran’s nuclear sites. Historically, demand for safe-haven assets, such as Silver, improves in heightened geopolitical uncertainty.
Additionally, prospects of high inflation under the administration of Trump, as he is expected to tighten immigration controls, elevate import tariffs, and lower taxes, have also strengthened safe-haven demand. Silver tends to face high demand as investors use it as a hedge against inflation.
Meanwhile, the US Dollar (USD) edges down on Friday after a sharp rally on Thursday, with investors focusing on the US ISM Manufacturing PMI data for December, which will be published at 15:00 GMT. The Manufacturing PMI is estimated to have remained unchanged at 48.4, suggesting that factory activities contracted steadily.
10-year US Treasury yields drop to near 4.55% even though the Federal Reserve (Fed) is certain to pause the current policy-easing spell in the policy announcement on January 29.
Silver price rebounds to near the 20-day Exponential Moving Average (EMA), which trades around $29.85. However, the outlook of the white metal remains bearish till it stays below the upward-sloping trendline, which is plotted from the February 29 low of $22.30 on a daily timeframe.
The 14-day Relative Strength Index (RSI) rebounds above 40.00. A bearish momentum would come to an end if it sustains above that level.
Looking down, the September low of $27.75 would act as key support for the Silver price. On the upside, the 50-day EMA around $30.90 would be the barrier.
Silver is a precious metal highly traded among investors. It has been historically used as a store of value and a medium of exchange. Although less popular than Gold, traders may turn to Silver to diversify their investment portfolio, for its intrinsic value or as a potential hedge during high-inflation periods. Investors can buy physical Silver, in coins or in bars, or trade it through vehicles such as Exchange Traded Funds, which track its price on international markets.
Silver prices can move due to a wide range of factors. Geopolitical instability or fears of a deep recession can make Silver price escalate due to its safe-haven status, although to a lesser extent than Gold’s. As a yieldless asset, Silver tends to rise with lower interest rates. Its moves also depend on how the US Dollar (USD) behaves as the asset is priced in dollars (XAG/USD). A strong Dollar tends to keep the price of Silver at bay, whereas a weaker Dollar is likely to propel prices up. Other factors such as investment demand, mining supply – Silver is much more abundant than Gold – and recycling rates can also affect prices.
Silver is widely used in industry, particularly in sectors such as electronics or solar energy, as it has one of the highest electric conductivity of all metals – more than Copper and Gold. A surge in demand can increase prices, while a decline tends to lower them. Dynamics in the US, Chinese and Indian economies can also contribute to price swings: for the US and particularly China, their big industrial sectors use Silver in various processes; in India, consumers’ demand for the precious metal for jewellery also plays a key role in setting prices.
Silver prices tend to follow Gold’s moves. When Gold prices rise, Silver typically follows suit, as their status as safe-haven assets is similar. The Gold/Silver ratio, which shows the number of ounces of Silver needed to equal the value of one ounce of Gold, may help to determine the relative valuation between both metals. Some investors may consider a high ratio as an indicator that Silver is undervalued, or Gold is overvalued. On the contrary, a low ratio might suggest that Gold is undervalued relative to Silver.
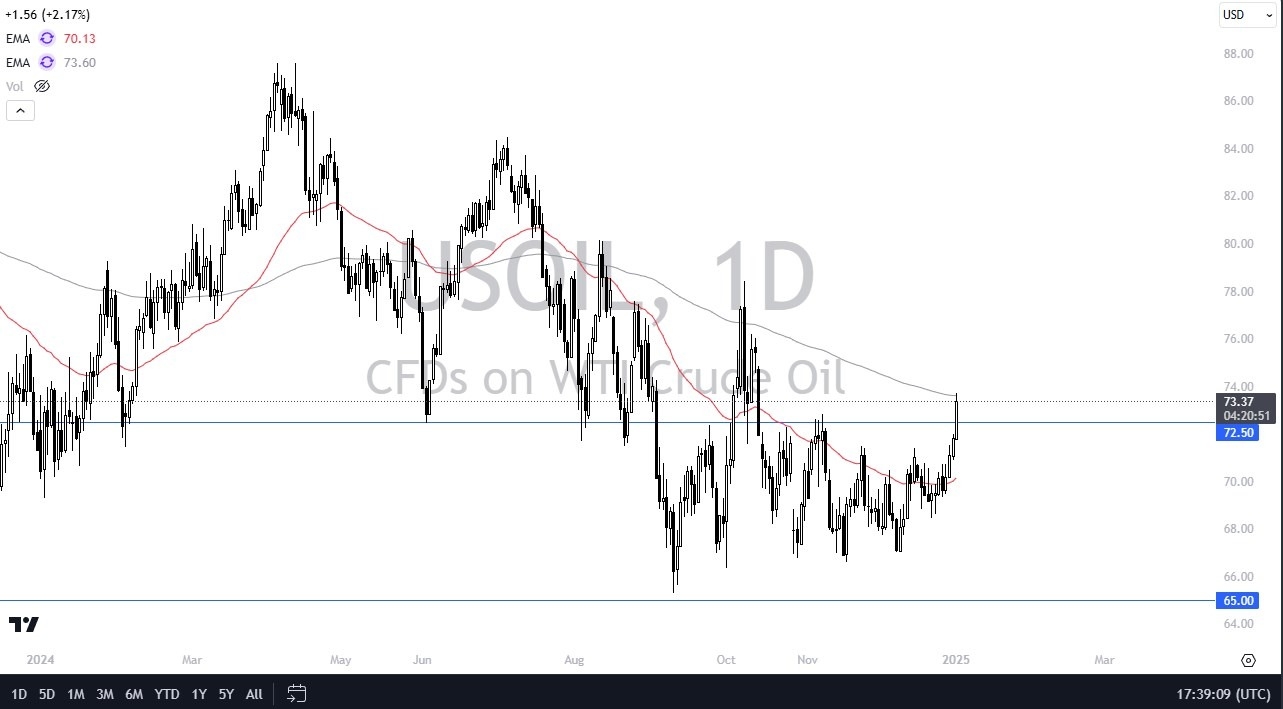
Taking further upward pressure to the market is the fact that the Crude Oil Inventories in the United States came in at -1.2 million, suggesting that we are starting to see continued energy demand.

Keep in mind this year is going to be interesting for America, as the incoming administration is very pro-business, and is likely to do everything it can to spur economic growth. This should drive up demand for energy, as of course the crude oil market is the “life’s blood” of economic activity. Because of this, it makes perfect sense that we are starting to see energy breakout, and it’s probably worth noting that the spot US Oil contract has broken above the crucial $72.50 level.
The only thing left at this point for the Bears to hang onto is the fact that the 200 Day EMA has offered a little bit of resistance, but quite frankly I don’t see any reason why it will hold. If we can break above the highs of the trading session on Thursday, then I suspect that crude oil continues to go much higher, probably aiming toward $80 before it is all said and done. However, it would make a certain amount of sense for the market to pull back toward the $72.50 level again, looking for some type of confirmation on the breakout via a pullback and bounce.
The size of the candlestick is somewhat impressive, and of course traders have come back to work, at least in a certain number, and therefore it does make sense that we would see more activity in this market. After all, I’ve been saying for weeks that it looks like we are building a basing pattern, and Thursday looks like it does in fact confirm that.
Ready to trade Crude Oil daily analysis and predictions? Here are the best Oil trading brokers to choose from.
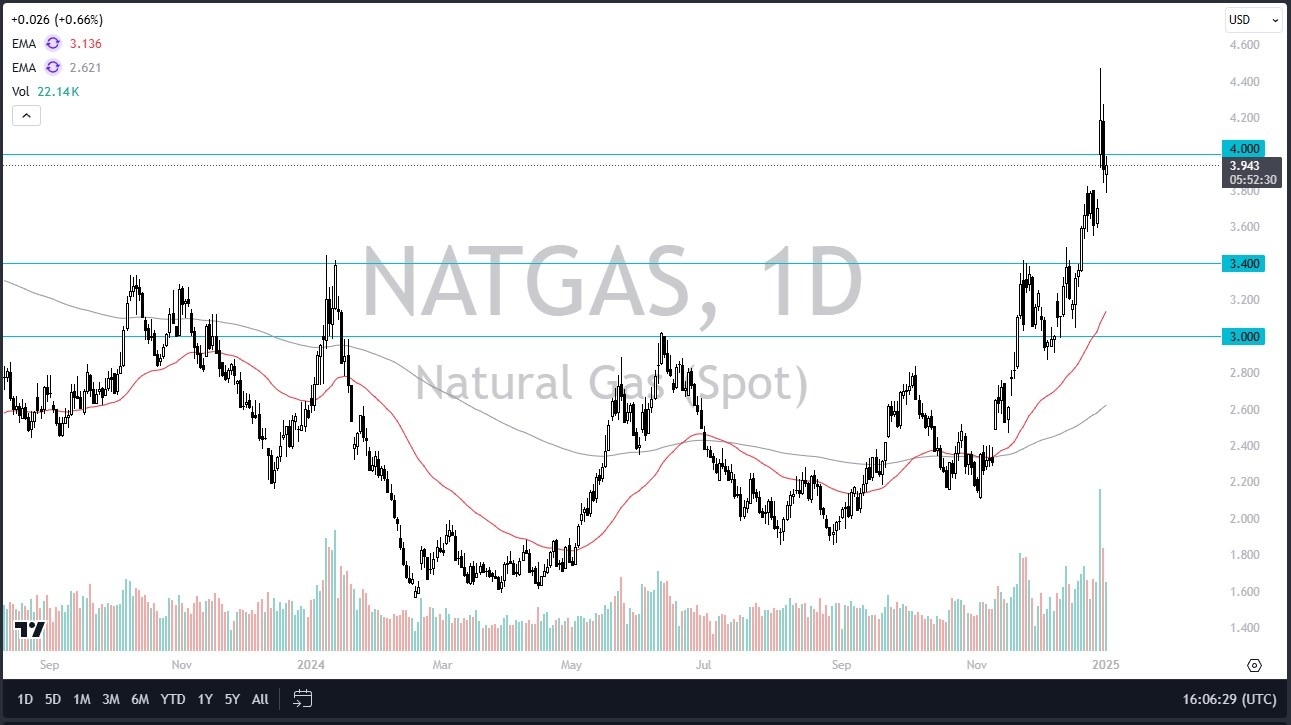
I suspect at this point we are trying to price in those colder than anticipated temperatures in the United States coming with that Arctic blast. But I think you also have to keep in mind that the futures traders out there will be looking towards spring before you know it. So, I think we only have maybe one or two more pullbacks and bounces for the rest of the season.
I do like the idea of buying a pullback if we get it. We did not quite fill the gap from earlier this week, but we’ve gotten pretty close. So, I think that’s probably close enough for government work as it were. I do think that if we can overtake the $4 level in the spot market, that opens up a potential move all the way to the $4.50 level followed by $5. I don’t like the idea of chasing the market with a huge position though. I’d be much more comfortable buying a dip closer to $3.50 with a bigger position. But I recognize that at this time, it’s obvious natural gas is breaking out.
The question is, will it have any follow through? I suspect the answer is probably yes before it’s all said and done, but the next week is going to be very erratic as we try to price in more liquidity, and of course, the idea of temperatures plummeting in the United States because they can turn around just as quickly. And if that happens, natural gas falls. There is the outlier of Europe though, and Russian gas not flowing through Ukraine, of course has somewhat of an influence as Europeans will be buying LNG from the United States, but really at this point in time, I don’t know if that is as much of a factor as the weather in New England, for example.
Ready to trade daily Forex analysis? We’ve shortlisted the best commodity brokers in the industry for you.
Silver price (XAG/USD) extends its gains for the third successive day, trading around $29.60 per troy ounce during the Asian hours on Friday. This sustained rally is attributed to strong safe-haven demand amid persistent geopolitical tensions in the Middle East and the prolonged Russia-Ukraine conflict.
Axios referenced three sources, indicating that US President Joe Biden reportedly explored contingency plans to target Iran’s nuclear facilities if Tehran advanced significantly in developing a nuclear bomb before Donald Trump’s inauguration on January 20. These talks underscore the growing concerns over Iran’s nuclear aspirations during the transition between administrations.
Reuters cited that Russia launched a drone strike on Ukraine’s capital, Kyiv, on New Year’s Day early Wednesday, resulting in two deaths, at least six injuries, and damage to buildings in two districts. Meanwhile, the Israeli military maintained pressure on northern Gaza, and carried out strikes in a suburb of Gaza City on Wednesday, according to medics. Airstrikes in Shejaia, a suburb of Gaza City, killed at least eight Palestinians.
A Financial Times report noted that the People’s Bank of China (PBoC) anticipates an interest rate cut this year at an appropriate time. Traders are closely monitoring the potential recovery in China’s economy and its effect on the industrial demand for Silver. President Xi Jinping reaffirmed his commitment on Tuesday to prioritizing economic growth, promising more proactive policies to bolster China’s economy in 2025.
While China’s manufacturing activity showed minimal growth in December, services and construction sectors have recovered. The data indicates that policy stimulus is beginning to impact certain sectors, as China prepares for new trade risks stemming from tariffs proposed by US President-elect Donald Trump.
Silver is a precious metal highly traded among investors. It has been historically used as a store of value and a medium of exchange. Although less popular than Gold, traders may turn to Silver to diversify their investment portfolio, for its intrinsic value or as a potential hedge during high-inflation periods. Investors can buy physical Silver, in coins or in bars, or trade it through vehicles such as Exchange Traded Funds, which track its price on international markets.
Silver prices can move due to a wide range of factors. Geopolitical instability or fears of a deep recession can make Silver price escalate due to its safe-haven status, although to a lesser extent than Gold’s. As a yieldless asset, Silver tends to rise with lower interest rates. Its moves also depend on how the US Dollar (USD) behaves as the asset is priced in dollars (XAG/USD). A strong Dollar tends to keep the price of Silver at bay, whereas a weaker Dollar is likely to propel prices up. Other factors such as investment demand, mining supply – Silver is much more abundant than Gold – and recycling rates can also affect prices.
Silver is widely used in industry, particularly in sectors such as electronics or solar energy, as it has one of the highest electric conductivity of all metals – more than Copper and Gold. A surge in demand can increase prices, while a decline tends to lower them. Dynamics in the US, Chinese and Indian economies can also contribute to price swings: for the US and particularly China, their big industrial sectors use Silver in various processes; in India, consumers’ demand for the precious metal for jewellery also plays a key role in setting prices.
Silver prices tend to follow Gold’s moves. When Gold prices rise, Silver typically follows suit, as their status as safe-haven assets is similar. The Gold/Silver ratio, which shows the number of ounces of Silver needed to equal the value of one ounce of Gold, may help to determine the relative valuation between both metals. Some investors may consider a high ratio as an indicator that Silver is undervalued, or Gold is overvalued. On the contrary, a low ratio might suggest that Gold is undervalued relative to Silver.
Gold price is holding close to the two-week high of $2,664 early Friday as buyers take a breather after gaining about 1.5% so far this week.
Gold price benefitted alongside the US Dollar (USD) on the first trading day of the New Year as investors flocked to safe havens amid escalating geopolitical conflicts and increased tensions surrounding the upcoming policies from the US President-elect Donald Trump and the US Federal Reserve (Fed).
Expectations that Trump’s protectionist policies could spur fresh US-Sino trade tensions and the haven demand for Gold price. However, his policies are seen as inflationary and could prompt the Fed to maintain its cautious approach to future rate cuts. The Fed’s measured stance could check the upside in the non-interest-bearing bright metal.
Meanwhile, Gold traders created fresh buying positions after Reuters reported that Israeli airstrikes killed at least 68 Palestinians in Gaza, including the Hamas-controlled police chief, his deputy, and nine displaced people. “Additionally, Russia launched a drone strike on the Ukrainian capital Kyiv early on Wednesday, causing damage in at least two districts,” Reuters said.
Moreover, Axios reported that outgoing US President Biden was presented with options for a potential attack on Iran’s nuclear facilities if Tehran moves towards a nuclear weapon before January 20.
Markets also digested the strong US jobs data, which showed that the Initial Jobless Claims hit an eight-month low last week, falling by 9,000 to 211,000 versus 222,000 estimated. However, the data appeared distorted due to the year-end holiday season.
The focus now shifts toward the top-tier US ISM Manufacturing PMI data and a speech by Richmond Fed President Tom Barkin due later on Friday for some fresh trading incentives for Gold price.
However, the broader market sentiment amid lingering Middle East geopolitical tensions and China’s economic worries will continue to play a pivotal role in the Gold price action.
The daily chart shows that the 14-day Relative Strength Index (RSI) has recaptured the 50 level, opening up further upside for Gold price.
Thursday’s Gold price rally took out all key major daily Simple Moving Averages (SMA), with the price closing above the critical 50-day SMA, then at $2,655.
If buyers regain traction, the next relevant upside target aligns at the $2,700 round level, above which the December 12 high of $2,726 will be challenged.
On the flip side, the immediate support is at the previous resistance of 21-day SMA at $2,638 if the 50-day SMA, now at $2,653, gives way.
A daily candlestick close below the latter will negate the recovery momentum, fuelling a fresh downtrend toward the weekly low of $2,596.
The Institute for Supply Management (ISM) Manufacturing Purchasing Managers Index (PMI), released on a monthly basis, is a leading indicator gauging business activity in the US manufacturing sector. The indicator is obtained from a survey of manufacturing supply executives based on information they have collected within their respective organizations. Survey responses reflect the change, if any, in the current month compared to the previous month. A reading above 50 indicates that the manufacturing economy is generally expanding, a bullish sign for the US Dollar (USD). A reading below 50 signals that factory activity is generally declining, which is seen as bearish for USD.
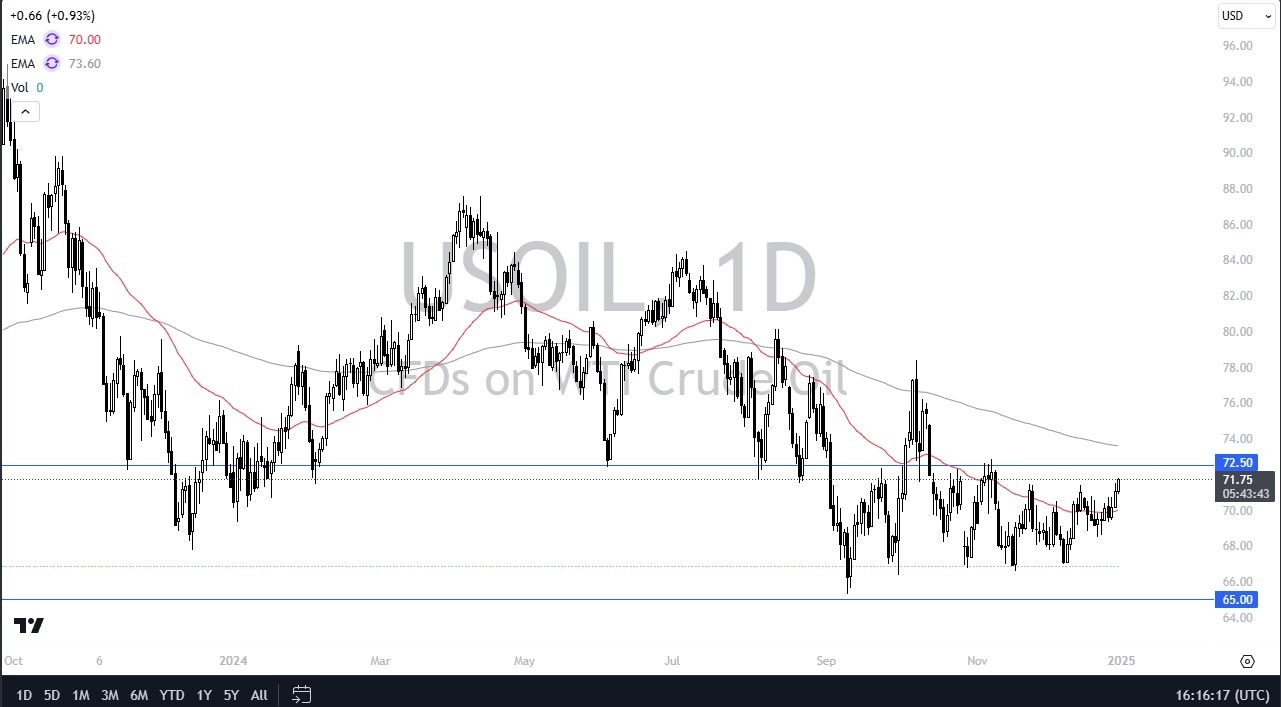
The resistance above is most obviously seen at the $72.50 level, as it has been a major barrier previously. Furthermore, we also have the 200 Day EMA sitting just above there, and it is dropping. With that being said, the market is likely to continue to see a lot of short sellers coming into the market in trying to step on the crude oil market. However, I think that there is only so much resistance it will be seen, and I do fully anticipate that this market will break out to the upside over the longer term.
Short-term pullbacks I believe end up being a nice buying opportunity with the 50 Day EMA, sitting right around the $70 level. If we were to break down below that level, then you could have a situation where traders trying to find value at lower levels, but right now I thesis is basically the market trying to find buyers on each and every dip, as it gives us an opportunity to pick up a little bit of “value” in a market that has been forming a large basing pattern for some time. Quite frankly, I like the idea of buying this market on dips, as I do believe that with the explosion of risk appetite next year would drive the demand for oil in the United States. Remember, the WTI Crude Oil market is heavily influenced by America, and America is still roaring ahead.
Ready to trade the daily crude oil Forex forecast? Here’s a list of some of the best Oil trading platforms to check out.
The Gold price (XAU/USD) consolidates its gains near $2,660 after reaching a two-week high during the early Asian session on Friday. The safe-haven flows amid the geopolitical tensions provide some support to the precious metal. The US ISM Manufacturing Purchasing Managers Index (PMI) for December will take center stage later on Friday. Also, the Richmond Fed President Thomas Barkin is scheduled to speak.
Russia carried out a drone attack on Kyiv early Wednesday, causing damage in two districts, while Israel targeted a Gaza City neighbourhood, per Reuters. Investors will closely monitor the development surrounding geopolitical risks. Any signs of escalating tensions in the Middle East and Russia-Ukraine could boost the Gold price, a traditional safe-haven asset.
Central bank purchasing activities could contribute to the yellow metal’s upside. Global central banks bought 694 tonnes of gold during the first nine months of 2024. “We think central bank interest will be a strong base for the buying next year,” noted Henrik Marx, global head of trading at Heraeus Precious Metals, which expected that gold could reach highs of $2,950 per troy ounce in 2025.
On the other hand, the slower pace of further rate cuts by the US Federal Reserve (Fed) might weigh on the non-yielding asset. The US central bank decided to lower the interest rates in December but signalled that borrowing costs will fall more slowly than previously expected this year.
Gold has played a key role in human’s history as it has been widely used as a store of value and medium of exchange. Currently, apart from its shine and usage for jewelry, the precious metal is widely seen as a safe-haven asset, meaning that it is considered a good investment during turbulent times. Gold is also widely seen as a hedge against inflation and against depreciating currencies as it doesn’t rely on any specific issuer or government.
Central banks are the biggest Gold holders. In their aim to support their currencies in turbulent times, central banks tend to diversify their reserves and buy Gold to improve the perceived strength of the economy and the currency. High Gold reserves can be a source of trust for a country’s solvency. Central banks added 1,136 tonnes of Gold worth around $70 billion to their reserves in 2022, according to data from the World Gold Council. This is the highest yearly purchase since records began. Central banks from emerging economies such as China, India and Turkey are quickly increasing their Gold reserves.
Gold has an inverse correlation with the US Dollar and US Treasuries, which are both major reserve and safe-haven assets. When the Dollar depreciates, Gold tends to rise, enabling investors and central banks to diversify their assets in turbulent times. Gold is also inversely correlated with risk assets. A rally in the stock market tends to weaken Gold price, while sell-offs in riskier markets tend to favor the precious metal.
The price can move due to a wide range of factors. Geopolitical instability or fears of a deep recession can quickly make Gold price escalate due to its safe-haven status. As a yield-less asset, Gold tends to rise with lower interest rates, while higher cost of money usually weighs down on the yellow metal. Still, most moves depend on how the US Dollar (USD) behaves as the asset is priced in dollars (XAU/USD). A strong Dollar tends to keep the price of Gold controlled, whereas a weaker Dollar is likely to push Gold prices up.