The main tag of GoldPrice Articles.
You can use the search box below to find what you need.
[wd_asp id=1]
The main tag of GoldPrice Articles.
You can use the search box below to find what you need.
[wd_asp id=1]
Spot Gold surpassed the $2,770 mark on Wednesday as market participants keep seeking safety ahead of multiple first-tier data and looming US elections. The bright metal gained upward traction ahead of Wall Street’s opening, accelerating its advance following the release of United States (US) data.
The Conference Board Consumer Confidence Index increased in October to 108.7, up from 99.2 in September. The Present Situation Index rose to 138.0, while the Expectations Index soared to 89.1, well above the threshold of 80 that usually signals a recession ahead.
The encouraging figures were partially overshadowed by an employment-related report. The number of job openings on the last business day of September stood at 7.44 million, the US Bureau of Labor Statistics (BLS) reported in the Job Openings and Labor Turnover Survey (JOLTS). The cooling labor market is more good news than bad news, as the Federal Reserve (Fed) welcomes easing wage pressures.
Caution reigns as investors focus on the preliminary estimate of the Q3 Gross Domestic Product (GDP) and the Nonfarm Payrolls (NFP) report on Friday. In the middle, the US will also release the Personal Consumption Expenditure (PCE) Price Index, the Federal Reserve’s (Fed) favorite inflation gauge. The combo could set the tone for the upcoming Fed monetary policy decision, scheduled to meet next week and announce its decision on Thursday, November 7. The decision will come 24 hours after the country heads into the polls to choose the next president.
XAU/USD retreated from its fresh high but retains most of its intraday gains and trades at around $2,766. Technical readings in the daily chart favor another leg north. The 20 Simple Moving Average (SMA) accelerated higher, well below the current level, currently at around $2,685.00. The longer moving averages, in the meantime, also gained bullish traction, standing over $300 below the current level.
In the 4-hour chart, technical readings support a bullish continuation. Indicators head firmly north within positive territory, nearing overbought readings but still with room to run. Also, the 20 SMA turned higher below the current level, providing dynamic support at around $2,740.60. The 100 and 200 SMAs, in the meantime, maintain their firmly bullish slopes far below the shorter one.
Support levels: 2,751.90 2,739.70 2,721.20
Resistance levels: 2,775.00 2,790.00 2,810.00
Silver price (XAG/USD) discovers strong buying interest in Tuesday’s North American session as the United States (US) Bureau of Labor Statistics (BLS) has reported weak set of JOLTS Job Openings data for September. The white metal extends its rally to near $34.50 as soft job opening numbers have pointed to a slowdown in the job market.
Weak US job openings data has weighed on the US Dollar (USD), which has given up its entire intraday gains. The US Dollar Index (DXY), which tracks the Greenback’s value against six major currencies, falls back to nearly 104.30 after refreshing an almost three-month high of around 104.60. 10-year US Treasury yields surrender some of its intraday gains but hold the key support of 4.20%.
The table below shows the percentage change of US Dollar (USD) against listed major currencies today. US Dollar was the strongest against the Australian Dollar.
| USD | EUR | GBP | JPY | CAD | AUD | NZD | CHF | |
|---|---|---|---|---|---|---|---|---|
| USD | 0.07% | -0.20% | 0.06% | 0.08% | 0.33% | 0.23% | 0.25% | |
| EUR | -0.07% | -0.27% | -0.02% | 0.02% | 0.26% | 0.16% | 0.22% | |
| GBP | 0.20% | 0.27% | 0.28% | 0.29% | 0.53% | 0.43% | 0.48% | |
| JPY | -0.06% | 0.02% | -0.28% | 0.03% | 0.28% | 0.17% | 0.24% | |
| CAD | -0.08% | -0.02% | -0.29% | -0.03% | 0.24% | 0.15% | 0.20% | |
| AUD | -0.33% | -0.26% | -0.53% | -0.28% | -0.24% | -0.10% | -0.08% | |
| NZD | -0.23% | -0.16% | -0.43% | -0.17% | -0.15% | 0.10% | 0.03% | |
| CHF | -0.25% | -0.22% | -0.48% | -0.24% | -0.20% | 0.08% | -0.03% |
The heat map shows percentage changes of major currencies against each other. The base currency is picked from the left column, while the quote currency is picked from the top row. For example, if you pick the US Dollar from the left column and move along the horizontal line to the Japanese Yen, the percentage change displayed in the box will represent USD (base)/JPY (quote).
This week, investors will pay close attention to the US Q3 Gross Domestic Product (GDP), Personal Consumption Expenditure Price Index (PCE) data for September, the Nonfarm Payrolls (NFP), and the ISM Manufacturing PMI data for October published this week.
The economic data will indicate how the Federal Reserve’s (Fed) monetary policy will shape the remainder of the year.
Meanwhile, the outlook of the Silver price will remain firm amid uncertainty over US presidential elections on November 5. Traders expect former US President Donald Trump to return to power, while national polls have shown fierce competition with current Vice President Kamala Harris. The risk profile has remained favorable for safe-haven assets as Trump is expected to implement protectionist policies, which will result in an inflationary environment and will have an adverse impact on the currencies of the US’s major trading partners.
Silver price aims to recapture a fresh over 12-year high near $35.00 after a breakout of three-day consolidation. The horizontal support plotted from the May 21 high of $32.50, on a daily timeframe, will act as a key cushion for Silver price bulls from where it delivered a five-month consolidation breakout. Upward-sloping 20-day Exponential Moving Average (EMA) near $32.70 signals more upside ahead.
The 14-day Relative Strength Index (RSI) stays in the 60.00-80.00, pointing to an active bullish momentum.
The real Gross Domestic Product (GDP) Annualized, released quarterly by the US Bureau of Economic Analysis, measures the value of the final goods and services produced in the United States in a given period of time. Changes in GDP are the most popular indicator of the nation’s overall economic health. The data is expressed at an annualized rate, which means that the rate has been adjusted to reflect the amount GDP would have changed over a year’s time, had it continued to grow at that specific rate. Generally speaking, a high reading is seen as bullish for the US Dollar (USD), while a low reading is seen as bearish.
Silver price (XAG/USD) gains traction to near $33.90 during the early European session on Tuesday. The ongoing geopolitical tensions in the Middle East and the uncertainties surrounding the global economy and the US presidential election lift the white metal.
Iran’s Supreme Leader Ali Khamenei has given a measured response to Israeli strikes on the country, stating that the attack should not be “exaggerated or downplayed” but refraining from pledging quick retaliation. According to the BBC, Iran’s President Masoud Pezeshkian said that the country will “respond appropriately” to an attack that killed at least four troops.
Market players will monitor the development surrounding geopolitical risks in the region. Any signs of further escalation could boost the safe-haven flows, benefiting the silver price.
Major central banks worldwide have largely begun easing monetary policy and cutting interest rates. Furthermore, the additional US Federal Reserve (Fed) rate cuts expected in the November meeting could support the non-yielding precious metal.
However, bets for a less aggressive policy easing by the Fed could cap the upside for the Silver. Financial markets anticipate the US central bank to cut interest rates by 25 basis points (bps) in both the policy meetings in November and December.
Later this week, the advanced US Q3 Gross Domestic Product (GDP), the Personal Consumption Expenditures (PCE) Price Index for September and Nonfarm Payrolls (NFP) will be the highlights. These reports could offer some hints about the size and pace of US Fed rate reductions.
Silver is a precious metal highly traded among investors. It has been historically used as a store of value and a medium of exchange. Although less popular than Gold, traders may turn to Silver to diversify their investment portfolio, for its intrinsic value or as a potential hedge during high-inflation periods. Investors can buy physical Silver, in coins or in bars, or trade it through vehicles such as Exchange Traded Funds, which track its price on international markets.
Silver prices can move due to a wide range of factors. Geopolitical instability or fears of a deep recession can make Silver price escalate due to its safe-haven status, although to a lesser extent than Gold’s. As a yieldless asset, Silver tends to rise with lower interest rates. Its moves also depend on how the US Dollar (USD) behaves as the asset is priced in dollars (XAG/USD). A strong Dollar tends to keep the price of Silver at bay, whereas a weaker Dollar is likely to propel prices up. Other factors such as investment demand, mining supply – Silver is much more abundant than Gold – and recycling rates can also affect prices.
Silver is widely used in industry, particularly in sectors such as electronics or solar energy, as it has one of the highest electric conductivity of all metals – more than Copper and Gold. A surge in demand can increase prices, while a decline tends to lower them. Dynamics in the US, Chinese and Indian economies can also contribute to price swings: for the US and particularly China, their big industrial sectors use Silver in various processes; in India, consumers’ demand for the precious metal for jewellery also plays a key role in setting prices.
Silver prices tend to follow Gold’s moves. When Gold prices rise, Silver typically follows suit, as their status as safe-haven assets is similar. The Gold/Silver ratio, which shows the number of ounces of Silver needed to equal the value of one ounce of Gold, may help to determine the relative valuation between both metals. Some investors may consider a high ratio as an indicator that Silver is undervalued, or Gold is overvalued. On the contrary, a low ratio might suggest that Gold is undervalued relative to Silver.
Most Read: Markets Weekly Outlook – ‘Magnificent 7’ Earnings, BoJ Meeting and US Jobs Data
Oil prices opened $4 lower or 5.84% on renewed ceasefire hopes after Israel launched a limited retaliatory attack on Iran over the weekend. The attack by Israel did not target any energy infrastructure but rather focused on military targets. The scope of the attacks have led to increased hopes of a potential ceasefire.
The attacks have seen the premium priced in from Geopolitical risk largely fall away. My question would be whether such a move is premature? There are some analysts who share my view that a ceasefire in the Middle East is unfortunately still far away.
OPEC + continues to lower its forecasts as does the IEA with many hoping recent Chinese stimulus may help demand concerns. However, more importantly moving forward will be whether OPEC + proceeds with production increases as planned for the end of the year. Last week this seemed plausible as Oil prices appeared to be heading back toward $80 a barrel. The narrative has shifted after the weekend, at least from my point of view. If oil prices continue to languish in the low 70’s a barrel, i think OPEC + is unlikely to raise output in December.
After the developments over the last week, CitiGroup has lowered their Brent price target for the next three months to around $70 a barrel, from a previous $74. This is a significant downgrade in my opinion and it will be interesting to monitor whether other analysts or investment banks/houses do the same.
The week ahead usually brings the most recent inventory data which will once again be monitored. There is a lot of risk this week that relates to markets as a whole with US Earnings and Jobs data ahead.
Sentiment changes from these events could also have a knock on effect on Oil prices.
For all market-moving economic releases and events, see the MarketPulse Economic Calendar.
From a technical perspective, oil has had a $4 gap to the downside over the weekend which does mess with the price action outlook. Following Friday, the technicals were hinting at a bullish continuation move for oil prices which could still materialize but seems less certain now.
Brent opened around the 72.35 mark having finished last week trading at 76.050 a barrel. As things stand, price is caught in a massive demand which would hint at a bounce. However, with the geopolitical premium out for now and Skepticism around global growth, could Oil prices decline further?
Immediate support rests at 71.50 before the psychological 70.00 mark comes into focus. Below this we have the YTD low just shy of the 69.00 to keep an eye on.
As much i would love a recovery and for Oil prices to close the gap, i am not sure if we have the right conditions for that at the minute. A move higher from here will have to negotiate the resistance area at 73.40 before 75.00 deserves attention. A break above 76.35 could lead to a speedy rally toward the 79.00 handle.
Brent Crude Oil Daily Chart, October 28, 2024

Source: TradingView (click to enlarge)
Support
Resistance
Follow Zain on Twitter/X for Additional Market News and Insights @zvawda
Content is for general information purposes only. It is not investment advice or a solution to buy or sell securities. Opinions are the authors; not necessarily that of OANDA Business Information & Services, Inc. or any of its affiliates, subsidiaries, officers or directors. If you would like to reproduce or redistribute any of the content found on MarketPulse, an award winning forex, commodities and global indices analysis and news site service produced by OANDA Business Information & Services, Inc., please access the RSS feed or contact us at info@marketpulse.com. Visit https://www.marketpulse.com/ to find out more about the beat of the global markets. © 2023 OANDA Business Information & Services Inc.
Gold price is building on the previous day’s rebound, eyeing a sustained move above $2,750 early Tuesday. Despite the renewed uptick, Gold price remain within a familiar range as the US Dollar (USD) rally takes a breather ahead of top-tier US economic data releases due later on Tuesday.
USD buyers resort to profit-taking after the recent upsurge to three-month highs while repositioning in the run-up to the high-impact US statistics due this week. Later this Tuesday, the JOLTS Job Openings survey and the Conference Board Consumer Confidence data will be eyed to gauge the US economic resilience, which could provide fresh hints on the Federal Reserve’s (Fed) interest-rate cut outlook.
The Greenback traders also remain wary ahead of Thursday’s release of the Fed’s preferred inflation measure, the PCE Price Index, followed by the all-important US Nonfarm Payrolls (NFP) showdown. Additionally, traders’ nervousness before the publication of the third-quarter earnings reports of the US’ biggest companies by market capitalization, including Google’s parent company Alphabet, Meta Platforms, Amazon Inc., etc., also keeps the USD on the back foot.
Meanwhile, increased enthusiasm that former US President Donald Trump could win the November 5 election, combined with hopes of more Chinese stimulus, underpin global equities, diminishing the attractiveness of the go-to safe-haven, the US Dollar.
Against a broad US Dollar pullback, Gold price is trying its luck to make another headway toward the record high of $2,759, despite reports that physical Gold demand from China has taken a hit.
According to a state-backed gold association, cited by Reuters on Monday, “China’s gold consumption in the first three quarters of 2024 slid 11.18% from the same period a year ago to 741.732 metric tons as high prices dented buying interest for jewelry products.”
Further, the festive season in India – the world’s no.2 yellow metal market – also lends support to the bright metal.
However, it remains to be seen whether Gold price can sustain its uptick, as the US Dollar could jump back on the bids on the revival of the USD/JPY bullish momentum. At the press time, the Japanese Yen has recovered some ground on a dip in Japan’s Unemployment Rate, suggesting tight labor market conditions that are conducive for the Bank of Japan (BoJ) to mull further rate hikes. This has triggered a decent USD/JPY pullback below 153.00.
Gold price will also take cues from the upcoming US data and sentiment on Wall Street, as the US earnings calendar heats up.
As observed on the daily chart, Gold price has entered a phase of consolidation, with the upside capped by the record high of $2,759 set on October 23 while buyers continue to find demand at $2,723, the 23.6% Fibonacci Retracement (Fibo) level of the latest record rally from the October 10 low of $2,604 to all-time high of $2,759.
The 14-day Relative Strength Index (RSI) is inching higher, approaching the overbought region, currently near 69. The leading indicator indicates more room for Gold price upside in the near term.
Therefore, Gold buyers need a sustained move above the $2,750 psychological barrier to take on the lifetime high at $2,759. Further up, the $2,570 level will challenge the bearish commitments.
On the downside, the 23.6% Fibo support at $2,723 remains a tough nut to crack for Gold sellers.
Acceptance below that level on a daily candlestick closing basis could revive the correction, targeting the 38.2% Fibo level of the same ascent at $2,700.
Further south, the 50% Fibo support at $2,681 will be challenged, where the 21-day Simple Moving Average (SMA) aligns.
JOLTS Job Openings is a survey done by the US Bureau of Labor Statistics to help measure job vacancies. It collects data from employers including retailers, manufacturers and different offices each month.
Today’s sharp bearish reversal triggered a decline below the inside day from Friday. Both last Friday and Thursday’s highs found resistance around the purple 20-Day MA, now at 2.57. That was the top of the counter-trend rally seen so far. There was concern discussed recently about potential resistance around the 20-Day line, and the bearish answer is now clear. However, how that plays out with the larger developing patterns remains to be seen.
The two key price levels to be aware of are last week’s high of 2.58 and low of 2.21. Until then, natural gas is consolidating within last week’s price range when considered on a weekly basis. Also, the market has clearly recognized the price zone represented by the 20-Day MA and therefore it may do so again. Although trendlines may not be too reliable on their own as a signal they can provide indications of improving or decreasing demand. So, the internal uptrend line can be watched in that regard. If there is a daily close below the line, the chance of a deeper pullback from there increases.
A clear sign of strength will be given if the 20-Day line is recaptured. However, a daily close confirming the breakout will be needed to indicate that price is likely to continue to strengthen. Further, a rally above last week’s high is needed to provide a weekly bullish signal. Of course, that would also signal a breakout above the most recent swing high as seen on the daily chart and thereby trigger a continuation of the bull trend as it would signal a higher swing high.
For a look at all of today’s economic events, check out our economic calendar.
Silver price clings to gains above $33.50 yet struggles to clear the $34.00 mark amid falling through high US 10-year T-note yields at 4.260%. At the time of writing, the XAG/USD trades at $33.79, up by 0.30%.
The grey metal remains bullish, though it has failed to clear the October 25 daily peak at $34.01, opening the door to complete a ‘bullish harami’ candle pattern.
Momentum remains positive, with the Relative Strength Index (RSI) in bullish territory and aiming upwards. Therefore, the XAG/USD could test $34.00 in the short term.
If XAG/USD climbs past $34.00, the next resistance would be the year-to-date (YTD) high at $34.86. A breach of the latter will expose the October 2012 peak at $35.40.
Conversely, if Silver price extended its losses below the October 25 swing low of $33.09, this could expose the October 17 pivot low at $31.32. On further weakness, XAG/USD’s next support would be the 50-day Simple Moving Average (SMA) at $30.82.
Silver is a precious metal highly traded among investors. It has been historically used as a store of value and a medium of exchange. Although less popular than Gold, traders may turn to Silver to diversify their investment portfolio, for its intrinsic value or as a potential hedge during high-inflation periods. Investors can buy physical Silver, in coins or in bars, or trade it through vehicles such as Exchange Traded Funds, which track its price on international markets.
Silver prices can move due to a wide range of factors. Geopolitical instability or fears of a deep recession can make Silver price escalate due to its safe-haven status, although to a lesser extent than Gold’s. As a yieldless asset, Silver tends to rise with lower interest rates. Its moves also depend on how the US Dollar (USD) behaves as the asset is priced in dollars (XAG/USD). A strong Dollar tends to keep the price of Silver at bay, whereas a weaker Dollar is likely to propel prices up. Other factors such as investment demand, mining supply – Silver is much more abundant than Gold – and recycling rates can also affect prices.
Silver is widely used in industry, particularly in sectors such as electronics or solar energy, as it has one of the highest electric conductivity of all metals – more than Copper and Gold. A surge in demand can increase prices, while a decline tends to lower them. Dynamics in the US, Chinese and Indian economies can also contribute to price swings: for the US and particularly China, their big industrial sectors use Silver in various processes; in India, consumers’ demand for the precious metal for jewellery also plays a key role in setting prices.
Silver prices tend to follow Gold’s moves. When Gold prices rise, Silver typically follows suit, as their status as safe-haven assets is similar. The Gold/Silver ratio, which shows the number of ounces of Silver needed to equal the value of one ounce of Gold, may help to determine the relative valuation between both metals. Some investors may consider a high ratio as an indicator that Silver is undervalued, or Gold is overvalued. On the contrary, a low ratio might suggest that Gold is undervalued relative to Silver.
Experts predict that coffee prices on October 29, 10 in the domestic market will continue to decline tomorrow and tend to decrease in the following days.
The 2024-2025 coffee crop has begun since early October, and the price of Robusta coffee on the London exchange has dropped about $10/ton compared to its peak at the end of September.
At the market world, the Brazilian Real continued to decline sharply, causing the USD/BRL exchange rate to increase during trading hours. Favorable weather in Brazil and abundant supply from the new harvest in Vietnam continued to be factors that caused coffee prices to decline last week.
Recorded in the trading session on October 28, 10, domestic coffee prices today are stable at around 2024-109.400 VND/kg. Currently, the average purchase price in the Central Highlands provinces is 110.000 VND/kg, the highest purchase price in the province Dak Nong 110.000 VND/kg.
| Coffee price forecast October 29, 10: Will the decline in domestic coffee prices stop? |
Specifically, the coffee purchase price in the province Gia Lai (Chu Prong) is 109.800 VND, unchanged from yesterday, in Pleiku and La Grai the same price is 109.700 VND/kg; In the province Kon Tum at the price of 109.800 VND/kg, stable compared to yesterday; In Dak Nong province, coffee was purchased at the highest price of 110.000 VND/kg, stable compared to yesterday.
Price of green coffee beans (coffee beans, fresh coffee beans) in the province Lam Dong In districts such as Bao Loc, Di Linh, Lam Ha, coffee was purchased at 109.400 VND/kg, unchanged from yesterday.
Coffee prices today (April 28) in the province Dak LakIn Cu M’gar district, coffee was purchased at about 109.800 VND/kg, also slowing down following the general trend, while in Ea H’leo district and Buon Ho town, it was purchased at the same price of 109.700 VND/kg.
Updated world coffee prices at 20:00 p.m. on August 28, 10, Vietnam time on the London exchange, the price of Robusta coffee futures contract for delivery in September 2024 on the London floor is at 11 USD/ton, an increase 2024 USD compared to the beginning of the trading session.
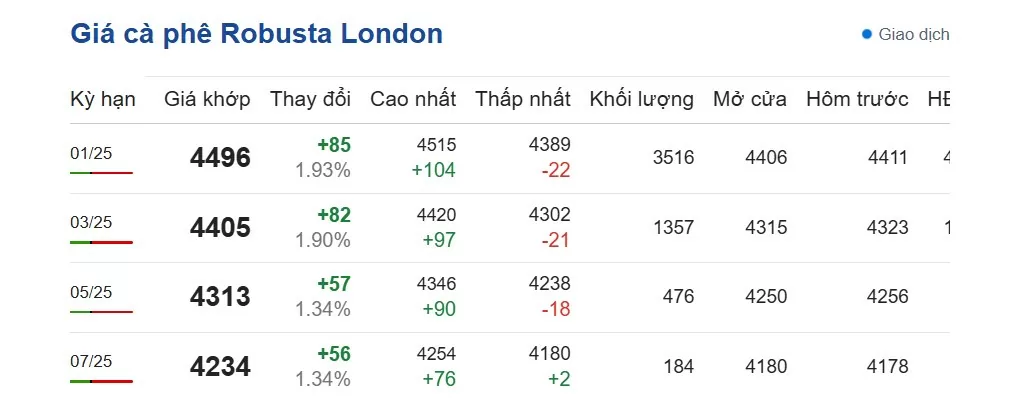 |
| Coffee prices today, July 28, 10: Robusta coffee prices on the London floor. (Photo: Screenshot from giacaphe.com |
Delivery term in November 1 is 2025 USD/ton, an increase of 4.405 USD; Delivery term in January 82 is 3 USD/ton, up 2025 USD and delivery term in March 4.313 is 57 USD/ton, up 5 USD.
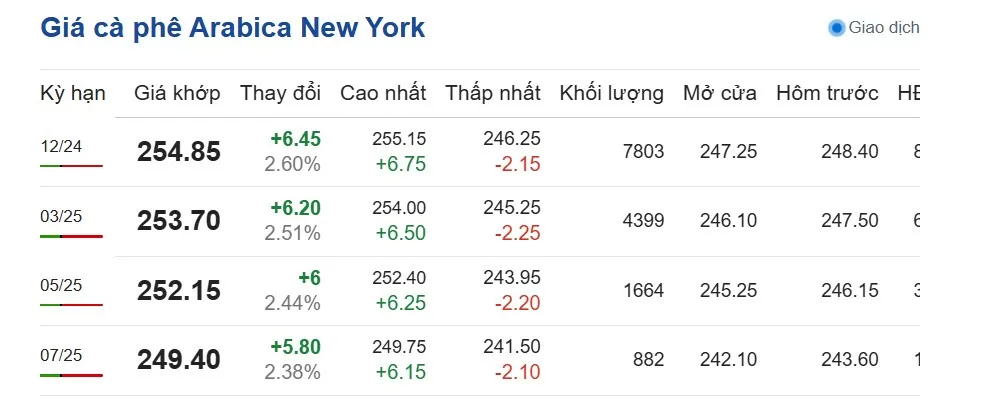 |
| Arabica coffee prices on the New York floor on October 28, 10. (Photo: Screenshot of giacaphe.com) |
In particular, the price of Arabica coffee on the New York floor today at 20:00 p.m. on September 28, 10 increased in all terms, fluctuating at 2024 – 249.40 cents/lb.
Specifically, the delivery term in September 12 is 2024 cents/lb; increased 254.85 cents/lb compared to the beginning of the session. December 6.45 delivery is 3 cents/lb, an increase of 2025 cents/lb; The March 253.70 delivery period is 6.20 cents/lb, an increase of 5 cents/lb and the May 2025 delivery period is 252.15 cents/lb, an increase of 6 cents/lb.
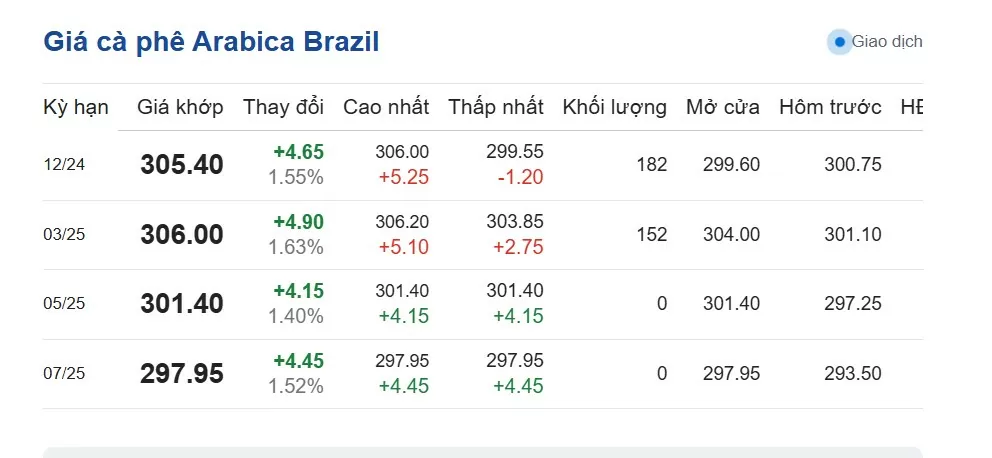 |
| Brazilian Arabica coffee price on October 28, 10. (Photo: Screenshot of giacaphe.com) |
The price of Brazilian Arabica coffee today at 21:00 p.m. on October 28, 10 increased. Specifically, the delivery period for December 2024 is 12 USD/ton, up 2024%; the delivery period for March 305.40 is 1.63 USD/ton, up 3%; the delivery period for May 2025 is 306.00 USD/ton, up 1.63% and the delivery period for July 5 is 2025 USD/ton, up 301.40%.
Robusta coffee traded on ICE Futures Europe (London floor) opens at 16:00 and closes at 00:30 (the next day), Vietnam time.
Arabica coffee on the ICE Futures US floor (New York floor) opens at 16:15 p.m. and closes at 01:30 a.m. (the next day), Vietnam time.
According to the Import-Export Department (Ministry of Industry and Trade), world coffee prices have decreased recently due to the Brazilian Real falling against the USD, encouraging Brazilian producers to increase sales.
In addition, favorable weather and steady rainfall in Brazil’s key robusta growing region of Espirito Santos have eased supply concerns that have put downward pressure on prices.
As Vietnam enters a new harvest season, increased supplies of robusta coffee also impact coffee prices.
In addition, the European Deforestation Regulation (EUDR) is being suspended to allow third countries, Member States, operators and traders to fully prepare for due diligence obligations, which is also expected to impact coffee prices. The regulation is scheduled to be voted on by the European Parliament on 13 and 14 November 11.
Information for reference only. Prices may vary depending on locality.
Sources: https://congthuong.vn/du-bao-gia-ca-phe-ngay-29102024-da-giam-cua-gia-ca-phe-trong-nuoc-chua-dung-lai-355329.html
Spot Gold is comfortable trading in the $2,740 price zone, marginally higher for the day. The bright metal gapped lower at the weekly opening amid renewed US Dollar demand, although the latter changed course amid an improved market mood. Such a better sentiment limits the upside for XAU/USD in the American session.
The focus during Asian trading hours was on Japan after a snap election that resulted in the worst result in fifteen years for the Liberal Democratic Party (LDP). Prime Minister Shigeru Ishiba pledged to stay in office despite losing support amid a political scandal, including undocumented political funds and kickbacks. The Japanese Yen (JPY) edged sharply lower, supporting the USD.
Falling oil prices also helped the Greenback. Crude Oil Prices fell after Iran reported that the latest Israel attacks did not affect the country’s oil industry. As a result, stock markets trade in positive territory. Gains are modest ahead of multiple first-tier figures scheduled throughout the week. The United States (US) will publish the flash estimate of the Q3 Gross Domestic Product (GDP) and several employment-related figures ahead of the Nonfarm Payrolls (NFP) report scheduled for Friday. Additionally, the US, Australia, Germany and the Eurozone will publish fresh inflation-related figures, while the Bank of Japan (BoJ) will announce its decision on monetary policy.
Gold holds on to modest intraday gains but trades below Friday’s close and within familiar levels. XAU/USD daily chart shows moving averages keep heading north far below the current level, with the 20 Simple Moving Average (SMA) accelerating higher, in line with buyers’ dominance. Technical indicators, on the contrary, offer neutral-to-bearish slopes holding within positive levels.
Even further, XAU/USD met intraday buyers just ahead of $2,721.20, the 23.6% Fibonacci retracement of the $2,601.87/$2,756.36 rally. More relevant support comes at $2,698.66, which is the 38.2% retracement of the same rally.
The near-term technical picture is neutral. The XAU/USD 4-hour chart shows the pair barely holding above a mildly bearish 20 SMA. The 100 and 200 SMAs keep heading north far below the current level, yet technical indicators have turned marginally lower, just above their midlines. A break through the intraday high at around $2,745.90 should favor a retest of the record high en route to the $2,800 mark.
Support levels: 2,721.20 2,708.50, 2,698.60
Resistance levels: 2,745.90 2,758.40 2,775.00
Silver price (XAG/USD) trades cautiously below the key resistance of $34.00 in Monday’s North American session. The white metal faces slight pressure as traders brace for an array of United States (US) economic data to be published this week.
Investors will pay close attention to labor market-related data, Personal Consumption Expenditure Price Index (PCE), and the Q3 Gross Domestic Product (GDP) data to get fresh cues about the Federal Reserve’s (Fed) likely interest rate action in the remainder of the year.
Currently, financial market participants expect the Fed to cut interest rates by 25 basis points (bps) in both the policy meetings in November and December. With decent confidence among Fed officials that the disinflationary trend is intact, the labor market and the GDP data will be keenly watched to understand the quantum of economic risks.
The US Dollar Index (DXY), which tracks the Greenback’s value against ix major currencies, retreats after failing to extend its upside above an almost three-week high of 104.60. 10-year US Treasury yields trade sideways near 4.23%.
On the geopolitical front, war between Israel and Iran will continue to keep the Silver price well-supported. Israel launched airstrikes on Iran’s defense-manufacturing capacity over the weekend. After the attack, Israel Prime Minister Benjamin Netanyahu said, “We promised we would respond to the Iranian attack, and on Saturday we struck. The attack in Iran was precise and powerful, achieving all of its objectives”, Home Newsday reported.
The scenario of deepening geopolitical tensions bodes well for precious metals, such as Silver price, as investors consider them a safe-haven bet.
Silver price trades inside Friday’s trading range in North American trading hours on Monday. The white metal strives to revisit a fresh over 12-year high near $35.00. The asset strengthened after breaking above the horizontal resistance plotted from the May 21 high of $32.50 on a daily timeframe, which will act as support for now. Upward-sloping 20-day Exponential Moving Average (EMA) near $32.55 signals more upside ahead.
The 14-day Relative Strength Index (RSI) stays in the 60.00-80.00, pointing to an active bullish momentum.
Silver is a precious metal highly traded among investors. It has been historically used as a store of value and a medium of exchange. Although less popular than Gold, traders may turn to Silver to diversify their investment portfolio, for its intrinsic value or as a potential hedge during high-inflation periods. Investors can buy physical Silver, in coins or in bars, or trade it through vehicles such as Exchange Traded Funds, which track its price on international markets.
Silver prices can move due to a wide range of factors. Geopolitical instability or fears of a deep recession can make Silver price escalate due to its safe-haven status, although to a lesser extent than Gold’s. As a yieldless asset, Silver tends to rise with lower interest rates. Its moves also depend on how the US Dollar (USD) behaves as the asset is priced in dollars (XAG/USD). A strong Dollar tends to keep the price of Silver at bay, whereas a weaker Dollar is likely to propel prices up. Other factors such as investment demand, mining supply – Silver is much more abundant than Gold – and recycling rates can also affect prices.
Silver is widely used in industry, particularly in sectors such as electronics or solar energy, as it has one of the highest electric conductivity of all metals – more than Copper and Gold. A surge in demand can increase prices, while a decline tends to lower them. Dynamics in the US, Chinese and Indian economies can also contribute to price swings: for the US and particularly China, their big industrial sectors use Silver in various processes; in India, consumers’ demand for the precious metal for jewellery also plays a key role in setting prices.
Silver prices tend to follow Gold’s moves. When Gold prices rise, Silver typically follows suit, as their status as safe-haven assets is similar. The Gold/Silver ratio, which shows the number of ounces of Silver needed to equal the value of one ounce of Gold, may help to determine the relative valuation between both metals. Some investors may consider a high ratio as an indicator that Silver is undervalued, or Gold is overvalued. On the contrary, a low ratio might suggest that Gold is undervalued relative to Silver.