The main tag of GoldPrice Articles.
You can use the search box below to find what you need.
[wd_asp id=1]
The main tag of GoldPrice Articles.
You can use the search box below to find what you need.
[wd_asp id=1]
You have reached your limit of 5 free articles for this month.
Access all our articles, insights, and analysts.
Your coupon code
Gold price is making a minor recovery attempt early Tuesday after witnessing a negative start to the week on Monday. Despite the bounce, Gold price looks vulnerable amid a renewed US Dollar uptick, as traders reposition ahead of speeches from a bunch of Federal Reserve (Fed) policymakers and the high-impact US Retail Sales data.
Gold price tracks US Treasury bond yields move
Gold price has been tracking the moves in the US Treasury bond yields so far this week, pausing its previous decline amid a modest weakness in the US Treasury bond yields. With an extension of the Wall Street risk rally into Asia, however, it remains to be seen if Gold price remains supported in the lead-up to the US economic docket.
Additionally, if the US Dollar rebound gains traction on robust Retail Sales data or hawkish remarks from Fed policymakers, Gold price could come under renewed selling pressure. US Retail Sales are expected to rise 0.2% MoM in May after reporting no growth in April. The core Retail Sales are likely to increase by 0.2% in May, at the same pace seen in April.
Meanwhile, the Fed speakers include Barkin, Kugler, Logan, Musalem and Goolsbee. Any hints from the officials warranting caution on inflation or pushing back against rate cuts will inject a fresh bout of strength into the US Dollar at the expense of Gold price.
Despite the range-play seen in Gold price over the past week, risks remain skewed to the downside.
The Gold price upside is capped by the confluence zone of $2,345, where the 21-day Simple Moving Average (SMA) and the 50-day SMA hang around. On the other hand, the downside appears guarded by the May 3 low of $2,277.
The 14-day Relative Strength Index (RSI) stays bearish below the 50 level, currently near 48.00, justifying the downside risks.
Adding credence to the bearish potential, the 21-day SMA crossed the 50-day SMA from above on a daily closing basis on Friday, validating a Bear Cross.
The immediate support is now seen at the $2,300 threshold, below which the June 10 low of $2,287 will be tested.
A sustained break below the latter will threaten the May 3 low of $2,277, as sellers aim for the $2,250 psychological barrier.
Alternatively, any rebound in Gold price will need acceptance above the aforementioned key confluence support-turned-resistance near $2,345.
Gold buyers will then flex their muscles toward the May 24 high of $2,364 on their way to the June 7 high of $2,388.
Gold has played a key role in human’s history as it has been widely used as a store of value and medium of exchange. Currently, apart from its shine and usage for jewelry, the precious metal is widely seen as a safe-haven asset, meaning that it is considered a good investment during turbulent times. Gold is also widely seen as a hedge against inflation and against depreciating currencies as it doesn’t rely on any specific issuer or government.
Central banks are the biggest Gold holders. In their aim to support their currencies in turbulent times, central banks tend to diversify their reserves and buy Gold to improve the perceived strength of the economy and the currency. High Gold reserves can be a source of trust for a country’s solvency. Central banks added 1,136 tonnes of Gold worth around $70 billion to their reserves in 2022, according to data from the World Gold Council. This is the highest yearly purchase since records began. Central banks from emerging economies such as China, India and Turkey are quickly increasing their Gold reserves.
Gold has an inverse correlation with the US Dollar and US Treasuries, which are both major reserve and safe-haven assets. When the Dollar depreciates, Gold tends to rise, enabling investors and central banks to diversify their assets in turbulent times. Gold is also inversely correlated with risk assets. A rally in the stock market tends to weaken Gold price, while sell-offs in riskier markets tend to favor the precious metal.
The price can move due to a wide range of factors. Geopolitical instability or fears of a deep recession can quickly make Gold price escalate due to its safe-haven status. As a yield-less asset, Gold tends to rise with lower interest rates, while higher cost of money usually weighs down on the yellow metal. Still, most moves depend on how the US Dollar (USD) behaves as the asset is priced in dollars (XAU/USD). A strong Dollar tends to keep the price of Gold controlled, whereas a weaker Dollar is likely to push Gold prices up.
Gold price is making a minor recovery attempt early Tuesday after witnessing a negative start to the week on Monday. Despite the bounce, Gold price looks vulnerable amid a renewed US Dollar uptick, as traders reposition ahead of speeches from a bunch of Federal Reserve (Fed) policymakers and the high-impact US Retail Sales data.
Gold price tracks US Treasury bond yields move
Gold price has been tracking the moves in the US Treasury bond yields so far this week, pausing its previous decline amid a modest weakness in the US Treasury bond yields. With an extension of the Wall Street risk rally into Asia, however, it remains to be seen if Gold price remains supported in the lead-up to the US economic docket.
Additionally, if the US Dollar rebound gains traction on robust Retail Sales data or hawkish remarks from Fed policymakers, Gold price could come under renewed selling pressure. US Retail Sales are expected to rise 0.2% MoM in May after reporting no growth in April. The core Retail Sales are likely to increase by 0.2% in May, at the same pace seen in April.
Meanwhile, the Fed speakers include Barkin, Kugler, Logan, Musalem and Goolsbee. Any hints from the officials warranting caution on inflation or pushing back against rate cuts will inject a fresh bout of strength into the US Dollar at the expense of Gold price.
Despite the range-play seen in Gold price over the past week, risks remain skewed to the downside.
The Gold price upside is capped by the confluence zone of $2,345, where the 21-day Simple Moving Average (SMA) and the 50-day SMA hang around. On the other hand, the downside appears guarded by the May 3 low of $2,277.
The 14-day Relative Strength Index (RSI) stays bearish below the 50 level, currently near 48.00, justifying the downside risks.
Adding credence to the bearish potential, the 21-day SMA crossed the 50-day SMA from above on a daily closing basis on Friday, validating a Bear Cross.
The immediate support is now seen at the $2,300 threshold, below which the June 10 low of $2,287 will be tested.
A sustained break below the latter will threaten the May 3 low of $2,277, as sellers aim for the $2,250 psychological barrier.
Alternatively, any rebound in Gold price will need acceptance above the aforementioned key confluence support-turned-resistance near $2,345.
Gold buyers will then flex their muscles toward the May 24 high of $2,364 on their way to the June 7 high of $2,388.
Gold has played a key role in human’s history as it has been widely used as a store of value and medium of exchange. Currently, apart from its shine and usage for jewelry, the precious metal is widely seen as a safe-haven asset, meaning that it is considered a good investment during turbulent times. Gold is also widely seen as a hedge against inflation and against depreciating currencies as it doesn’t rely on any specific issuer or government.
Central banks are the biggest Gold holders. In their aim to support their currencies in turbulent times, central banks tend to diversify their reserves and buy Gold to improve the perceived strength of the economy and the currency. High Gold reserves can be a source of trust for a country’s solvency. Central banks added 1,136 tonnes of Gold worth around $70 billion to their reserves in 2022, according to data from the World Gold Council. This is the highest yearly purchase since records began. Central banks from emerging economies such as China, India and Turkey are quickly increasing their Gold reserves.
Gold has an inverse correlation with the US Dollar and US Treasuries, which are both major reserve and safe-haven assets. When the Dollar depreciates, Gold tends to rise, enabling investors and central banks to diversify their assets in turbulent times. Gold is also inversely correlated with risk assets. A rally in the stock market tends to weaken Gold price, while sell-offs in riskier markets tend to favor the precious metal.
The price can move due to a wide range of factors. Geopolitical instability or fears of a deep recession can quickly make Gold price escalate due to its safe-haven status. As a yield-less asset, Gold tends to rise with lower interest rates, while higher cost of money usually weighs down on the yellow metal. Still, most moves depend on how the US Dollar (USD) behaves as the asset is priced in dollars (XAU/USD). A strong Dollar tends to keep the price of Gold controlled, whereas a weaker Dollar is likely to push Gold prices up.
Lower prices begin to put recent bullish activity at risk of failure. Although there could still be a brief drop lower in the short term, if a quick recovery follows it will put natural gas back in a position to progress its uptrend. The 61.8% Fibonacci retracement level is at 2.74. If the 20-Day line is busted, currently at 2.76, then natural gas will likely reach the 2.74 area.
If support is seen from there, followed by a recovery above the 20-Day line, the bullish price structure will be maintained. However, a drop below the 20-Day line where natural gas then stays below the line, will be short-term bearish. A failure of the bull pennant breakout is indicated on a drop below the center line at 2.70.
If a bullish setup completes today, then a decisive breakout above today’s high of 2.85 will be a sign of strength. Today’s candlestick pattern may take the form of a bull hammer candlestick pattern. A daily close in the top third of the day’s range will be a stronger indication than a close lower than the top third of the range. A decisive advance above today’s high would then be a sign of strength that should continue to higher prices.
Today’s decline in natural gas also triggered a bearish reversal on a weekly time frame. The weekly pattern last week was of a bearish shooting start candle. It triggered today on a drop below 2.86 and it will confirm on a daily close below that price level.
For a look at all of today’s economic events, check out our economic calendar.
You have reached your limit of 5 free articles for this month.
Access all our articles, insights, and analysts.
Your coupon code
XAU/USD came under selling pressure after Wall Street’s opening and trades near an intraday low of $2,309.84. The US Dollar was generally stronger throughout the Asian and European sessions as caution prevailed. China released mixed data at the beginning of the day, as May Industrial Production rose by 5.6% YoY, missing expectations, while Retail Sales in the same period were up 3.7%, beating estimates. The news fell short of boosting the market mood, which remained sour also during European trading hours amid political turmoil following far-right parties victory in the European Parlamentary election.
The optimistic tone of Wall Street, however, undermined demand for safe-haven assets. The US Dollar is down against most major rivals, while Gold loses ground against the USD. Firmer government bond yields add to XAU/USD slide, as the 10-year Treasury note offers 4.28%, up 7 basis points (bps), while the 2-year note yields 4.75%, also adding 7 bps.
Investors will now focus on Retail Sales, as the United States (US) will release May data on Tuesday. Sales are expected to have increased by a modest 0.2% in the month, improving from the previous 0% reading. The country will also release Industrial Production and Capacity Utilization for the same month.
The daily chart for XAU/USD shows a bearish 20 Simple Moving Average (SMA) that keeps attracting selling interest, providing dynamic resistance at around $2,340. The longer moving averages remain below the current level with bullish slopes, yet they are not close enough to be relevant. Finally, technical indicators aim lower within negative levels with limited downward momentum. Overall, the risk skews to the downside, yet the pair would need to pierce the June monthly low at 2,286.69 to signal a bearish continuation.
In the near term, and according to the 4-hour chart, XAU/USD is neutral-to-bearish. Gold trades below all its moving averages, although the 20 SMA is not far above the current level and flat, suggesting selling interest is limited. Technical indicators, in the meantime, turned marginally lower but remain within neutral levels.
Support levels: 2,298.10 2,286.70 2,271.90
Resistance levels: 2,321.55 2,333.10 2,340.00
XAU/USD came under selling pressure after Wall Street’s opening and trades near an intraday low of $2,309.84. The US Dollar was generally stronger throughout the Asian and European sessions as caution prevailed. China released mixed data at the beginning of the day, as May Industrial Production rose by 5.6% YoY, missing expectations, while Retail Sales in the same period were up 3.7%, beating estimates. The news fell short of boosting the market mood, which remained sour also during European trading hours amid political turmoil following far-right parties victory in the European Parlamentary election.
The optimistic tone of Wall Street, however, undermined demand for safe-haven assets. The US Dollar is down against most major rivals, while Gold loses ground against the USD. Firmer government bond yields add to XAU/USD slide, as the 10-year Treasury note offers 4.28%, up 7 basis points (bps), while the 2-year note yields 4.75%, also adding 7 bps.
Investors will now focus on Retail Sales, as the United States (US) will release May data on Tuesday. Sales are expected to have increased by a modest 0.2% in the month, improving from the previous 0% reading. The country will also release Industrial Production and Capacity Utilization for the same month.
The daily chart for XAU/USD shows a bearish 20 Simple Moving Average (SMA) that keeps attracting selling interest, providing dynamic resistance at around $2,340. The longer moving averages remain below the current level with bullish slopes, yet they are not close enough to be relevant. Finally, technical indicators aim lower within negative levels with limited downward momentum. Overall, the risk skews to the downside, yet the pair would need to pierce the June monthly low at 2,286.69 to signal a bearish continuation.
In the near term, and according to the 4-hour chart, XAU/USD is neutral-to-bearish. Gold trades below all its moving averages, although the 20 SMA is not far above the current level and flat, suggesting selling interest is limited. Technical indicators, in the meantime, turned marginally lower but remain within neutral levels.
Support levels: 2,298.10 2,286.70 2,271.90
Resistance levels: 2,321.55 2,333.10 2,340.00
Monday’s economic reports from China painted a mixed picture. Retail sales exceeded forecasts due to a holiday boost, but other key metrics, including industrial output and fixed-asset investment, indicated slower growth. Additionally, oil refining activity in China fell to its lowest rate this year due to maintenance shutdowns, raising concerns about the country’s overall demand for crude.
Global benchmark Brent crude futures were slightly up . West Texas Intermediate (WTI) crude futures edged higher. This performance comes after both benchmarks posted their first weekly gains in a month, driven by expectations of a significant drop in oil inventories with the onset of the summer driving season.
Last week, reports from OPEC and the International Energy Agency (IEA) provided some optimism, despite differing views on the strength of oil demand growth for the remainder of the year. OPEC’s forecast for robust demand in 2024 has faced skepticism due to its vested interests, while the IEA’s more conservative outlook suggests a need for strong economic recovery in China to sustain demand growth.
The recent drop in U.S. consumer sentiment to a seven-month low in June has also added a bearish sentiment to the market, raising doubts about the resilience of American consumer spending amid rising interest rates and cost-of-living pressures. Additionally, geopolitical tensions remain a concern, with potential for escalation in the Middle East following increased cross-border fire between Israel and Lebanon’s Hezbollah.
Given the current balance of positive and negative influences, the short-term outlook for oil prices remains cautiously bullish. The anticipated increase in demand from the summer driving season and potential inventory drawdowns support a positive trend. However, continued weak economic performance in China and global geopolitical risks could limit significant price advances. Traders should monitor Chinese economic data closely, as any signs of stronger recovery could provide further support for oil prices.
This week, data indicated a significant shift in U.S. inflation trends. Consumer prices were unchanged in May for the first time in nearly two years, and producer prices unexpectedly declined. Consequently, traders adjusted their expectations for interest rate cuts, now pricing in about 52 basis points of cuts by December, up from 37 basis points last week. This shift was primarily driven by softer inflation data, contrasting with earlier pessimism following a stronger-than-expected jobs report.
The Federal Reserve’s recent policy meeting, where it maintained current interest rates, showcased a median “dot plot” projecting just one quarter-point cut. Despite this conservative projection, the market’s reaction suggests a broader anticipation of monetary easing, enhancing gold’s attractiveness as a non-yielding asset.
European markets experienced volatility, particularly in France, due to political instability. This uncertainty, combined with cautious sentiment on Wall Street, has contributed to renewed interest in gold. Investors are increasingly seeking safe havens amidst geopolitical tensions in Europe and the Middle East, and significant central bank purchases, notably from China, are further supporting gold prices.
Spot gold is currently trading around $2,300 per ounce, after reaching a record high of $2,449.89 on May 20. The metal has gained over 11% year-to-date. Analysts point to strong physical demand and central bank purchases as key drivers. However, retail investment demand, such as from exchange-traded funds in the U.S., has yet to fully rebound.
Looking ahead, gold’s outlook remains bullish, although a climb to $3,000 per ounce appears unlikely in the short term. The fundamental case for gold is robust, supported by expectations of monetary easing and geopolitical uncertainties. Analysts foresee prices potentially reaching $2,600 to $2,700 per ounce this year, driven by continued central bank buying and safe-haven demand.
The upcoming weeks will be critical as investors seek clarity on the Federal Reserve’s interest rate decisions and monitor geopolitical developments. With the U.S. elections approaching and ongoing turmoil in Europe, additional market volatility is expected. While substantial gains have been made, surpassing the $3,000 mark would require a significant surge, given the substantial growth already witnessed this year.

Natural gas markets initially tried to rally on Friday but gave back gains as the 50 Day EMA has offered resistance. The market has been negative during the Friday session, and it looks as if the $7.00 level is going to offer a certain amount of support from a psychological and structural standpoint. If we do break down below the $7.00 level, then the market is likely to go looking to reach the $6.00 level underneath, which the 200 day EMA is currently trying to overcome.
If you have been watching these videos for the last several days, you know that I mentioned that the massive candlestick on Tuesday is the type of candlestick that rarely happens in a vacuum, therefore it’s likely that we will see more downward pressure. Ultimately, it’s not until we break above the $8.00 level that you have to look at this as a market that should show strength. Ultimately, I think we are in the midst of a major shakeup, and it is worth noting that the volatility had been getting strong over the last several weeks, so it’s not a huge surprise to see that we had broken down.
Whether or not we are going to melt down is a completely different question, so that being said I think that short-term traders will continue to short this market. If we break down below the $7.00 level, then I anticipate that pressure will pick up, and we will start to see a lot of momentum flow into this market to the downside. After all, this has been an extraordinarily crowded trade for some time.
For a look at all of today’s economic events, check out our economic calendar.
This article was originally posted on FX Empire
Hanoi (VNA) – The Ministry of Agriculture and Rural Development said that Vietnam’s coffee output in the 2023–2024 crop year is estimated to decrease by 20% compared to the previous crop year, to 1.47 million tonnes, the lowest in four years, putting pressure on Robusta supply in the world market.
Due to the impact of climate change, the dry season comes earlier than usual in Vietnam, and prolonged hot weather causes water levels at dams in some provinces to rapidly decrease. Fears that drought could affect crops have caused domestic coffee prices to increase sharply in the past week.
The price of coffee bean in the Central Highlands and southern provinces soared by 1,500 VND (0.059 USD) per kg, bringing the domestic purchase price of coffee bean to 114,500 – 116,000 VND per kg.
Over the past years, coffee prices were low, prompting many farmers to gradually switch to higher value crops. However, this year’s coffee prices are experiencing a record high, and it’s expected to be an opportunity to motivate farmers to restore coffee growing area.
According to the Ministry of Agriculture and Rural Development, Vietnam exported 756,000 tonnes of coffee, earning nearly 2.57 billion USD in the first four months of the year, up 5.4% in volume and 57.9% in value from the same period last year./.
Holiday money – where to buy it, how to avoid fees, and one thing you must not do
By Brad Young and Katie Williams, from the Money team
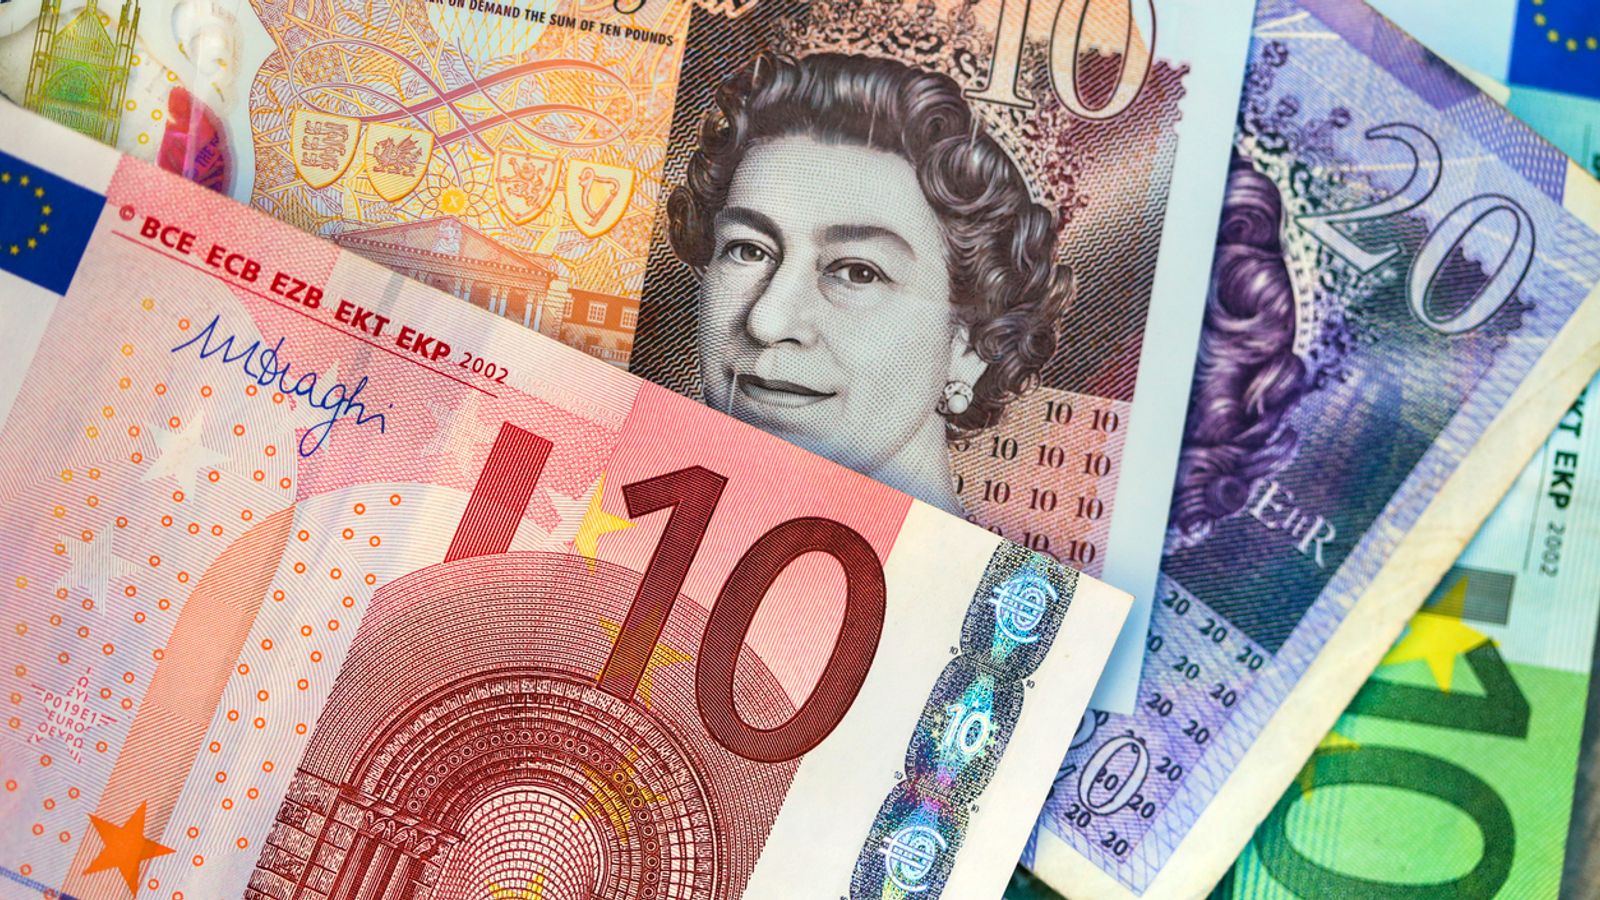
UK residents spend billions of pounds abroad each year, but it can be difficult to know how to make sterling go as far as possible.
With summer fast approaching, so too are the opportunities to splash out on holidays, so the Money team spoke with three travel experts to find out when, where and how to pay abroad.
CREDIT CARD
“The cheapest way to spend overseas is often on plastic, if you’ve got the right plastic,” said James Jones, head of consumer affairs at Experian.
“Using credit and debit cards can be a great way to get the very best exchange rates.”
He said rates offered by currency exchange shops are usually “much less attractive” than those offered on some cards, which were much closer to the rates the banks use themselves.
Fees could wipe out any gains
But it’s essential to be aware of things like non-sterling transaction fees, cash withdrawal fees and credit card interest.
So shop around for a card with travel rewards, Mr Jones said – and do this before your trip.
“You probably need to give yourself, ideally, six weeks.”
Extra protection
When you book a trip between £100 and £30,000, try and pay for some of it on a credit card to get “extra protection” under section 75 of the Consumer Credit Act, said Mr Jones.
That means the card provider is jointly responsible with the retailer if something goes wrong, such as arriving at a hotel only to find it has closed down.
If you are using a credit card, make sure you are can pay it off in full to avoid interest charges, said Sean Tipton from the Association of British Travel Agents (ABTA).
One trap you must not falling into
An increasingly common trap when paying with card (credit or debit) is being presented with the option to pay in the local currency or in pounds, said Mr Jones and Mr Tipton.
While paying in sterling might “seem like a wonderful convenience” you will ultimately be paying “quite a bit more for the purchase”, Mr Jones said.
If you pay in pounds, the local retailer’s bank sets the exchange rate, but if you pay in the local currency, your UK bank sets the rate.
DEBIT CARDS
“Some service providers don’t apply fees for overseas use on their regular UK debit cards,” says Moneyfacts – but you must always check as some incur big fees.
Alternatively, “some service providers offer specialist travel debit cards that don’t impose non-sterling transaction fees and cash withdrawal fees”.
PREPAID TRAVEL CARDS
If you’re looking to avoid a credit check, prepaid cards can be loaded with multiple currencies and work like a debit card, without being connected to your bank.
“Typically, prepaid travel cards will offer competitive or even no charges for foreign usage, which can make them a cheaper alternative to using a normal credit or debit card while on holiday,” says MoneyFacts.
One of the most popular prepaid cards, Revolut, uses its own exchange rates, which might not always be the best you can find – and while it is fee free on weekdays, there are charges at weekends, so do your research.
Also be aware – prepaid cards do not offer purchase protection like a credit card and aren’t regulated by the Financial Conduct Authority.
CASH
“Don’t rely solely on a card – it can backfire on you if you do,” said Mr Tipton.
Some taxis only take cash, leaving you to face hefty charges withdrawing from an ATM.
In some countries, like Argentina, it can be difficult to get money out of ATMs without a local bank account, Mr Tipton said.
Mr Jones added: “If you’re in a very remote part of the world that actually doesn’t have many ATMs and maybe where cash is king, then that might dictate what you need to do.”
Where and when to get cash
“I’d strongly recommend [to] get some cash out in the UK,” said Mr Tipton.
It can be difficult to find a bureau de change in some developing nations, and ATMs have “started introducing quite hefty charges” across the board, he said.
The exceptions are countries with really high inflation rates, where it may make more sense to get cash out when you arrive, he added.
When to exchange currency really depends on the destination, said Laura Plunkett, head of travel money at the Post Office.
“Exchange rates change frequently, so if you have time, do your homework and lock in a rate when it is good.”
What is a good exchange rate for Europe?
Some 80% of British holidays abroad take place in the Eurozone, said Mr Tipton.
The rate has remained “fairly stable”, but if you see the pound increasing in value that may be the time to buy a larger amount of Euros for a couple of years in advance, he added.
Mr Tipton said 1.2 to the pound is a “pretty healthy” time to buy, but “it is a bit of a lottery”.
Every year the pound gets stronger against the South African rand, and the same in Argentina, where the peso is “unbelievably weak”, Mr Tipton suggested.
In store or online?
“Most online suppliers will insist on a minimum order value that might be too high for some people, and you’ll have to make sure that you’re home for when it’s delivered,” said Ms Plunkett.
“But typically, rates are better online if that’s an option for you.”
Holiday money – where to buy it, how to avoid fees, and one thing you must not do
By Brad Young and Katie Williams, from the Money team
UK residents spend billions of pounds abroad each year, but it can be difficult to know how to make sterling go as far as possible.
With summer fast approaching, so too are the opportunities to splash out on holidays, so the Money team spoke with three travel experts to find out when, where and how to pay abroad.
CREDIT CARD
“The cheapest way to spend overseas is often on plastic, if you’ve got the right plastic,” said James Jones, head of consumer affairs at Experian.
“Using credit and debit cards can be a great way to get the very best exchange rates.”
He said rates offered by currency exchange shops are usually “much less attractive” than those offered on some cards, which were much closer to the rates the banks use themselves.
Fees could wipe out any gains
But it’s essential to be aware of things like non-sterling transaction fees, cash withdrawal fees and credit card interest.
So shop around for a card with travel rewards, Mr Jones said – and do this before your trip.
“You probably need to give yourself, ideally, six weeks.”
Extra protection
When you book a trip between £100 and £30,000, try and pay for some of it on a credit card to get “extra protection” under section 75 of the Consumer Credit Act, said Mr Jones.
That means the card provider is jointly responsible with the retailer if something goes wrong, such as arriving at a hotel only to find it has closed down.
If you are using a credit card, make sure you are can pay it off in full to avoid interest charges, said Sean Tipton from the Association of British Travel Agents (ABTA).
One trap you must not falling into
An increasingly common trap when paying with card (credit or debit) is being presented with the option to pay in the local currency or in pounds, said Mr Jones and Mr Tipton.
While paying in sterling might “seem like a wonderful convenience” you will ultimately be paying “quite a bit more for the purchase”, Mr Jones said.
If you pay in pounds, the local retailer’s bank sets the exchange rate, but if you pay in the local currency, your UK bank sets the rate.
DEBIT CARDS
“Some service providers don’t apply fees for overseas use on their regular UK debit cards,” says Moneyfacts – but you must always check as some incur big fees.
Alternatively, “some service providers offer specialist travel debit cards that don’t impose non-sterling transaction fees and cash withdrawal fees”.
PREPAID TRAVEL CARDS
If you’re looking to avoid a credit check, prepaid cards can be loaded with multiple currencies and work like a debit card, without being connected to your bank.
“Typically, prepaid travel cards will offer competitive or even no charges for foreign usage, which can make them a cheaper alternative to using a normal credit or debit card while on holiday,” says MoneyFacts.
One of the most popular prepaid cards, Revolut, uses its own exchange rates, which might not always be the best you can find – and while it is fee free on weekdays, there are charges at weekends, so do your research.
Also be aware – prepaid cards do not offer purchase protection like a credit card and aren’t regulated by the Financial Conduct Authority.
CASH
“Don’t rely solely on a card – it can backfire on you if you do,” said Mr Tipton.
Some taxis only take cash, leaving you to face hefty charges withdrawing from an ATM.
In some countries, like Argentina, it can be difficult to get money out of ATMs without a local bank account, Mr Tipton said.
Mr Jones added: “If you’re in a very remote part of the world that actually doesn’t have many ATMs and maybe where cash is king, then that might dictate what you need to do.”
Where and when to get cash
“I’d strongly recommend [to] get some cash out in the UK,” said Mr Tipton.
It can be difficult to find a bureau de change in some developing nations, and ATMs have “started introducing quite hefty charges” across the board, he said.
The exceptions are countries with really high inflation rates, where it may make more sense to get cash out when you arrive, he added.
When to exchange currency really depends on the destination, said Laura Plunkett, head of travel money at the Post Office.
“Exchange rates change frequently, so if you have time, do your homework and lock in a rate when it is good.”
What is a good exchange rate for Europe?
Some 80% of British holidays abroad take place in the Eurozone, said Mr Tipton.
The rate has remained “fairly stable”, but if you see the pound increasing in value that may be the time to buy a larger amount of Euros for a couple of years in advance, he added.
Mr Tipton said 1.2 to the pound is a “pretty healthy” time to buy, but “it is a bit of a lottery”.
Every year the pound gets stronger against the South African rand, and the same in Argentina, where the peso is “unbelievably weak”, Mr Tipton suggested.
In store or online?
“Most online suppliers will insist on a minimum order value that might be too high for some people, and you’ll have to make sure that you’re home for when it’s delivered,” said Ms Plunkett.
“But typically, rates are better online if that’s an option for you.”
The next area to watch for support activity is around the uptrend line and it was reached today. But if the line fails to hold the next lower price zone is around 2.84 to 2.82, consisting of a crossover of two trendlines and the 50% retracement, respectively. The uptrend line is a relatively short-term line having defined support of the rising trend starting from the April swing low of 1.58. It is used as a guide and is not so reliable without confirming evidence.
Given that the angle of ascent has been relatively steep, an adjustment to a lower slope angle would be common and healthy for the trend. Rising trends that start steep will eventually reach a point where demand can no longer support the price momentum and they will adjust to a lower slope. Alternatively, uptrends that start with a low slope angle typically see the angle increase as the trend progresses. Frequently, there are three angles that might be observed in either scenario.
What about the weekly time frame? The weekly chart is about to close the week with a bearish shooting star pattern. But before being alarmed notice that three weeks ago ended with a similar candlestick pattern. It was followed by a resumption of the uptrend after a brief drop below the bearish week. That was followed by a three-week continuation of the uptrend until this week’s high of 3.16.
The breakout of the bull pennant just got started and if it follows through it projects an initial target up to 3.78. That target is above the 2023 high of 3.64. Nonetheless, the main point is that there looks to be more upside in natural gas for the current trend. The target may be reached or not, but it is supportive of a continuation higher above this week’s high once the retracement is complete.
For a look at all of today’s economic events, check out our economic calendar.