The main tag of GoldPrice Articles.
You can use the search box below to find what you need.
[wd_asp id=1]
The main tag of GoldPrice Articles.
You can use the search box below to find what you need.
[wd_asp id=1]
U.S. natural gas production ramped up as summer approached, causing downward pressure on prices. Analysts at Tudor Pickering Holt & Co. highlighted that producers were gearing up for higher summer demand, contributing to market concerns over increased supply.
The U.S. Energy Information Administration (EIA) reported an 84 billion cubic feet (Bcf) increase in inventories for the week ending May 24, surpassing the consensus estimate of 77 Bcf. Total stocks stood at 2795 Bcf, significantly above the five-year average, further exacerbating the oversupply issue.
Weather patterns played a critical role in shaping demand expectations. NatGasWeather predicted very warm to hot conditions in the southern U.S. and California, with temperatures ranging from the mid-80s to 100s in desert areas. However, the northern U.S. experienced milder temperatures, which tempered overall demand. Despite these conditions, national demand for natural gas was projected to remain robust due to the high temperatures in key regions.
The natural gas market saw increased daily volatility, with price movements expanding to a 10-20 cent range per day, compared to a more stable 10-cent range in previous months. This heightened volatility added uncertainty to market direction. At times, natural gas futures rallied due to higher demand forecasts and increased LNG export activity, however, these gains were short-lived as trader focus returned to uncertain weather and production increases
Natural gas production in the Lower 48 states averaged 97.7 billion cubic feet per day (bcfd) in May, slightly down from April’s 98.2 bcfd. Despite the monthly decline, daily output increased by 1.5 bcfd since early May. The rise in futures prices encouraged some drillers to ramp up production, though overall production remained down about 8% year-over-year due to delayed well completions and reduced drilling activities.
LNG export activity increased, with gas flows to export plants rising from 11.9 bcfd in April to 12.7 bcfd in May, largely due to the resumption of operations at Freeport LNG’s plant in Texas. However, exports remained below the December 2023 record of 14.7 bcfd due to ongoing maintenance at various facilities.
The gold price (XAU/USD) retreated to the $2,330s, reversing the gains made after the release of US Personal Consumption Expenditure (PCE) data for April.
The PCE, the Federal Reserve’s preferred inflation gauge, showed core price pressures cooling to 0.2% month-over-month, down from 0.3%, according to the Bureau of Economic Analysis. Analysts had anticipated Core PCE to remain steady at 0.3%.
While the broader PCE data aligned with expectations, the unexpected drop in Core PCE indicated that inflation in the US is cooling faster than predicted. This scenario has heightened the probability of the Federal Reserve cutting interest rates sooner rather than later.
Lower interest rates generally favour gold by reducing the opportunity cost of holding the non-yielding asset, which explains the precious metal’s rise post-data release.
Gold experienced a recovery starting Thursday, following the release of weaker US growth data. The second estimate of US first-quarter GDP growth was revised down to an annualized 1.3% from the initial estimate of 1.6%.
The slower growth stemmed from reduced consumer spending, which is expected to keep inflation in check and the Federal Reserve on course to lower interest rates.
Consequently, the yield on the US 10-year Treasury Note dropped to 4.55% from a four-week high of 4.63%. Despite these developments, gold prices began to pull back as the weekend approached, with potential to end the day in negative territory.
According to the CME FedWatch Tool, the chances of the Fed cutting interest rates before September are low, but the probability stands at 55% for a rate cut in September.
US interest rate expectations are not the sole factor influencing the gold price. According to Daniel Ghali, a Senior Commodity Strategist at TD Securities, gold demand is also driven by Asian buyers using the metal as a hedge against their depreciating currencies relative to a strengthening US Dollar (USD).
“Precious metals are acting as a currency depreciation hedge. Case in point: fund flows into Chinese gold ETFs are rising once more at their fastest pace since the massive buying activity observed in April. US yields are surging, the dollar broke out of its lull, and yet precious metals prices have remained extremely resilient,” Ghali notes.
This trend suggests that the strength of the US Dollar may not negatively impact gold prices as much as it has historically. Consequently, gold prices could remain resilient even if the USD appreciates.
The upcoming week features several key economic events that could significantly impact the price of gold:
Gold spot prices closed trading around $2,327.60, slightly below the pivot point at $2,352.75. The immediate resistance level stands at $2,350.36, followed by $2,366.51 and $2,379.32.
On the support side, the immediate level is $2,324.79, with further support at $2,307.40 and $2,291.54.
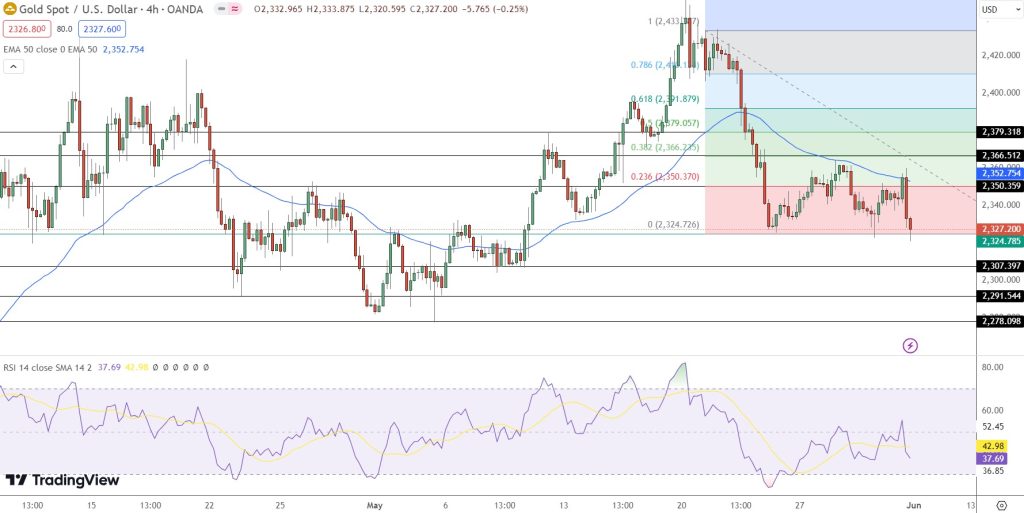
However, the current price is below the 50-day Exponential Moving Average (EMA) of $2,352.75, pointing to a bearish sentiment in the market. As gold navigates these critical levels, traders should monitor these support and resistance points closely.
September natural gas futures settled at $2.914, down $0.017 or -0.58%.
Meteorologists forecast temperatures during the month of August will come in near average after a warmer-than-normal June and July.
Natgasweather.com says: “While weather patterns have been hot the past couple weeks over much of the country, this coming weekend a weather system and accompanied cool shot will sweep down the East Coast with showers. This will bring mostly comfortable conditions over the east-central U.S. for lighter demand. It will still be hot over the West, Central, and South, but national demand will drop to more seasonal levels without hot conditions over the East.
This likely means natural gas demand will be down this week because the cooler weather will be hitting highly populated, high demand areas.

Natural gas prices are likely to continue under pressure on Thursday unless the storage number comes in better than expected. However, just like last week’s report and subsequent price action, any rallies are likely to be met with a wall of sellers.
The current daily chart pattern indicates there are multiple levels of potential resistance at $2.934, $2.966, $2.984 and $3.011. Although aggressive counter-trend buyers have been trying to sustain a series of higher bottoms at $2.800, $2.830 and $2.866, the buying doesn’t seem to be strong enough at this time to sustain a rally and change the trend to up.
As far as the U.S. Energy Information Administration’s weekly storage report is concerned, traders should look for a 34 billion cubic feet build for the week-ending July 21. This would put inventories about 4 percent above normal for this time of year. This will compare with a 20 bcf increase the same week a year earlier and a five-year average build of 47 bcf.
The key price level on the chart to watch is $2.934. A sustained move over this level will likely lead to a labored rally. A sustained move under this level will indicate the presence of sellers.
This article was originally posted on FX Empire
Gold (XAU/USD) has enjoyed a remarkable rally this year, peaking near $2,450 in early May. However, the upward impetus has recently started to wane, with bullion retreating over 4% from its highs in the past few trading sessions. This price correction suggests a shift in investor sentiment, with bulls likely seeking greener pastures.
With underlying and fundamental drivers reasserting themselves, gold’s weakness could persist in the near term. Sticky inflation, which could force the U.S. central bank to maintain a restrictive stance for longer, could reinforce the bearish case for non-yielding assets, creating a hostile environment for the yellow metal.
Acquire the knowledge needed for maintaining trading consistency. Grab your “How to Trade Gold” guide for invaluable insights and tips!
Recommended by Diego Colman
How to Trade Gold
For traders entertaining short positions, a crucial price point to watch is the $2,335 support zone. This area represents a confluence of technical indicators, including a key trendline and the 38.2% Fibonacci retracement of the March-May rally. A decisive break below $2,335, accompanied by higher-than-average trading volume, would be a strong selling signal.
If the price falls through $2,335, the next line in the sand is the 50-day simple moving average, currently sitting at $2,325. Breaching this support could trigger a deeper pullback, with potential downside targets around $2,265, a critical Fibonacci level just below this month’s swing low.
However, the scenario isn’t entirely one-sided. If the bulls regain control and push prices higher, initial resistance looms at $2,365, followed by $2,377. A push past this latter ceiling could dampen bearish sentiment and pave the way for a rally toward $2,420. Continued strength could even bring the all-time high back into play.
Wondering about gold’s future trajectory and the catalysts that will drive volatility? Find all the answers in our free quarterly forecast. Download it now!
Recommended by Diego Colman
Get Your Free Gold Forecast
Today’s low is a higher low than the recent swing low at 2.475, a very minor sign of strength as it is not known whether it will remain a low. Also, the short-term 20-Day MA has started to cross above the long-term 200-Day MA today. This is another sign of strength. Potential support around the moving averages therefore is critical for the sustainability of the rally. The 200-Day line is now at 2.455 and the 20-Day line is at 2.47.
A decisive decline below the recent swing low and moving averages will signal a deeper retracement. Depending on when it happens, a double top may also be triggered. This week’s high would create the second top. However, the double top is just a possibility until a breakdown triggers. At that point an eventual test of support around the 50-Day MA, now at 2.06, is a possible target. Higher price areas to watch for support include the area around the 50% retracement at 2.25 and further down is the 61.8% Fibonacci retracement around 2.10. Notice that the 20-Day MA has not been tested as support since the gap up on April 26.
An alternative scenario may see the price of natural gas further consolidate above the 200-Day MA. Initial resistance would be around the blue dashed downtrend line. Since it is a declining line the price level represented will be falling over time. Subsequently, if the 200-Day line remains an area of support the price range would be narrowing.
The weekly chart should also be watched. Both last week and this week have large topping tails and the candlestick patterns are bearish shooting stars. Last week’s low of 2.49 was broken to the downside earlier this week but natural gas quickly recovered and is set to close above that low this week. Nevertheless, these are bearish indications but only if there is a decisive drop below the weekly lows.
For a look at all of today’s economic events, check out our economic calendar.
I know I’m not supposed to say this, but quite frankly natural gas markets are not a retail market. You have no business trading this but since I know many of you will do it anyway, I will do my best to break down what you are facing. We got overextended and now we need to find some type of natural level to sit. In other words, it’s overbought and now we need to correct.

That being said, you also have to understand weather patterns in the northeastern part of the United States, whether or not the Europeans are going to be coming to Henry in Louisiana to buy more natural gas, as this is the contract you are more likely than not trading, and whether or not storage and transmission lines allow for more or less supply. This is literally what your trading.
However, my email box is almost always full of questions about natural gas, so I am cognizant of the fact that a lot of people are trading it. At this point, I would anticipate that natural gas could very well fall to the $2 region, and I do think that it would be of value there. However, if you follow my work you know that I very rarely trade this with a lot of leverage, but do in fact trade it via an ETF. This allows me to take advantage of price appreciation or the depreciation, but not doing so with a ton of leverage. It’s the leverage that seems to get most people in trouble.
If you have the ability to invest and not trade, this could be a great market, but right now I just don’t see why would put a lot of money into this market try to “catch a falling knife.”
Ready to trade FX Natural Gas? Here are the best commodity trading brokers to choose from.
You have reached your limit of 5 free articles for this month.
Access all our articles, insights, and analysts.
Your coupon code
Spot Gold is little changed on Thursday, trading around its daily opening in the $2,340 price zone. XAU/USD extended its weekly slide to $2,322.50 during Asian trading hours, grinding higher afterwards amid a slight improvement in the market’s sentiment. The advance extended up to $2,351.72 with the release of dismal United States (US) data.
The US Bureau of Economic Analysis (BEA) reported that the country’s Gross Domestic Product (GDP) expanded at an annual rate of 1.3% in the first quarter, downwardly revising the previous estimate of 1.6%. Furthermore, Initial Jobless Claims in the week ended May 24 increased to 219K, worse than the 218K expected, while the preliminary estimate of April Wholesale Inventories increased by 0.2%, worse than the 0.1% decline anticipated.
Wall Street came under selling pressure, with the three major indexes trading in the red. At the same time, Treasury yields retreated, limiting USD strength against the bright metal. The 10-year note currently offers 4.54%, down 7 basis points (bps), while the 2-year note yields 4.92%, shedding 5 bps.
Market participants are now waiting for fresh US inflation data, which will be released on Friday. The country will publish the April Personal Consumption Expenditures (PCE) Price Index, which is foreseen at 2.7% YoY, matching March figures. The core annual reading is also expected to remain unchanged at 2.8%.
XAU/USD is weak, according to technical readings in the daily chart. Technical indicators stand within neutral levels with modest downward slopes, not enough to suggest an upcoming directional movement. At the same time, a flat 20 Simple Moving Average (SMA) caps the upside at around $2,355.50, while the 100 and 200 SMAs maintain their upward slopes well below the current level.
In the near term, and according to the 4-hour chart, XAU/USD is neutral. Technical indicators stalled their advances around their midlines while the pair remains below directionless moving averages. The weekly high at around 2,364.00 is the level to surpass for bulls to retake control of the pair.
Support levels: 2,334.35 2,325.30 2,307.10
Resistance levels: 2,355.50 2,364.00 2,372.90
Spot Gold is little changed on Thursday, trading around its daily opening in the $2,340 price zone. XAU/USD extended its weekly slide to $2,322.50 during Asian trading hours, grinding higher afterwards amid a slight improvement in the market’s sentiment. The advance extended up to $2,351.72 with the release of dismal United States (US) data.
The US Bureau of Economic Analysis (BEA) reported that the country’s Gross Domestic Product (GDP) expanded at an annual rate of 1.3% in the first quarter, downwardly revising the previous estimate of 1.6%. Furthermore, Initial Jobless Claims in the week ended May 24 increased to 219K, worse than the 218K expected, while the preliminary estimate of April Wholesale Inventories increased by 0.2%, worse than the 0.1% decline anticipated.
Wall Street came under selling pressure, with the three major indexes trading in the red. At the same time, Treasury yields retreated, limiting USD strength against the bright metal. The 10-year note currently offers 4.54%, down 7 basis points (bps), while the 2-year note yields 4.92%, shedding 5 bps.
Market participants are now waiting for fresh US inflation data, which will be released on Friday. The country will publish the April Personal Consumption Expenditures (PCE) Price Index, which is foreseen at 2.7% YoY, matching March figures. The core annual reading is also expected to remain unchanged at 2.8%.
XAU/USD is weak, according to technical readings in the daily chart. Technical indicators stand within neutral levels with modest downward slopes, not enough to suggest an upcoming directional movement. At the same time, a flat 20 Simple Moving Average (SMA) caps the upside at around $2,355.50, while the 100 and 200 SMAs maintain their upward slopes well below the current level.
In the near term, and according to the 4-hour chart, XAU/USD is neutral. Technical indicators stalled their advances around their midlines while the pair remains below directionless moving averages. The weekly high at around 2,364.00 is the level to surpass for bulls to retake control of the pair.
Support levels: 2,334.35 2,325.30 2,307.10
Resistance levels: 2,355.50 2,364.00 2,372.90
Both benchmarks are headed for monthly losses. Brent futures are on track for a decline of over 5% from the previous month, while WTI is set to drop by more than 3%. This downturn reflects a broader risk-off environment that has exerted downward pressure on oil prices, overshadowing a larger-than-expected drawdown in U.S. crude inventories reported by the American Petroleum Institute (API).
According to API data released on Wednesday, U.S. crude oil and gasoline inventories fell last week, while distillate stocks rose. Crude stocks were reported down by 6.49 million barrels for the week ending May 24, surpassing analysts’ expectations of a 1.9 million barrel decrease. Gasoline inventories decreased by 452,000 barrels, and distillate stocks increased by 2.045 million barrels, contrasting with projections of a 1 million barrel draw in gasoline and a 400,000 barrel build in distillates.
Rising global oil inventories through April due to subdued fuel demand may bolster the case for OPEC+ to maintain supply cuts. OPEC+ producers, including the Organization of the Petroleum Exporting Countries (OPEC) and allies like Russia, are set to meet on June 2. Analysts and delegates suggest that current production cuts might be extended until the end of the third quarter to support prices.
Oil markets have been pressured by expectations that the Federal Reserve will maintain higher interest rates for an extended period. Brent crude settled at its lowest in over three months on May 23. A recent Fed survey indicated that U.S. economic activity continued to expand from early April to mid-May, albeit with growing pessimism about the future and modest inflation increases. Higher borrowing costs typically restrict funds and consumption, negatively affecting crude demand and prices. Market expectations now suggest that the Fed may not cut rates until September, rather than the previously anticipated June.
Given the persistent pressure from high borrowing costs and potential extensions of OPEC+ production cuts, the short-term outlook for oil prices remains bearish. Traders should prepare for continued volatility, with potential support levels being tested as market trends evolve.
Spot Gold is little changed on Thursday, trading around its daily opening in the $2,340 price zone. XAU/USD extended its weekly slide to $2,322.50 during Asian trading hours, grinding higher afterwards amid a slight improvement in the market’s sentiment. The advance extended up to $2,351.72 with the release of dismal United States (US) data.
The US Bureau of Economic Analysis (BEA) reported that the country’s Gross Domestic Product (GDP) expanded at an annual rate of 1.3% in the first quarter, downwardly revising the previous estimate of 1.6%. Furthermore, Initial Jobless Claims in the week ended May 24 increased to 219K, worse than the 218K expected, while the preliminary estimate of April Wholesale Inventories increased by 0.2%, worse than the 0.1% decline anticipated.
Wall Street came under selling pressure, with the three major indexes trading in the red. At the same time, Treasury yields retreated, limiting USD strength against the bright metal. The 10-year note currently offers 4.54%, down 7 basis points (bps), while the 2-year note yields 4.92%, shedding 5 bps.
Market participants are now waiting for fresh US inflation data, which will be released on Friday. The country will publish the April Personal Consumption Expenditures (PCE) Price Index, which is foreseen at 2.7% YoY, matching March figures. The core annual reading is also expected to remain unchanged at 2.8%.
XAU/USD is weak, according to technical readings in the daily chart. Technical indicators stand within neutral levels with modest downward slopes, not enough to suggest an upcoming directional movement. At the same time, a flat 20 Simple Moving Average (SMA) caps the upside at around $2,355.50, while the 100 and 200 SMAs maintain their upward slopes well below the current level.
In the near term, and according to the 4-hour chart, XAU/USD is neutral. Technical indicators stalled their advances around their midlines while the pair remains below directionless moving averages. The weekly high at around 2,364.00 is the level to surpass for bulls to retake control of the pair.
Support levels: 2,334.35 2,325.30 2,307.10
Resistance levels: 2,355.50 2,364.00 2,372.90