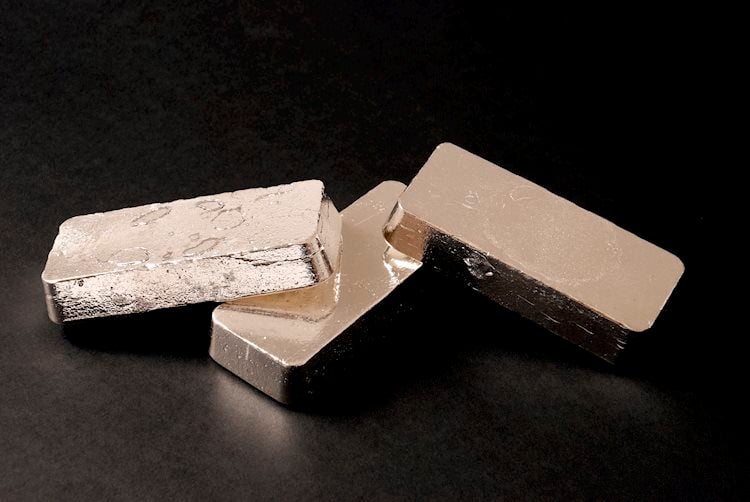
The main tag of GoldPrice Articles.
You can use the search box below to find what you need.
[wd_asp id=1]
The main tag of GoldPrice Articles.
You can use the search box below to find what you need.
[wd_asp id=1]
Marginally lower crude, gasoline prices expected in rest of 2024
Agency cuts 2025 crude price outlook by $6.50/b for WTI, Brent
Expects dip in global liquid fuels demand, higher US output in 2025
The US Energy Information Administration Oct. 8 lowered its 2024 crude price forecasts by nearly $2/b, and by $6.50/b for 2025, as concerns over global demand growth outweighed the short-term uncertainty of potentially disruptive escalation between Israel and Iran in the Middle East.
Receive daily email alerts, subscriber notes & personalize your experience.
Concerns over global oil demand growth should cause oil prices to remain lower in 2024 and 2025 than previously forecast, the agency said in its October Short-Term Energy Outlook.
The EIA cut its 2024 forecast for Brent crude by $1.91 to $80.89/b. Citing a $6/b September drop in prices, the EIA also reduced its 2025 Brent outlook by $6.50 to $77.59/b. The agency forecast WTI crude down $1.89 from last month’s estimate for the year, while it lowered by $6.50 its expectation for 2025 to $73.13/b.
“Following the September drop in prices and our expectation that oil demand growth will be lower next year than we had previously forecast, we have lowered our forecast for crude oil prices despite increasing oil prices in early October,” the agency wrote in its outlook. “No oil supplies have been affected by increased military action in the Middle East at the time of STEO publication, and we do not assume any disruption in our forecast. However, the conflict has escalated in recent weeks with no timeline for a potential resolution, increasing the possibility for supply disruptions and price volatility. At the same time, we assess that significant surplus crude oil production capacity is available, which could be brought online in the event of a disruption.”
Thanks to OPEC+ production cuts, less oil is still being produced globally than consumed, and oil is being withdrawn from inventories, the EIA said, estimating global oil inventories fell by 800,000 b/d in the third quarter of 2024. It projected inventories to fall by 600,000 b/d in the first quarter of 2025, fueling its expectation of an increase in current Brent prices, albeit a smaller one than EIA forecast in September.
“By the middle of next year, we anticipate accelerated growth in oil production as OPEC+ increases its production and as production continues to grow in the United States, Guyana, Brazil and Canada,” EIA said.
In September, the EIA continued to lower its forecast of global consumption of liquid fuels, thanks in large part to ongoing reductions in China’s crude oil imports and refinery runs. The EIA cited recent monetary stimulus that could spur economic growth and greater crude demand in the country, but said it kept its China’s expected 2025 growth rate largely unchanged in October.
The agency nudged down its global oil demand outlook by 40,000 b/d for 2024 to 103.06 million b/d, and its 2025 estimate down 250,000 b/d, at 104.35 million b/d.

The lower crude oil forecast pulled down expected US retail gasoline prices. While the EIA maintained its previous expectation of $3.33/gal in the rest of 2024, it saw gasoline prices declining to an average of $3.22/gal in 2025, down 7 cents from last month’s estimate.
The EIA also raised its expectations for 2025 retail diesel prices, putting the fuel at $3.55/gal next year, down 18 cents from the prior estimate. It expects diesel to remain steady in 2024, averaging $3.76/gal, down just 2 cents from its September estimate.
The EIA reduced its 2024 outlook for US oil production by 30,000 b/d to 13.22 million b/d, though it still expects output growth to continue into 2025 to put US crude production at 13.54 million b/d, a 130,000 b/d drop from last month’s estimate driven by a minor expected slowdown in US exploration and production activity, based on recent industry survey results.
This month, the agency also published its 2024 Winter Fuels Outlook, comprising its annual expectations for US residential energy consumption, prices and expenditures during the winter months, sources of which include natural gas, propane and heating oil alongside electricity. The EIA projected those costs to remain broadly level from last winter, with declining energy prices offsetting predictions of colder weather.
Silver (XAG/USD) lacks any firm intraday direction on Thursday and oscillates in a narrow trading band around mid-$30.00s through the first half of the European session. The white metal remains within the striking distance of a nearly three-week low touched on Tuesday and seems vulnerable to prolonging its rejection slide from the $33.0 neighborhood, or the highest level since December 2012 set last week.
The recent repeated failures to capitalize on momentum beyond the $32.00 mark constitute the formation of a bearish multiple-tops on the daily chart. Moreover, oscillators on the daily chart have started gaining negative traction and add credence to the near-term bearish outlook for the XAG/USD. That said, it will still be prudent to wait for a sustained break and acceptance below the $30.00 psychological mark before positioning for any further depreciating move.
The subsequent downfall could drag the XAG/USD to the $29.75-$29.60 confluence support – comprising the 100-day Simple Moving Average (SMA) and the 50-day SMA. A convincing break below the latter should pave the way for a fall towards the $29.00 mark en route to the next relevant support near the $28.60-$28.50 zone.
On the flip side, any attempted positive move now seems to confront resistance near the $31.00 horizontal support breakpoint. Some follow-through buying, however, might trigger a short-covering rally and allow the XAG/USD to reclaim the $32.00 mark, with some intermediate hurdle near the $31.55 area and the $31.75-$31.80 region. The momentum could extend further towards the $32.25 supply zone en route to the multi-year peak, just ahead of the $33.00 round figure.
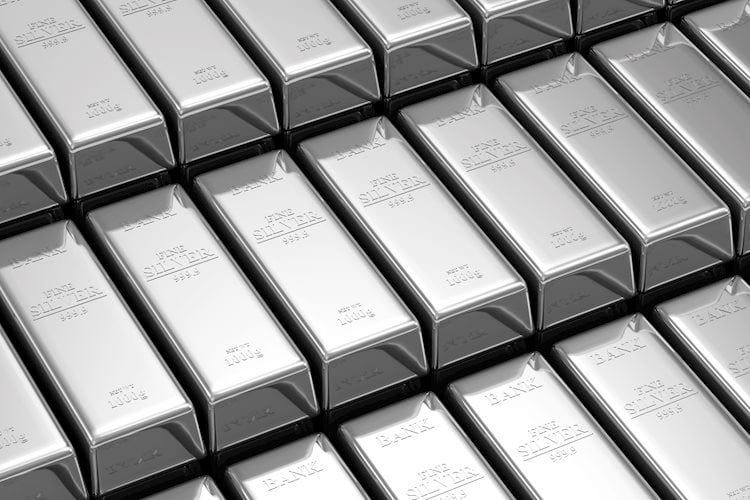
Silver is a precious metal highly traded among investors. It has been historically used as a store of value and a medium of exchange. Although less popular than Gold, traders may turn to Silver to diversify their investment portfolio, for its intrinsic value or as a potential hedge during high-inflation periods. Investors can buy physical Silver, in coins or in bars, or trade it through vehicles such as Exchange Traded Funds, which track its price on international markets.
Silver prices can move due to a wide range of factors. Geopolitical instability or fears of a deep recession can make Silver price escalate due to its safe-haven status, although to a lesser extent than Gold’s. As a yieldless asset, Silver tends to rise with lower interest rates. Its moves also depend on how the US Dollar (USD) behaves as the asset is priced in dollars (XAG/USD). A strong Dollar tends to keep the price of Silver at bay, whereas a weaker Dollar is likely to propel prices up. Other factors such as investment demand, mining supply – Silver is much more abundant than Gold – and recycling rates can also affect prices.
Silver is widely used in industry, particularly in sectors such as electronics or solar energy, as it has one of the highest electric conductivity of all metals – more than Copper and Gold. A surge in demand can increase prices, while a decline tends to lower them. Dynamics in the US, Chinese and Indian economies can also contribute to price swings: for the US and particularly China, their big industrial sectors use Silver in various processes; in India, consumers’ demand for the precious metal for jewellery also plays a key role in setting prices.
Silver prices tend to follow Gold’s moves. When Gold prices rise, Silver typically follows suit, as their status as safe-haven assets is similar. The Gold/Silver ratio, which shows the number of ounces of Silver needed to equal the value of one ounce of Gold, may help to determine the relative valuation between both metals. Some investors may consider a high ratio as an indicator that Silver is undervalued, or Gold is overvalued. On the contrary, a low ratio might suggest that Gold is undervalued relative to Silver.
Silver price (XAG/USD) strengthens and jumps to near $31.00 in Thursday’s North American session. The white metal witnessed strong buying interest after the release of the United States (US) Consumer Price Index (CPI) data for September.
The CPI report showed that Inflationary pressures grew at a faster-than-expected pace due to a sharp increase in prices of apparel. Also, medical and transportation services became more expensive.
The annual headline inflation decelerated at a slower-than-projected pace to 2.4% from 2.5% in August as the impact of a sharp decline in the cost of energy was offset by a rise in food prices. Economists estimated the headline inflation to have grown by 2.3%. The core CPI – which strips off volatile food and energy prices – accelerated to 3.3% from the estimates and the former release of 3.2%. The monthly headline and core inflation grew faster than projected.
The white metal struggles for direction as market participants are taking time to digest inflationary figures and adjust expectations for the Federal Reserve (Fed) interest rate outlook for the remaining year. According to the CME FedWatch tool, a 25-basis points (bps) rate cut in November is highly expected.
Meanwhile, the US Dollar (USD) is also displaying volatile moves after the US inflation data release. Going forward, investors will focus on the US Producer Price Index (PPI) data for September, which will be published on Friday.
Silver price weakens after a breakdown of the Double Top formation on a four-hour timeframe. The above-mentioned pattern was activated after the asset broke below the horizontal support plotted from the September 30 low around $31.00, which acts as a resistance now. A bear cross, represented by the 20- and 50-period Exponential Moving Averages (EMAs) at $31.60, suggests weakness ahead.
The asset has temporarily found support near the 200 EMA, which trades around $30.50.
The 14-day Relative Strength Index (RSI) has delivered a range shift move, suggesting a bearish momentum.
Silver is a precious metal highly traded among investors. It has been historically used as a store of value and a medium of exchange. Although less popular than Gold, traders may turn to Silver to diversify their investment portfolio, for its intrinsic value or as a potential hedge during high-inflation periods. Investors can buy physical Silver, in coins or in bars, or trade it through vehicles such as Exchange Traded Funds, which track its price on international markets.
Silver prices can move due to a wide range of factors. Geopolitical instability or fears of a deep recession can make Silver price escalate due to its safe-haven status, although to a lesser extent than Gold’s. As a yieldless asset, Silver tends to rise with lower interest rates. Its moves also depend on how the US Dollar (USD) behaves as the asset is priced in dollars (XAG/USD). A strong Dollar tends to keep the price of Silver at bay, whereas a weaker Dollar is likely to propel prices up. Other factors such as investment demand, mining supply – Silver is much more abundant than Gold – and recycling rates can also affect prices.
Silver is widely used in industry, particularly in sectors such as electronics or solar energy, as it has one of the highest electric conductivity of all metals – more than Copper and Gold. A surge in demand can increase prices, while a decline tends to lower them. Dynamics in the US, Chinese and Indian economies can also contribute to price swings: for the US and particularly China, their big industrial sectors use Silver in various processes; in India, consumers’ demand for the precious metal for jewellery also plays a key role in setting prices.
Silver prices tend to follow Gold’s moves. When Gold prices rise, Silver typically follows suit, as their status as safe-haven assets is similar. The Gold/Silver ratio, which shows the number of ounces of Silver needed to equal the value of one ounce of Gold, may help to determine the relative valuation between both metals. Some investors may consider a high ratio as an indicator that Silver is undervalued, or Gold is overvalued. On the contrary, a low ratio might suggest that Gold is undervalued relative to Silver.
Gold price bounced sharply after nearing the $2,600 mark, now trading around the $2,620 level. The US Dollar saw a short-lived spike following the release of United States (US) data, which came opposite to the Federal Reserve (Fed) needs.
On the one hand, inflation in September was hotter than anticipated. The annual Consumer Price Index (CPI) rose by 2.4%, easing from the previous 2.5% but higher than the 2.3% expected. Core annual CPI rose 3.3%, above the August reading and the market forecast of 3.2%. On a monthly basis, the CPI was up 0.2% against the 0.1% anticipated by market participants. On the other hand, Initial Jobless Claims for the week ended October 4 rose to 258K, worse than the 230K expected.
After the dust settled, however, market participants understood the figures were hardly enough to affect future Federal Reserve’s (Fed) decisions. The US Dollar seesawed between gains and losses but seems to be slowly recovering its bullish poise. American stock markets, in the meantime, struggle for direction. Following the upbeat performance of Asian and European indexes, only the S&P500 posts gains.
Looking ahead, market participants will have to wait for US data scheduled for next week, as well as the European Central Bank (ECB) monetary policy announcement.
From a technical point of view, the daily chart for the XAU/USD pair shows it may soon resume its advance. After falling below a still bullish 20 Simple Moving Average (SMA), Gold aims to recover above it. In the meantime, the 100 and 200 SMAs maintain their bullish slopes far below the current level. Finally, the Momentum indicator hovers around its 100 line, partially losing its bearish strength, while the Relative Strength Index (RSI) indicator turned higher and currently stands at around 55.
The near-term picture is still bearish. XAU/USD is meeting sellers at around its 20 SMA, which extends its slide below a mildly bullish 100 SMA. Technical indicators, in the meantime, offer neutral-to-bearish slopes while developing below their midlines. At this point, a steeper decline below the $2,600 mark seems unlikely, but the odds for a firmer advance in the near term are still low.
Support levels: 2,603.90 2,589.10 2,575.20
Resistance levels: 2,625.40 2,637.10 2,652.90
The CME FedWatch Tool indicates that the likelihood of a 25 bps rate cut in November dropped to 75.9% from 85.2% a day earlier, signaling shifting market sentiment. Additionally, US Treasury yields continued to climb, with the 10-year Treasury note reaching 4.06%, up 5.5 bps. This, coupled with a stronger US Dollar Index (DXY) at 102.90, its highest level since mid-August, weighed heavily on gold prices.
Morning Cues
– S&P and Dow end at record highs
– CPI data awaited in the US tonight
– Asian markets higher, GIFT nifty indicating open in the green of around 125 pts
– DIIs Buy 3509cr, FIIs Sell 4,563cr in Cash
– TCS reports numbers today
– Crude and gold prices continue to fall— Sonal Bhutra (@sonalbhutra) October 10, 2024
All eyes are now on the upcoming US Consumer Price Index (CPI) report, which is forecasted to show a decline from 2.5% to 2.3% year-over-year (YoY). Monthly CPI is expected to come in at 0.1%, down from 0.2%. If the data aligns with expectations, it could signal a continuation of the Fed’s dovish stance, potentially providing some relief for gold.
Core CPI is anticipated to remain unchanged at 3.2% YoY. Any deviation from these estimates could either strengthen or weaken the case for future rate cuts, impacting gold prices significantly. Additionally, Initial Jobless Claims data for the week ending October 5 is projected to show 230K new claims, slightly higher than the previous reading of 225K.
Gold is currently holding above a key support level at $2,605, supported by an upward trendline on the 4-hour chart. As long as the price remains above this trendline, a potential bullish reversal could be in play. Immediate resistance is seen at $2,624, with the next target at $2,636, coinciding with the 50-day Exponential Moving Average (EMA). Breaking above $2,636 could open the door to $2,652.
Gold held at $2,620, pressured by a strong US dollar and China’s vague stimulus plans. Investors await key CPI and PPI data for more clues. October 9th, 2024 pic.twitter.com/spKnecRCdl
— Russell Calkins (@RUSSELLCALKINS) October 9, 2024
However, if the $2,605 support is breached, gold may face increased selling pressure, pushing prices down to $2,594 and potentially $2,573. The Relative Strength Index (RSI) is currently at 40, indicating neutral sentiment but is approaching oversold territory, which could lead to a short-term rebound.
FOMC Impact: The Fed’s Minutes reveal divided opinions on rate cuts, adding pressure on gold.
CPI Expectations: Upcoming US CPI data will be crucial in determining short-term direction.
Technical Outlook: $2,605 serves as key support; a break below could trigger further downside.
Overall, the upcoming economic data and the Fed’s stance will play a critical role in shaping gold’s trajectory. Traders should closely monitor the $2,605 support level and $2,624 resistance for potential breakout signals.
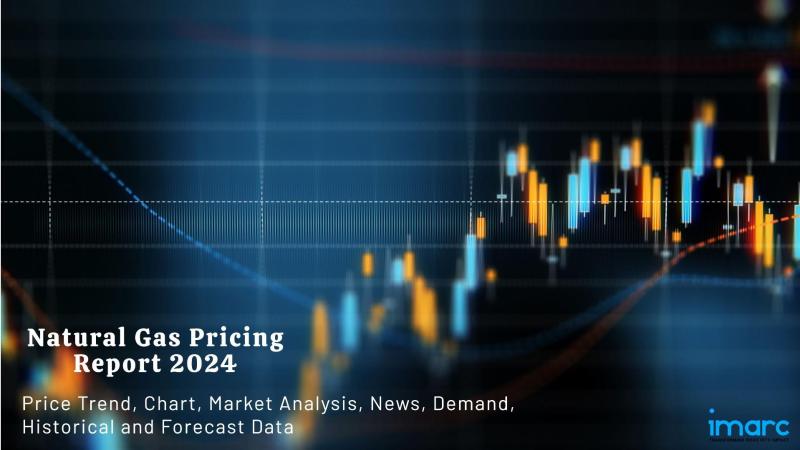
The latest IMARC Group report, ” 𝗡𝗮𝘁𝘂𝗿𝗮𝗹 𝗚𝗮𝘀 𝗣𝗿𝗶𝗰𝗲𝘀, 𝗧𝗿𝗲𝗻𝗱, 𝗖𝗵𝗮𝗿𝘁, 𝗗𝗲𝗺𝗮𝗻𝗱, 𝗠𝗮𝗿𝗸𝗲𝘁 𝗔𝗻𝗮𝗹𝘆𝘀𝗶𝘀, 𝗡𝗲𝘄𝘀, 𝗛𝗶𝘀𝘁𝗼𝗿𝗶𝗰𝗮𝗹 𝗮𝗻𝗱 𝗙𝗼𝗿𝗲𝗰𝗮𝘀𝘁 𝗗𝗮𝘁𝗮 𝗥𝗲𝗽𝗼𝗿𝘁 𝟮𝟬𝟮𝟰 𝗘𝗱𝗶𝘁𝗶𝗼𝗻,” presents a detailed analysis of price trends, offering key insights into global market dynamics. This report includes comprehensive price charts, which trace historical data and highlights major shifts in the market. The analysis delves into the factors driving these trends, including raw material costs, production fluctuations, and geopolitical influences. Moreover, the report examines demand, illustrating how consumer behavior and industrial needs affect overall market dynamics. By exploring the intricate relationship between supply and demand, the prices report uncovers critical factors influencing current and future prices.
For strategic planning, the report provides Natural Gas price forecasts, allowing businesses to anticipate price shifts and make informed decisions about procurement and investment. The forecast draws on historical data, market trends, and key economic indicators, ensuring a reliable outlook for stakeholders. Additionally, the inclusion of the price index offers a broader view of market performance over time, providing a valuable benchmark for evaluating market trends. With these insights, the report equips industry stakeholders with the tools needed to navigate the complex global Natural Gas market and optimize their strategies in response to evolving conditions.
𝗡𝗮𝘁𝘂𝗿𝗮𝗹 𝗚𝗮𝘀 𝗣𝗿𝗶𝗰𝗲𝘀 𝗟𝗮𝘀𝘁 𝗤𝘂𝗮𝗿𝘁𝗲𝗿:
• 𝗖𝗵𝗶𝗻𝗮: 3485 USD/1000 MMBtu
𝗥𝗲𝗽𝗼𝗿𝘁 𝗢𝗳𝗳𝗲𝗿𝗶𝗻𝗴:
• 𝗠𝗼𝗻𝘁𝗵𝗹𝘆 𝗨𝗽𝗱𝗮𝘁𝗲𝘀: Annual Subscription
• 𝗤𝘂𝗮𝗿𝘁𝗲𝗿𝗹𝘆 𝗨𝗽𝗱𝗮𝘁𝗲𝘀: Annual Subscription
• 𝗕𝗶𝗮𝗻𝗻𝘂𝗮𝗹𝗹𝘆 𝗨𝗽𝗱𝗮𝘁𝗲𝘀: Annual Subscription
The study examines the key factors driving Natural Gas price variations, focusing on shifts in raw material costs, the balance between supply and demand, and the impact of geopolitical influences. It also considers sector-specific developments that play a critical role in shaping market prices. By analysing these elements, the report offers valuable insights into the underlying causes of Natural Gas price fluctuations, helping businesses and investors understand market behaviour more effectively.
In addition, the report provides the latest market updates, ensuring stakeholders are informed about recent fluctuations, regulatory changes, and technological advancements. This comprehensive resource equips decision-makers with the necessary tools to enhance their strategic planning and improve forecasting accuracy. Through this analysis, the report becomes an indispensable asset for anyone looking to navigate the complexities of the Natural Gas market and optimize future strategies.
𝗥𝗲𝗾𝘂𝗲𝘀𝘁 𝗙𝗼𝗿 𝗮 𝗦𝗮𝗺𝗽𝗹𝗲 𝗖𝗼𝗽𝘆 𝗼𝗳 𝘁𝗵𝗲 𝗥𝗲𝗽𝗼𝗿𝘁: https://www.imarcgroup.com/natural-gas-pricing-report/requestsample
𝗞𝗲𝘆 𝗛𝗶𝗴𝗵𝗹𝗶𝗴𝗵𝘁𝘀 𝗼𝗳 𝘁𝗵𝗲 𝗡𝗮𝘁𝘂𝗿𝗮𝗹 𝗚𝗮𝘀 𝗣𝗿𝗶𝗰𝗲 𝗧𝗿𝗲𝗻𝗱
The rising demand for cleaner energy sources is driving the global market as governments and industries seek to reduce carbon emissions, positioning natural gas as a bridge fuel due to its lower carbon output compared to coal and oil. Continual technological advancements in extraction methods, such as hydraulic fracturing and horizontal drilling, have significantly increased supply, particularly in regions, such as North America. Rising energy consumption, especially in developing economies, is pushing demand further as natural gas is used for electricity generation, heating, and industrial processes. Additionally, the shift towards liquefied natural gas (LNG) is expanding the market, as it allows for easier transportation and access to markets that are not connected by pipelines.
𝗙𝗮𝗰𝘁𝗼𝗿𝘀 𝗜𝗻𝗳𝗹𝘂𝗲𝗻𝗰𝗶𝗻𝗴 𝗡𝗮𝘁𝘂𝗿𝗮𝗹 𝗚𝗮𝘀 𝗣𝗿𝗶𝗰𝗲𝘀 𝗶𝗻 𝗧𝗵𝗲 𝗗𝗶𝗳𝗳𝗲𝗿𝗲𝗻𝘁 𝗥𝗲𝗴𝗶𝗼𝗻𝘀
𝗜𝗻 𝗡𝗼𝗿𝘁𝗵 𝗔𝗺𝗲𝗿𝗶𝗰𝗮:
During the last quarter of 2024, there was a substantial increase in natural gas prices in North America due to various factors. Elevated temperatures led to higher air conditioning usage in both commercial and residential buildings, causing an increased need for natural gas. Reduced storage injections and production limitations from maintenance and well completion delays further affected this demand. The growing export market for liquefied natural gas (LNG) has also reduced domestic supply, contributing to increased prices.
𝗜𝗻 𝘁𝗵𝗲 𝗔𝘀𝗶𝗮 𝗣𝗮𝗰𝗶𝗳𝗶𝗰 𝗥𝗲𝗴𝗶𝗼𝗻:
Prices in the Asia Pacific area have gone up due to a strong dependence on natural gas for both manufacturing and power generation. Continuing geopolitical tensions continued to decrease the supply of global LNG, ramping up the price increases. China experienced the largest price hikes because of increased industrial demand and high energy usage during the summer.
𝗜𝗻 𝗘𝘂𝗿𝗼𝗽𝗲 𝗥𝗲𝗴𝗶𝗼𝗻𝘀:
Europe experienced a notable increase, primarily caused by political turmoil and difficulties with supply chains. Decreased flow resulted from maintenance work on major pipelines and unexpected shutdowns at critical supply hubs, while global tensions affecting energy trading also played a role. Increasing global interest in LNG, sparked by heatwaves in Asia, redirected supplies away from Europe, resulting in price hikes. Germany faced major price hikes because of its efforts to decrease dependence on Russian gas and challenges with storage reconstruction, resulting in it being the most unpredictable out of all nations.
𝗜𝗻 𝗠𝗘𝗔 𝗥𝗲𝗴𝗶𝗼𝗻𝘀:
Increased demand and restricted supply led to a notable rise in natural gas costs in the MEA region. The main factors behind the price increase were the growth in industrial activity and the high demand for electricity due to hot temperatures. The region’s focus on transitioning to greener energy sources such as natural gas further raised demand.
𝗦𝗽𝗲𝗮𝗸 𝘁𝗼 𝗔𝗻 𝗔𝗻𝗮𝗹𝘆𝘀𝘁: https://www.imarcgroup.com/request?type=report&id=22409&flag=C
𝗢𝘃𝗲𝗿𝗮𝗹𝗹, 𝗣𝗿𝗶𝗰𝗲 𝗧𝗿𝗲𝗻𝗱 𝗮𝗻𝗱 𝗥𝗲𝗴𝗶𝗼𝗻𝗮𝗹 𝗣𝗿𝗶𝗰𝗲𝘀 𝗔𝗻𝗮𝗹𝘆𝘀𝗶𝘀:
• 𝗔𝘀𝗶𝗮 𝗣𝗮𝗰𝗶𝗳𝗶𝗰: China, India, Indonesia, Pakistan, Bangladesh, Japan, Philippines, Vietnam, Thailand, South Korea, Malaysia, Nepal, Taiwan, Sri Lanka, Hongkong, Singapore, Australia, and New Zealand
• 𝗘𝘂𝗿𝗼𝗽𝗲: Germany, France, United Kingdom, Italy, Spain, Russia, Turkey, Netherlands, Poland, Sweden, Belgium, Austria, Ireland, Switzerland, Norway, Denmark, Romania, Finland, Czech Republic, Portugal and Greece
• 𝗡𝗼𝗿𝘁𝗵 𝗔𝗺𝗲𝗿𝗶𝗰𝗮: United States and Canada
• 𝗟𝗮𝘁𝗶𝗻 𝗔𝗺𝗲𝗿𝗶𝗰𝗮: Brazil, Mexico, Argentina, Columbia, Chile, Ecuador, and Peru
• 𝗠𝗶𝗱𝗱𝗹𝗲 𝗘𝗮𝘀𝘁 & 𝗔𝗳𝗿𝗶𝗰𝗮: Saudi Arabia, UAE, Israel, Iran, South Africa, Nigeria, Oman, Kuwait, Qatar, Iraq, Egypt, Algeria, and Morocco
𝗡𝗼𝘁𝗲: 𝗧𝗵𝗲 𝗰𝘂𝗿𝗿𝗲𝗻𝘁 𝗰𝗼𝘂𝗻𝘁𝗿𝘆 𝗹𝗶𝘀𝘁 𝗶𝘀 𝘀𝗲𝗹𝗲𝗰𝘁𝗶𝘃𝗲, 𝗱𝗲𝘁𝗮𝗶𝗹𝗲𝗱 𝗶𝗻𝘀𝗶𝗴𝗵𝘁𝘀 𝗶𝗻𝘁𝗼 𝗮𝗱𝗱𝗶𝘁𝗶𝗼𝗻𝗮𝗹 𝗰𝗼𝘂𝗻𝘁𝗿𝗶𝗲𝘀 𝗰𝗮𝗻 𝗯𝗲 𝗼𝗯𝘁𝗮𝗶𝗻𝗲𝗱 𝗳𝗼𝗿 𝗰𝗹𝗶𝗲𝗻𝘁𝘀 𝘂𝗽𝗼𝗻 𝗿𝗲𝗾𝘂𝗲𝘀𝘁.
𝗖𝗼𝗻𝘁𝗮𝗰𝘁 𝘂𝘀:
IMARC Group
134 N 4th St. Brooklyn, NY 11249, USA
𝗘𝗺𝗮𝗶𝗹: sales@imarcgroup.com
𝗧𝗲𝗹 𝗡𝗼:(𝗗) +91 120 433 0800
𝗨𝗻𝗶𝘁𝗲𝗱 𝗦𝘁𝗮𝘁𝗲𝘀: +1-631-791-1145
𝗔𝗯𝗼𝘂𝘁 𝗨𝘀:
IMARC Group is a global management consulting firm that helps the world’s most ambitious changemakers to create a lasting impact. The company provide a comprehensive suite of market entry and expansion services. IMARC offerings include thorough market assessment, feasibility studies, company incorporation assistance, factory setup support, regulatory approvals and licensing navigation, branding, marketing and sales strategies, competitive landscape and benchmarking analyses, pricing and cost research, and procurement research.
This release was published on openPR.
Important DisclaimersThe content provided on the website includes general news and publications, our personal analysis and opinions, and contents provided by third parties, which are intended for educational and research purposes only. It does not constitute, and should not be read as, any recommendation or advice to take any action whatsoever, including to make any investment or buy any product. When making any financial decision, you should perform your own due diligence checks, apply your own discretion and consult your competent advisors. The content of the website is not personally directed to you, and we does not take into account your financial situation or needs.The information contained in this website is not necessarily provided in real-time nor is it necessarily accurate. Prices provided herein may be provided by market makers and not by exchanges.Any trading or other financial decision you make shall be at your full responsibility, and you must not rely on any information provided through the website. FX Empire does not provide any warranty regarding any of the information contained in the website, and shall bear no responsibility for any trading losses you might incur as a result of using any information contained in the website.The website may include advertisements and other promotional contents, and FX Empire may receive compensation from third parties in connection with the content. FX Empire does not endorse any third party or recommends using any third party’s services, and does not assume responsibility for your use of any such third party’s website or services.FX Empire and its employees, officers, subsidiaries and associates, are not liable nor shall they be held liable for any loss or damage resulting from your use of the website or reliance on the information provided on this website.Risk DisclaimersThis website includes information about cryptocurrencies, contracts for difference (CFDs) and other financial instruments, and about brokers, exchanges and other entities trading in such instruments. Both cryptocurrencies and CFDs are complex instruments and come with a high risk of losing money. You should carefully consider whether you understand how these instruments work and whether you can afford to take the high risk of losing your money.FX Empire encourages you to perform your own research before making any investment decision, and to avoid investing in any financial instrument which you do not fully understand how it works and what are the risks involved.
Gold price is nursing losses above $2,600 early Thursday after falling for the sixth straight day on Wednesday. The bright metal sits at its lowest level in three weeks in the run-up to the all-important US Consumer Price Index (CPI) data release due later this Thursday.
According to the CME Group’s FedWatch Tool, markets continue to price in an 82% chance that the US Federal Reserve (Fed) will opt for a 25 basis point (bps) interest rate cut in November. The market’s expectations for the next Fed policy move did not change even though the Minutes of the Fed’s September meeting were read dovishly.
The Minutes showed on Wednesday that a substantial majority of officials supported an outsized 50 bps rate cut to balance confidence in inflation with worries over the labor market.
Therefore, the US consumer inflation data for September holds the key to completely ruling out a jumbo Fed rate cut probability, advocated by a surprisingly strong US Nonfarm Payrolls report, which suggested that the labor market is in a healthy condition than initially feared.
The annual CPI is seen rising 2.3% in September after increasing by 2.5% in August. The core CPI is set to hold steady at 3.2% YoY in the same period. On a monthly basis, the US CPI inflation is expected to tick a tad lower to 0.1% in September vs. August’s 0.2%. The core figure is also likely to ease to 0.2%, following a 0.3% growth in August.
A bigger-than-expected decline in both the annual and monthly CPI inflation data could revive hopes for an outsized Fed rate cut next month, triggering a fresh correction in the US Dollar (USD) against its major rivals. Gold price could stage a strong comeback on aggressive Fed’s easing expectations and the potential USD’s demise.
On the other hand, markets could even dial down bets of a 25 bps rate cut in November, if the US CPI data surprises to the upside across the time horizon. In such a scenario, the non-interest-bearing Gold price could be hit the most while the Greenback is expected to see an extended recovery.
Anticipating the main event risk of this week, the US CPI data, traders seem non-committal and refrain from placing fresh bets on the bright metal. Gold price, however, draws some support from the latest news surrounding Chinese stimulus.
On Wednesday, China’s Finance Ministry announced that it will roll out a fiscal stimulus package worth CNY 2 trillion on Saturday to support economic growth. Meanwhile, the People’s Bank of China (PBOC) launched a security, funds and insurance companies swap facility) for CNY500 billion to boost domestic stock markets on Thursday.
Buyers continue to defend their positions even after Gold price closed Wednesday below the key 21-day Simple Moving Average (SMA) support, then at $2,619.
With the 14-day Relative Strength Index (RSI) still holding above the 50 level, Gold buyers remain hopeful about a potential turnaround.
On the downside, the immediate support is seen at the $2,600 threshold. A sustained break below the latter could extend the downside toward the September 20 low of $2,585.
Alternatively, Gold price needs to recapture the 21-day SMA support-turned-resistance, now at $2,623, to revive the uptrend.
The next bullish targets are seen at the $2,650 psychological barrier and the intermittent highs near $2,670.
Inflationary or deflationary tendencies are measured by periodically summing the prices of a basket of representative goods and services and presenting the data as The Consumer Price Index (CPI). CPI data is compiled on a monthly basis and released by the US Department of Labor Statistics. The YoY reading compares the prices of goods in the reference month to the same month a year earlier.The CPI is a key indicator to measure inflation and changes in purchasing trends. Generally speaking, a high reading is seen as bullish for the US Dollar (USD), while a low reading is seen as bearish.
Oil prices have fallen dramatically in recent weeks, but supply disruptions and optimism around a potential U.S. interest rate cut appear to have halted that downward momentum.


– The marked shift in oil sentiment recently has been to a great deal prompted by a widespread concern of Chinese demand peaking this or next year as LNG displaces diesel in long-haul trucking, EV sales overtaking conventional cars since July and rail expansion eating into jet fuel recovery.
– Chinese refinery runs have been declining for five straight months, with the National Bureau of Statistics reporting throughput rates at 13.91 million b/d in August amidst a widespread decline in Shandong teapot runs, as low as 55% last month.
– Meanwhile, Asian refiners’ margins slumped to the lowest seasonal levels since 2020 as high inventories of diesel and gasoline become an increasingly worrying factor as peak summer demand tapers off.
– China’s clampdown on tax evasion is aggravating the pressure on refiners after a Shandong court ruled two refiners run by state-owned firm Sinochem, the Huaxing and Zhenghe plants totalling 220,000 b/d in capacity, fully bankrupt.
Market Movers
– US upstream firm APA (NASDAQ:APA) said it would sell non-core assets in the Permian basin to an undisclosed buyer for some $950 million, reducing its debt after the $6.7 billion acquisition of Callon Petroleum.
– Japan’s largest trading company Mitsubishi (TYO:8058) signed a framework agreement with ExxonMobil to join the Baytown blue ammonia and hydrogen project, right after ADNOC signed on, too.
– China’s national oil company PetroChina (SHA:601857) has signed two petroleum sharing contracts with Suriname’s state oil firm Staatsolie for two shallow-water blocks, saying they’ve missed the Guyana bonanza and do not want to miss Suriname.
Tuesday, September 17, 2024
After several tumultuous weeks, the downhill slide seems to have ended for crude oil futures, with ICE Brent trading relatively rangebound at $72.50 per barrel. Supply disruptions in Libya and the US Gulf of Mexico prevented concerns over China’s economy from triggering an even bigger slide and the US Federal Reserve’s much-anticipated interest rate cut could lift the market mood slightly higher.
Bearish Bets Hit All-Time Lows. Short positions held by hedge funds and other money managers in the ICE Brent futures contract surpassed long ones for the first time on record, with a net short of 12,680 contracts reflecting widespread concerns over Chinese demand and the US economy.
Petrobras’s New Strategy Refocuses on Oil & Gas. The new top financial officer of Brazil’s state oil firm Petrobras (NYSE:PBR) Fernando Melgarejo said the company’s new 2025-2029 strategic plan would have a more upstream-focused vision to prevent a decline in oil and gas reserves around 2030.
US Gulf Recovers from Hurricane Francine Impact. Oil and gas producers are resuming production in the US Gulf of Mexico with only 12% of output (and 24 platforms) shut in as of Monday, some 213,000 b/d, as peak closures reached 732,000 b/d last week or 42% of total offshore output.
Brazil Nears in on Dam Disaster Settlement. Brazil’s government confirmed that it is in talks with mining giants Vale (NYSE:VALE) and BHP (NYSE:BHP) over a potential $18 billion payout for the deadly 2015 Brumadinho dam collapse, ending one of the most protracted mining litigations.
Colombia Implodes After Court Blocks Offshore Drilling. A Colombian court ordered the halt of drilling operations at the Uchuva-2 offshore well in the gas-rich and untapped offshore zone of the country, saying the operator Ecopetrol (NYSE:EC) failed to consult a local Indigenous community.
Egypt Awards 20-Cargo LNG Tender for Winter. As Egypt seeks to cover its power needs amidst drastically declining domestic gas production, the country’s state energy firm EGPC has bought 20 LNG cargoes for the winter, the first such tender since 2018 when Zohr started to ramp up output.
US Oil Majors Fight Back Against Consumer Lawsuits. US oil majors including ExxonMobil (NYSE:XOM) and Chevron (NYSE:CVX) defeated an appeal by consumers that accused them of colluding with former US President Donald Trump and OPEC+, citing a lack of proof of antitrust violations.
Saudi NOC Builds Up LNG Portfolio. Saudi Arabia’s national oil firm Saudi Aramco (TADAWUL:2222) will lift its stake in LNG investment firm MidOcean Energy to 49%, co-owned with EIG, and also fund its acquisition of a new 15% stake in Peru LNG from Hunt Oil Company to bring its stake to 35%.
Can Gold Production Peak Soon? According to S&P Global, the relative scarcity of new gold discoveries since 2020 could lead to a gold production peak in 2026 at 110 million ounces, driven by Australia and Canada mostly, subsequently falling to 103 million ounces in 2028.
UAE Eyes Expansion into India’s SPR Reserves. Following a visit of UAE top officials to India, the country’s oil company ADNOC is eyeing opportunities to expand its crude storage volumes in India’s underground SPR caverns as Delhi seeks to triple its reserves from the current 5.86 million barrels.
Germany’s Wind Power Auction Beats Expectations. Germany’s Federal Network Agency stated it had awarded contracts for almost 3 GW of onshore wind energy in its latest annual auction, the highest volume ever, with the average awarded price reaching 7.33 €cent/KWh, a couple of cents below the maximum allowed limit.
Russia Lands Landmark Bolivia Lithium Deal. One of the most coveted lithium reserves globally, Bolivia’s Salar de Uyuni will see increasing Russian involvement after the country’s lithium firm YLB signed a $976 million deal to build its first direct lithium extraction plant, with a capacity of 14ktpa.
South Sudan Resumes Flows Through War-Torn Sudan. The presidential office of South Sudan announced that the country and its northern neighbor Sudan have made headway in restarting the halted pipeline that brings its crude to the export markets, repairing damaged areas as government forces continue to clash with RSF forces.
By Michael Kern for Oilprice.com
Silver consolidated at around the weekly lows on Wednesday, posting losses of over 0.30%, but it remains above the October 8 daily low of $30.12 late in the North American session. At the time of writing, the XAG/USD trades at $30.61, sponsored by higher US Treasury bond yields following the release of the latest FOMC meeting minutes.
The minutes showed some officials were looking for a 25 basis points rate cut at the September meeting. According to the minutes, officials agreed that the larger cut approved at the meeting shouldn’t be a sign of concern over the economic outlook or viewed as a signal that the Fed was prepared to rapidly lower interest rates.
Silver price stopped its downfall following Tuesday’s over 3.28% loss. Although this could open the door for some consolidation, downside risks remain.
Momentum is still favoring sellers, according to the Relative Strength Index (RSI). With that said, the path of least resistance in the short term is tilted to the downside.
The XAG/USD’s next support will be $30.12. Once broken, sellers could challenge the psychological figure of $30.00. If surpassed, the confluence of the 100 and 50-day moving averages (DMAs) would be up next at $29.73 and $29.53, respectively.
Conversely, if XAG/USD buyers move in and push prices above $30.50, they could lift the grey’s metal price toward $31.00. However, to shift the bias to upward, they must clear the $31.77 October 8 peak.
Silver is a precious metal highly traded among investors. It has been historically used as a store of value and a medium of exchange. Although less popular than Gold, traders may turn to Silver to diversify their investment portfolio, for its intrinsic value or as a potential hedge during high-inflation periods. Investors can buy physical Silver, in coins or in bars, or trade it through vehicles such as Exchange Traded Funds, which track its price on international markets.
Silver prices can move due to a wide range of factors. Geopolitical instability or fears of a deep recession can make Silver price escalate due to its safe-haven status, although to a lesser extent than Gold’s. As a yieldless asset, Silver tends to rise with lower interest rates. Its moves also depend on how the US Dollar (USD) behaves as the asset is priced in dollars (XAG/USD). A strong Dollar tends to keep the price of Silver at bay, whereas a weaker Dollar is likely to propel prices up. Other factors such as investment demand, mining supply – Silver is much more abundant than Gold – and recycling rates can also affect prices.
Silver is widely used in industry, particularly in sectors such as electronics or solar energy, as it has one of the highest electric conductivity of all metals – more than Copper and Gold. A surge in demand can increase prices, while a decline tends to lower them. Dynamics in the US, Chinese and Indian economies can also contribute to price swings: for the US and particularly China, their big industrial sectors use Silver in various processes; in India, consumers’ demand for the precious metal for jewellery also plays a key role in setting prices.
Silver prices tend to follow Gold’s moves. When Gold prices rise, Silver typically follows suit, as their status as safe-haven assets is similar. The Gold/Silver ratio, which shows the number of ounces of Silver needed to equal the value of one ounce of Gold, may help to determine the relative valuation between both metals. Some investors may consider a high ratio as an indicator that Silver is undervalued, or Gold is overvalued. On the contrary, a low ratio might suggest that Gold is undervalued relative to Silver.