

Category: Forex News, News
Weekly Forex Forecast – 9th to 13th March 2026 (Charts)
Full-scale war over Iran in the Middle East has pushed energies to multi-year highs and helped strengthen safe havens such as the US Dollar and Gold.

I wrote on the 1st March that the best trades for the week would be:

-
Long of Gold following a daily (New York) close above $5,418.55. This did not set up.
-
Short of Bitcoin following a daily (New York) close below $61,000 targeting $50,000. This did not set up either.
A summary of last week’s most important data in the market:
-
US Average Hourly Earnings – this was a fraction higher than expected, showing a month-on-month increase of 0.4% compared to a widely anticipated 0.3%, weakening the case for rate cuts.
-
US Non-Farm Employment Change – this was considerably worse than expected, by approximately 150k jobs, strengthening the case for rate cuts.
-
US Retail Sales – this was just a tick higher than expected, but it was still a negative rate.

-
US ISM Services PMI – this was much better than expected.
-
Australian GDP – the Australian economy grew by 0.8% last quarter, while growth of only 0.7% was expected, giving a slight boost to the prospect of rate hikes.
-
UK Annual Budget – no surprises.
-
US Unemployment Rate – unexpectedly ticked higher from 4.3% to 4.4%.
-
US Unemployment Claims – this was approximately as expected.
The only significant effects last week’s economic data had was a hawkish tilt on the USD, with the CME FedWatch tool now showing the market is pricing in only one further rate cut in 2026, a cut of 0.25% in September.
The week was really dominated by the ongoing war between Israel/USA and Iran, with several US-friendly countries near Iran being attached by Iran, although the attacks are mostly aimed at US bases. Some of Iran’s neighbours have retaliated or claimed to have done so, notably Qatar and the UAE.
It seems clear that the US and Israel basically have achieved air superiority in the skies of Iran and intend to systematically demolish the Islamic Republic and its military capabilities, with a focus on its ballistic missiles and nuclear program. From the point of view of Israel and the USA, the war can be said to be proceeding very successfully.
It seems clear that this war is going to last for a few weeks, maybe even as long as six weeks, and that a surrender by the regime remains unlikely, at least for time being.
Hezbollah, Iran’s proxy in Lebanon, joined the war on day 3 by firing on Israel. It is pretty clear Hezbollah also fired drones at a sovereign British base in Cyprus, which is an attack on NATO and the EU, although very little is being done about it.
Most notably for the markets, traffic has almost completely stopped passing through the trait of Hormuz, and although there are sufficient stockpiles to last a few weeks, we are seeing the price of crude oil and crude oil related products jump to long-term highs, with WTI surpassing $90 per barrel on Friday. It may be that the US administration had hoped the price would not rise so far so quickly, but these high crude oil prices could feed into other aspects of the economy and start to bring stock markets lower.
The coming week’s most important data points, in order of likely importance, are:
-
USA CPI (inflation)
-
US Core PCE Price Index
-
US Preliminary GDP
-
US JOLTS Job Openings
-
US Unemployment Claims
-
UK GDP
-
Canada Unemployment Rate
Currency Price Changes and Interest Rates
For the month of March, I make no monthly Forex forecast as the US Dollar is not in a clear trend right now.
Last week saw no currency crosses with excessive volatility, so I am making no forecast for the coming week.
The US Dollar was the strongest major currency last week, while the Euro was the weakest. Directional volatility increased last week, with 41% of all major pairs and crosses changing in value by more than 1%.
Next week’s volatility is likely to remain high due to the few but highly significant data releases scheduled and the ongoing war in the Middle East, which might generate volatility in the US Dollar, the Japanese Yen, and the Canadian Dollar. There could also be unforeseen side effects which might affect other currencies.
You can trade these forecasts in a real or demo Forex brokerage account.
")
Key Support and Resistance Levels
Last week, the US Dollar printed a large bullish candlestick which opened with a gap higher. Although there is a significant upper wick and a rejection of a recent inflective high, which is often a bearish sign, the price is now showing a technical long-term bullish trend because the price is higher than it was both three and six months ago.
We can see that the picture is muddied even more because the price is within a zone where it has been comfortable consolidating.
The flow into the US Dollar has been caused by two things: the hawkish tilt on rate cuts we saw last week, and the outbreak of war in the middle east which has seen the greenback function as more of a safe haven.
It might be wise to take a long bias on the USD this week, but I don’t see much in it either way, so I would remain focused on other assets over this week and treat the greenback as something relatively neutral.
")
US Dollar Index Weekly Price Chart
WTI Crude Oil made its strongest rise in years last week, gapping higher at the weekly open following the surprise joint attack on Iran by the USA and Israel early Saturday, and closing Friday at a new 2 year and 5-month high price. Markets had been expecting some type of strike, but it quickly became clear that the USA and Israel are all-in for regime change, killing the Supreme Leader Khamenei with the first strike of the war.
Many analysts were persuaded that the USA would be careful to have a plan to prevent the price of crude oil from rising excessively. However, apart from the sides not making all-out attacks against oil facilities, the war has been broad enough and dangerous enough to push the price of oil notably higher, with the price now almost double what it was just a few weeks ago.
The Iranian regime and other forces which want to thwart a US/Israeli victory (such as Qatar and Turkey) will now be doing everything they can to push the price of crude oil higher. Another factor behind this is that the USA is, for the time being, basically standing off the Strait of Hormuz which Iran has practically closed – traffic through the Strait is down by about 70%. The USA has calculated that it can stand a few weeks of the Strait being blocked, although it has offered to escort tankers through.
I had thought that the outbreak of war would cause only a limited, restrained rise in the price of crude oil, as this is what happened last June during the previous Israel-Iran was. I was wrong and I sold my long too early.
It is likely to be dangerous to enter now as we could easily see a fast and huge drop in the price. However, maybe the price of oil really will rise to trade well above $100 before it goes down. It is hard to see this war ending for a few more weeks at least.
If you will go long, do it with a very small position size that reflects the enormously high volatility which we see in the price these days.
")
WTI Crude Oil Weekly Price Chart
RBOB Gasoline futures shot higher last week, reaching their highest price in almost two years.
This is all about what I wrote just above concerning WTI Crude Oil. As the price of crude oil rises, so the price of Gasoline is almost certain to rise with high positive correlation between the two assets, as gasoline is derived by refining crude oil.
As I wrote above, it might be too late for a long trade, and if you do feel you have to go long here, use a very small position size (respect the very high volatility) and a trailing stop to avoid a catastrophic loss. Remember that what goes up very hard and very fast can come down in exactly the same way.
")
RBOB Gasoline Futures Weekly Price Chart
EUR/USD ended up in focus last week because the USD and the EUR were respectively the strongest and weakest currencies over the week. This was partly driven by the war in the Middle East, with safe haven funds flowing into the USD, and the Euro affected by the halt in Qatari LNG (liquid natural gas) production which has sent European energy prices flying, and this has hit the Euro.
Technically, we see the low of the week not far from the big round number at $1.1500 where there is clearly strong support for the best part of a year. This may be important as the USD is not in a strongly bullish trend, so there is a good chance that the price here might bounce back from this area, which has acted as long-term support.
On the other hand, a solid breakdown below the $1.1500 area could see the price fall through blue sky quickly and strongly to arrive soon at the $1.1300 handle.
")
EUR/USD Weekly Price Chart
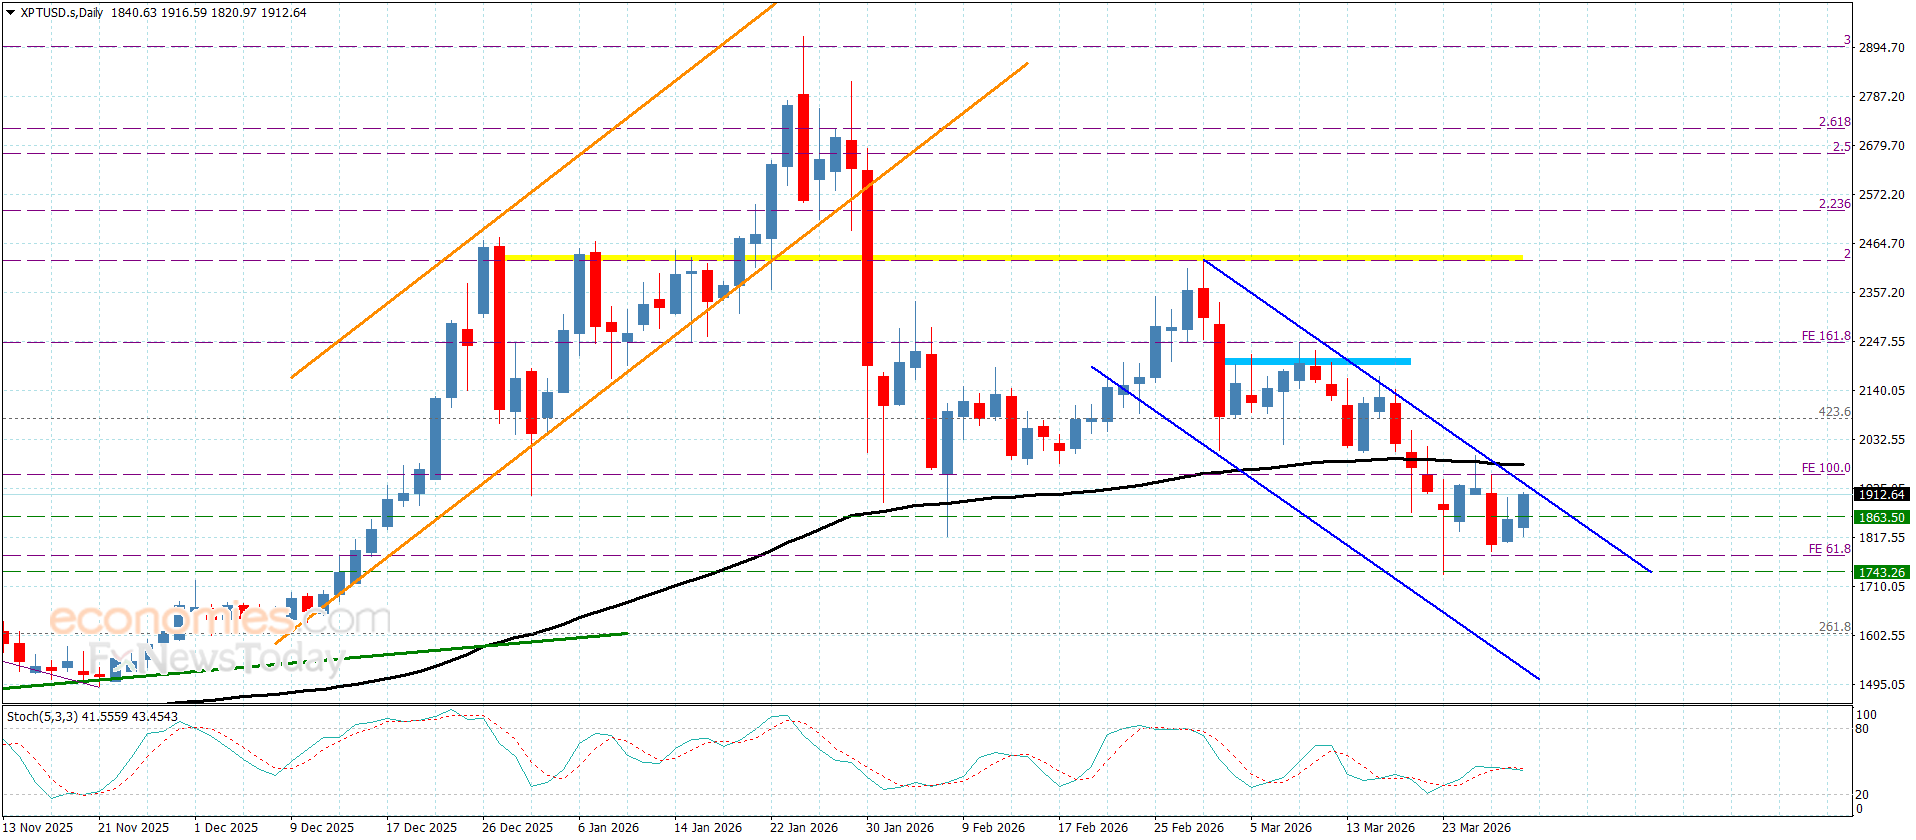
Gold fell over the week, but what happened was technically significant and bullish. When the price made its big drop early this week (see the price chart below), it found support at the big round number of $5,000 which is also highly confluent with the 50% Fibonacci retracement which is also shown as a study within the price chart.
This, combined with the fairly bullish price action we have seen since $5,000 was hit, suggests that Gold is going to keep rising, perhaps given a tailwind as a safe haven asset by the ongoing war in the Middle East.
Despite the bullish development, I will be waiting for a new record daily high closing price before entering a new long trade here.
")
Gold Daily Price Chart
ZW Wheat futures shot higher last week, reaching their highest price in a year. The weekly rise was unusually strong and mirrored the move seen in WTI Crude Oil and Gasoline. For this reason, many analysts see the war as pushing the price of grains up (all grain futures rose last week), but there are deeper reasons relating to supply issues in the grain markets and changes to the wheat business in the USA.
Although this strong rise is a little early, and the price chart below feels like we could see the price come down again very quickly, the moving averages are correctly aligned enough that trend following funds and institutions are going to be entering new long trades in Wheat at Monday’s open.
If Wheat futures are too big for you (and they probably are), you can get exposure to US Wheat by buying the Teacrium Wheat Fund (WEAT) which is an ETF and very affordable.
")
Wheat Daily Price Chart
Last week was poor for the US stock market, with the S&P 500 Index not only closing lower, but closing the week sitting heavily on the long-term support level at 6,737.
Technically, things are starting to look bearish. Look at the topping price action underneath and just touching the big round number at 7,000 which we have seen over recent weeks.
We also have a double, maybe even a triple, bearish head and shoulders chart pattern, with the neckline clearly at 6,737.
I think a bearish breakdown is likely below that level and we will then see the price quickly reach the other significant round number at 6,500, the horizontal low at 6,512, and the 200-day moving average sitting above both. If the price breaks below all that, the market really will be in trouble.
Shorting the US stock market, especially an Index, is not easy, and should only be attempted by experienced traders.
")
S&P 500 Index Daily Price Chart
I see the best trades this week as:
-
Long of Gold following a daily (New York) close above $5,418.55.
-
Long of Wheat.
Ready to trade our Forex weekly forecast? Check out our list of the top 10 Forex brokers.


Written by : Editorial team of BIPNs
Main team of content of bipns.com. Any type of content should be approved by us.


Share this article: