
Category: Forex News, News
XAU/USD eyes US-China trade talks, US CPI for fresh direction
Gold has entered a phase of consolidation near $4,100 on Friday, following the volatility seen earlier in the week. Traders now eagerly await the US-China trade talks and US Consumer Price Index (CPI) data for a clear directional impetus.
Gold trades with caution ahead of key event risks
Gold stalls its previous recovery momentum as the US Dollar (USD) gains ground in tandem with US Treasury bond yields.

Despite easing US-China trade worries, US Treasury bond yields advance on growing inflationary and growth fears, especially in light of the recent rise in Oil prices after the United States (US) imposed sanctions on Russian oil companies, escalating geopolitical tensions.
That said, the next direction in Gold price will be determined by the outcome of the US-China trade talks and the September US inflation report.
Top Chinese and US officials are meeting in Malaysia for their fifth round of trade talks to de-escalate renewed US-Sino trade conflict over rare earth metals and softwares, and hence, prepare for a potential Xi-Trump APEC meeting.
Meanwhile, the US annual CPI is seen rising by 3.1% in September, against a 2.9% growth reported in August. The core CPI inflation is expected to remain steady at 3.1% year-over-year (YoY) in the same period.
Hotter-than-expected US inflation readings could psuh back against expectations of another 25 basis points (bps) interest rate cut by the Federal Reserve (Fed) in December, following the expected October rate reduction.
In such a case, the US Dollar recovery could find additional legs at the expense of the non-yielding Gold.

On the contrary, softer US CPI data would affirm bets for two rate cuts this year, reviving the Gold’s record-setting rally. The bullion tends to benefit in a low-interest rate environment.
Further, Gold could initiate a fresh upside if US-China trade talks emerge inconclusive or falter. In case of some progress in the trade discussions, the Gold correction could regain traction.
Gold price technical analysis: Daily chart
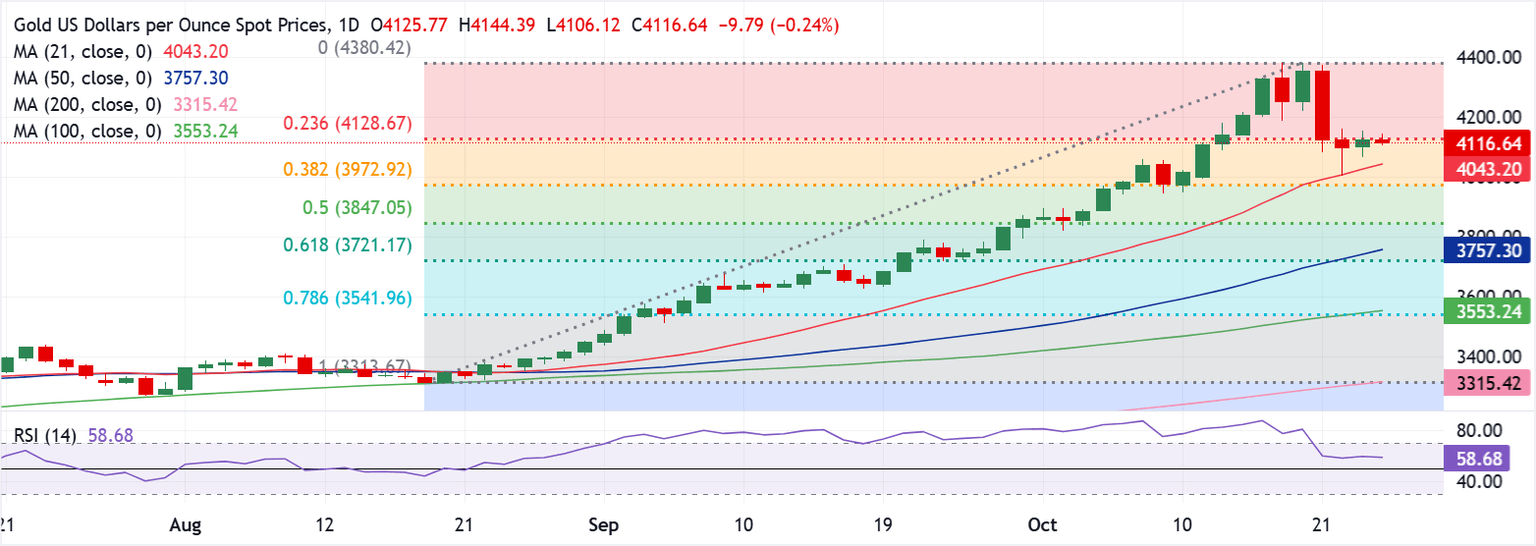
Gold is at a critical juncture on the daily chart, after having failed to close above the key 23.6% Fibonacci Retracement (August 19 low to October 20 high) support-turned-resistance at $4,129 on Thursday.
However, the bullish 14-day Relative Strength Index (RSI) and 21-day Simple Moving Average (SMA), now at $4,043, continue to keep buyers hopeful.
On softer US CPI data or disappointing US-Sino talks, buyers will look to gain acceptance above the aforesaid 23.6% Fibo resistance.
The next topside hurdle is seen at the $4,300 round level, followed by the all-time highs of $4,382.
The upside surprise in US inflation figures or US-China trade optimism could trigger a fresh correction in Gold, threatening the critical 21-day SMA support.
If selling pressure intensifies, he 38.2% Fibo level at $3,972 will be challenged.
A steeper correction could unfold on a failure to resist above the latter, opening doors toward the 50% Fibo level at $3,847.
Economic Indicator
Consumer Price Index (YoY)
Inflationary or deflationary tendencies are measured by periodically summing the prices of a basket of representative goods and services and presenting the data as The Consumer Price Index (CPI). CPI data is compiled on a monthly basis and released by the US Department of Labor Statistics. The YoY reading compares the prices of goods in the reference month to the same month a year earlier.The CPI is a key indicator to measure inflation and changes in purchasing trends. Generally speaking, a high reading is seen as bullish for the US Dollar (USD), while a low reading is seen as bearish.
Source link


Written by : Editorial team of BIPNs
Main team of content of bipns.com. Any type of content should be approved by us.


Share this article: