
Category: Forex News, News
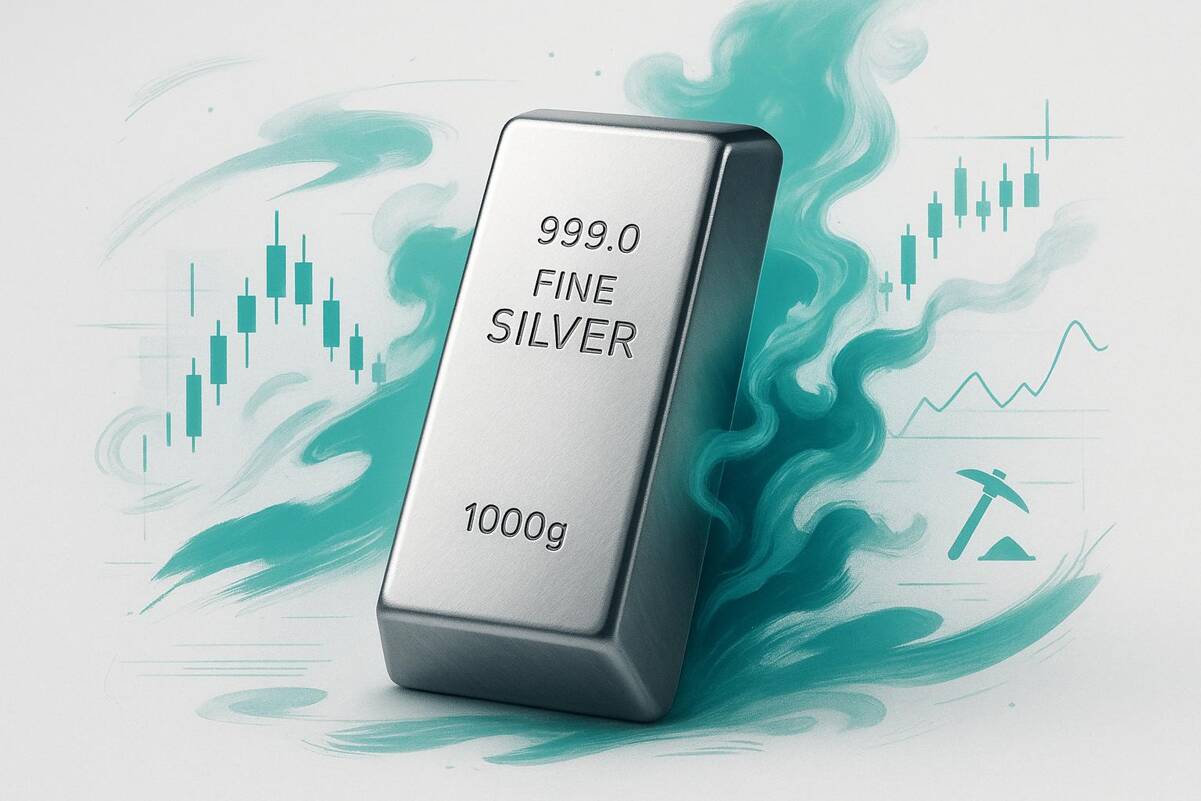
Silver (XAG/USD) Price Forecast: Long-Term Support Faces Critical Test
Weekly Chart Reinforces Key Technical Levels
The weekly chart provides additional perspective, as the lows of the past couple of weeks have been finding support near the 50-week moving average, now near $63.64. This reinforces the potential for a durable support zone. Conversely, a decisive break below that area would strengthen the bearish outlook by confirming a loss of long-term support. The 50-week moving average has held as support since it was reclaimed in March 2024, except for a couple of weeks in April 2025 when price briefly traded below it.
Resistance Levels Hold the Key
Key near-term resistance is represented by the 20-day moving average near $70.16 and the recent lower swing high at $71.56. If those levels can be recovered, silver would have an opportunity to reclaim the long-term trend indicators and improve the broader outlook. Until then, however, the bias remains tilted to the downside.

If you’d like to know more about how to trade gold and silver, please visit our educational area.
Source link


Written by : Editorial team of BIPNs
Main team of content of bipns.com. Any type of content should be approved by us.


Share this article: