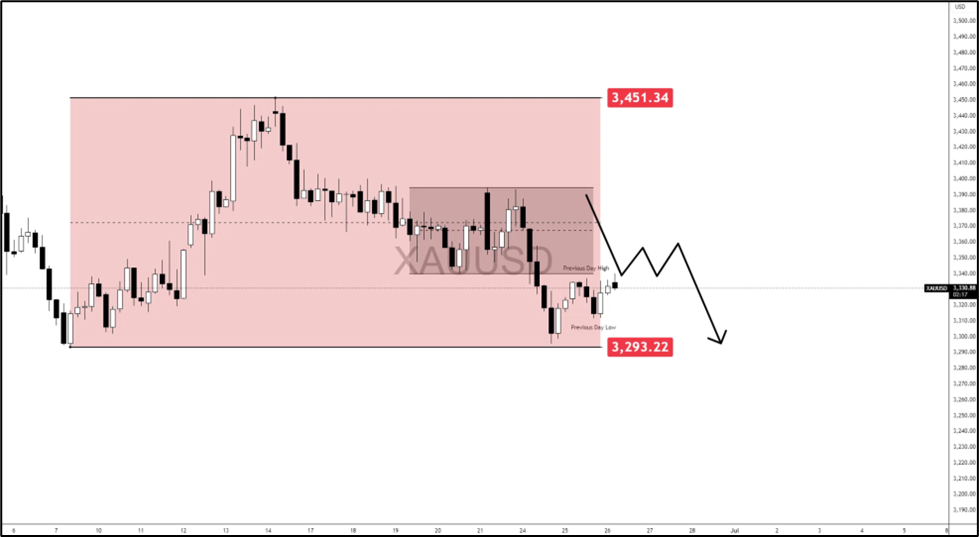
Gold remains rangebound between $3,300 and $3,450, caught in indecision as safe-haven bids and bearish technicals battle for control.
While a fragile ceasefire between Israel and Iran holds, initial violations and pending U.S.-Iran nuclear talks keep geopolitical risks alive.
A confirmed break above $3,370 targets $3,400 next, while failure to hold $3,300 may drag Gold down to $3,250 or $3,200.
Gold side steps as uncertainty remains “uncertain”
Gold (XAU/USD) has not yet given any confirmation of momentum to the upside, stuck between the $3,450 and $3,300 levels as traders weigh opposing forces. After a strong rebound from last week’s lows near $3,300, the yellow metal has struggled to sustain momentum. The upside has been capped as inflation data cooled and Treasury yields steadied.
Currently, Gold is hovering at the discount level of the overall range, signaling a bearish environment. Though Gold is in a bearish territory, this is still not yet a confirmed reversal to the downside, most especially, the tensions in the middle east, Israel and Iran, has not yet fully de-escalated, giving Gold reason to push up.
Gold’s price action now reflects indecision, with neither bulls nor bears taking full control ahead of high-impact events and amidst geopolitical tensions.
Bearish scenario on-point
This scenario was also outlined in my latest article on Gold, Gold stalls despite war headlines: Bullish and bearish scenarios to watch & Dollar, majors, indices and Gold gameplan for this week.
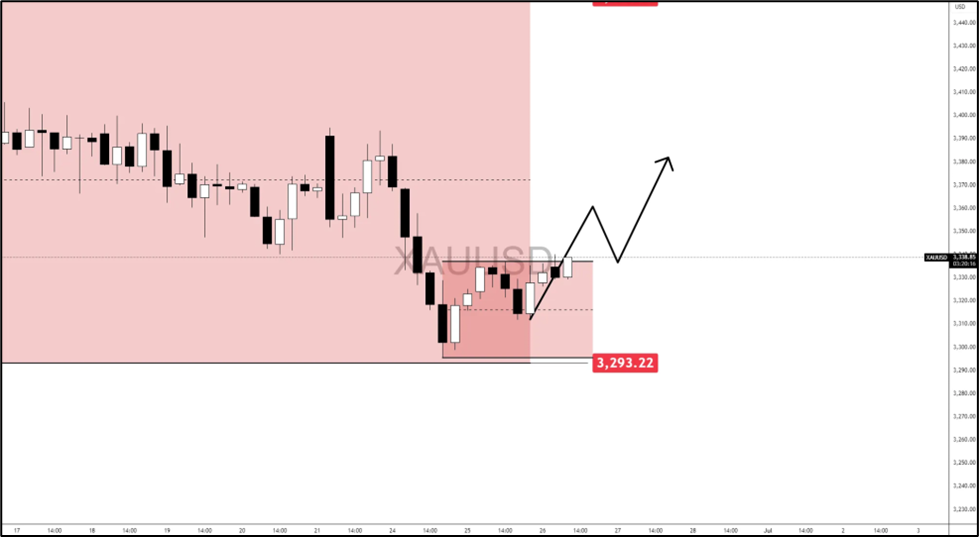
Before:
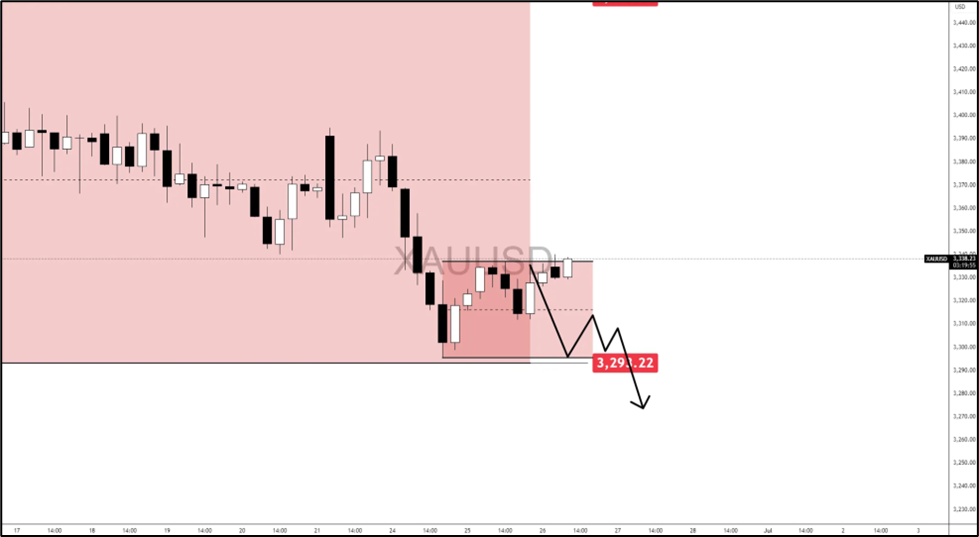
After:
The narrative behind this is that if the ceasefire gains traction and Iran steps back and opens door to diplomacy, risk appetite may rebound, dragging gold down. A clean break and close below $3,300 would open downside potential to the $3,250 level or even $3,200. Also, the rejection of the midrange acted as a technical catalyst that weighs Gold down.
U.S.-Iran Talks On The Way Trump announced U.S.–Iran talks scheduled for next week and mediated with Qatar’s help, focusing on nuclear and broader peace matters.
Qatar’s mediation was pivotal in securing Iran’s support for the ceasefire after discussing terms with both Tehran and President Trump.
Both sides acknowledged the truce, but initial violations were reported: Iran fired missiles at Beersheba and Israel responded with strikes on Iranian facilities – each accusing the other of breach.
Technical outlook
Bullish scenario
If Gold gains ground above the $3,330 level and a push through above the previous mid-range or equilibrium level, we might see further traction on Gold.
Another confluence that could lift Gold is if the tensions between Israel & Iran escalates and oil gets affect, this could raise safe-haven inflow on Gold.
Targets:
$3,370 – Midrange Level.
$3,400 – Psych Level / Immediate High.
Bearish scenario
If Gold does not get an upside follow-through with a series of bullish candles above $3,340, Dollar gains traction, which is unlikely for now, and Gold breaks below $3,310 – $3,300 level, this could send the bullion for a renewed downside.
Targets:
$3,300 – Psych Level / Near Immediate Low.
$3,250 – May 29 – Significant Low.
Final thoughts
While Gold remains fundamentally supported by long-term macro themes like central bank buying and inflation uncertainty, near-term direction will be decided by upcoming U.S. data and the Fed’s policy signals.
A breakout from the current range could provide a cleaner directional bias. Until then, patience is key.
A confirmed break on either side will likely invite strong momentum. Bias remains neutral to bullish unless $3,300-$3,400 is broken convincingly.
The Pound US Dollar exchange rate (GBPUSD) traded without a clear direction on Wednesday amid a lack of both UK and US data releases.
The US Dollar (USD) regained some ground on Wednesday, recovering from losses earlier in the week that followed a ceasefire between Israel and Iran, a development that initially weighed on the safe-haven currency.
As market sentiment turned more neutral midweek, this helped stabilise demand for the ‘Greenback’.
Additional support came from Federal Reserve Chair Jerome Powell, who delivered testimony to Congress reaffirming the Fed’s cautious stance on interest rate cuts.
His pushback against political pressure to ease policy bolstered expectations that rates will remain higher for longer, offering a lift to USD exchange rates during Wednesday’s European session.
The Pound (GBP) lacked clear direction on Wednesday, trading sideways against the majority of its peers as a lull in UK economic data left markets with little to go on.
After benefiting earlier in the week from improved risk appetite, Sterling ran out of steam as sentiment cooled.
With no major UK releases to drive movement, investors showed little enthusiasm for extending positions in GBP.
As a result, the Pound remained stuck in a tight range, with limited momentum to break higher or lower during Wednesday’s European session.
Looking to Thursday’s European session, movement in the GBP/USD exchange rate is likely to be influenced by a flurry of key US economic releases.
Markets will dissect the latest US durable goods orders for May alongside the final estimate of Q1 GDP.
Orders for durable goods are expected to show a strong rebound, jumping from a sharp -6.3% to a robust 8.5% increase, potentially lending support to the US Dollar.
However, this may be offset by a disappointing GDP revision, with growth in the first quarter projected to be downgraded from 2.4% to -0.2%.
If these figures meet expectations, USD exchange rate movement could be choppy as traders weigh the conflicting signals.
On the UK side, attention will fall on the latest CBI distributive trades survey.
Although not typically a major market mover, a stronger-than-expected reading could help Sterling find some traction.
Additionally, remarks from Bank of England (BoE) policymakers, including Governor Andrew Bailey, could inject fresh volatility into GBP exchange rates.
Any hints that the BoE remains cautious about near-term rate cuts may provide a further lift to the Pound.
Like this piece? Please share with your friends and colleagues:
International Money Transfer? Ask our resident FX expert a money transfer question or try John’s new, free, no-obligation personal service! ,where he helps every step of the way,
ensuring you get the best exchange rates on your currency requirements.
$KAITO is the native token and the fundamental building block of the AI-powered InfoFi network. It plays several key roles:
Driving Market Forces: $KAITO holders actively participate in shaping the network by influencing the distribution of attention within the AI-powered InfoFi ecosystem.
Network Currency: $KAITO functions as the primary medium of exchange within the Kaito ecosystem, facilitating seamless transactions and interactions.
Community Governance: $KAITO enables decentralized decision-making, allowing token holders to propose, vote on, and implement key protocol and algorithm changes. This governance mechanism ensures that the network evolves in alignment with its community’s interests, fostering a transparent and efficient AI-powered InfoFi ecosystem.
$KAITO aligns incentives, empowers participants, and fuels the growth of a fair and efficient AI-powered InfoFi network.
Resistance at $36.42 and $37.31; support at $35.29 and 50-day SMA at $33.95.
Silver price advances by nearly 1% on Wednesday, as the US Dollar depreciates due to month-end flows, along with expectations of falling US Treasury yields. At the time of writing, XAG/USD trades at $36.25, after bouncing off daily lows of $35.68.
XAG/USD Price Forecast: Technical Analysis
Even though Silver dipped to a new two-week low of $35.29 last Friday, the grey metal found bids, which pushed the spot price above $36.00 and formed a ‘morning star’ three-candle chart bullish pattern. Despite this, the Relative Strength Index (RSI) remained flat in bullish territory, suggesting that the pair is neutral to upwardly biased. If XAG/USD clears key resistance levels, then the uptrend could resume.
The first key area of interest will be the June 20 high of $36.42. Once surpassed, the next stop would be $37.00, followed by the multi-year high of $37.31.
On the flip side, if XAG/USD tumbles below the June 24 low of $35.29, expect a pullback all the way towards the 50-day Simple Moving Average (SMA) at $33.95.
XAG/USD Price Chart – Daily
Silver FAQs
Silver is a precious metal highly traded among investors. It has been historically used as a store of value and a medium of exchange. Although less popular than Gold, traders may turn to Silver to diversify their investment portfolio, for its intrinsic value or as a potential hedge during high-inflation periods. Investors can buy physical Silver, in coins or in bars, or trade it through vehicles such as Exchange Traded Funds, which track its price on international markets.
Silver prices can move due to a wide range of factors. Geopolitical instability or fears of a deep recession can make Silver price escalate due to its safe-haven status, although to a lesser extent than Gold’s. As a yieldless asset, Silver tends to rise with lower interest rates. Its moves also depend on how the US Dollar (USD) behaves as the asset is priced in dollars (XAG/USD). A strong Dollar tends to keep the price of Silver at bay, whereas a weaker Dollar is likely to propel prices up. Other factors such as investment demand, mining supply – Silver is much more abundant than Gold – and recycling rates can also affect prices.
Silver is widely used in industry, particularly in sectors such as electronics or solar energy, as it has one of the highest electric conductivity of all metals – more than Copper and Gold. A surge in demand can increase prices, while a decline tends to lower them. Dynamics in the US, Chinese and Indian economies can also contribute to price swings: for the US and particularly China, their big industrial sectors use Silver in various processes; in India, consumers’ demand for the precious metal for jewellery also plays a key role in setting prices.
Silver prices tend to follow Gold’s moves. When Gold prices rise, Silver typically follows suit, as their status as safe-haven assets is similar. The Gold/Silver ratio, which shows the number of ounces of Silver needed to equal the value of one ounce of Gold, may help to determine the relative valuation between both metals. Some investors may consider a high ratio as an indicator that Silver is undervalued, or Gold is overvalued. On the contrary, a low ratio might suggest that Gold is undervalued relative to Silver.
For posh Indians, sipping matcha not only signals a blend of global taste and mindful living, but of sophistication — making it a cultural marker that is redefining urban India
The matcha market is expanding widely because of both consumer demand for healthier options and the influence of social media.
Once a niche ingredient known only to wellness junkies and global travellers, matcha has swiftly stirred its way into India’s urban lifestyle — not just as a health trend, but as a subtle symbol of modern identity.
From iced matcha lattes in Delhi cafés to matcha-infused desserts at Mumbai’s posh bakeries, the powdered Japanese green tea has evolved into more than a drink.
For many posh Indians, sipping matcha not only signals a blend of global taste and mindful living, but of sophistication — making it a cultural marker that is redefining urban India.
Let us understand the origin of matcha, does it really have health benefits and how is it shaping India’s aesthetic economy.
Origin Of Matcha
Over 900 years ago, a Buddhist monk brought powdered tea from China’s Tang dynasty to Japan. Deeply woven into Zen Buddhist practices, matcha quickly became more than just a beverage; it was a symbol of mindfulness and ritual.
The word matcha literally means “powdered tea” in Japanese, and it has long been revered in traditional tea ceremonies. A vibrant member of the green tea family, this energising drink continues to hold cultural and ceremonial significance even today.
During the Song dynasty (960–1279 AD), tea leaves were steamed, dried, and ground into fine powder, which was whisked with hot water — very similar to how matcha is prepared today.
In the early 1100s, a Japanese Zen monk named Eisai brought powdered green tea and Chan (Zen) Buddhist tea practices from China to Japan.
The Japanese embraced this powdered tea and over centuries, refined it into matcha, a vibrant green tea made from shade-grown leaves (tencha), stone-ground into powder.
Matcha became central to the Japanese tea ceremony (chanoyu), associated with mindfulness, ritual, and simplicity.
In the 21st century, matcha has gained popularity for its anti-oxidant qualities, calming effects and rich umami flavour.
Are There Any Health Benefits Of Matcha?
Research shows that matcha contains high levels of antioxidants, particularly catechins, which are more concentrated than in regular tea. A study published in Healthline (2025) notes that matcha has significantly higher antioxidant content, with catechins contributing to cellular protection.
Matcha also contains L-theanine, an amino acid associated with improved concentration and alertness, alongside caffeine. A review by Harvard Health (2024) highlights that L-theanine, combined with caffeine, can enhance brain function, providing a calm alertness without jitteriness.
A 2015 review of 15 studies (cited in Healthline, 2025) found that green tea consumption, including matcha, is associated with a decreased risk of liver disease, potentially protecting against liver damage.
How Matcha Is Shaping India’s Aesthetic Economy
The market for matcha is expanding widely because of both consumer demand for healthier options and the influence of social media, where influencers and nutritionists regularly share matcha recipes and benefits.
“Historically the use of matcha in restaurants was limited to high end kaiseki meals and speciality establishments focussed on Japanese tradition. In 2000s, matcha was introduced in modern Japanese cafes and tea houses as a key ingredient in matcha lattes & desserts. It soon gained global popularity largely driven by social media and the rise of wellness culture owing to its various health benefits and it became a fashionable ingredient in cafes with matcha lattes, smoothies and baked goods. The use of Matcha has grown and diversified into products such as matcha infused cocktails, sauces, cheesecakes, puddings etc. The challenges faced in this segment are high cost, taste, sourcing, storage and the fact that using it in F & B is time consuming and skill based,” said Ashish Singh, COO & Culinary Director at Cafe Delhi Heights, as quoted by restaurants.in.
According to reports, the matcha market would be valued $2.36 billion in 2024 and rise at a compound annual growth rate (CAGR) of 4.17% to reach $2.89 billion by 2029.
Pallavi Shetty, Founder of Luuma House said, the global matcha market is expected to continue to grow as consumers prioritise wellness. But she said challenges such as expecting customers to know the difference between premium and low-grade matcha, high production costs, and sustainability concerns in sourcing matcha remain.
Shilpy Bisht, Deputy News Editor at News18, writes and edits national, world and business stories. She started off as a print journalist, and then transitioned to online, in her 12 years of experience. Her prev…Read More
Shilpy Bisht, Deputy News Editor at News18, writes and edits national, world and business stories. She started off as a print journalist, and then transitioned to online, in her 12 years of experience. Her prev… Read More
First Published:
Newszip India’s Matcha Moment: Why This Japanese Drink Has Become A Marker Of Aspirational Living
Bitcoin’s relief rally rose above $108,000, but the bulls may struggle to push and sustain the price above the all-time high of $111,980.
Several major altcoins have bounced off their recent lows but are not finding buyers at higher levels.
Bitcoin’s (BTC) relief rally that started on Monday following US President Donald Trump’s “total ceasefire” announcement between Israel and Iran, rose above $108,000, indicating sustained demand from the bulls.
Institutional investors did not stop buying despite increasing geopolitical tensions in the past few days, as seen from the 11 consecutive days of inflows into US spot Bitcoin exchange‑traded funds (ETFs). According to Farside Investors’ data, the ETFs attracted $3.35 billion in inflows starting June 9.
Bitcoin looks set to challenge the all-time high at $111,980, but the cryptocurrency markets may require a catalyst to hold on to the higher levels. The absence of a trigger may extend Bitcoin’s stay inside the range for more time.
Could Bitcoin break out to a new all-time high, pulling altcoins higher? Let’s analyze the charts of the top 10 cryptocurrencies to find out.
Bitcoin price prediction
Bitcoin turned up sharply from $100,000 on Monday and rose above the moving averages, indicating solid buying at lower levels.
The 20-day exponential moving average (EMA) ($105,154) has started to turn up, and the relative strength index (RSI) has jumped into positive territory, signaling that the bulls are back in the game. Sellers are expected to defend the zone between the downtrend line and the all-time high of $111,980.
If the price turns down from the overhead zone but finds support at the 20-day EMA, it signals that the bulls are buying on dips. The bulls will then again try to clear the overhead zone.
On the contrary, a slide below the moving averages suggests the BTC/USDT pair may consolidate between $111,980 and $98,200 for a while longer.
Ether price prediction
Ether (ETH) turned up from the $2,111 level on Sunday and reached the 20-day EMA ($2.473) on Tuesday.
The 20-day EMA is flattening out, and the RSI is just below the midpoint, suggesting a balance between supply and demand. If the price rises above the moving averages, the ETH/USDT pair could rally to $2,738 and then to $2,879.
Contrary to this assumption, if the price turns down from the 20-day EMA and breaks below $2,323, it signals that bears are selling on rallies. The pair may then retest the solid support at $2,111.
XRP price prediction
XRP’s (XRP) sharp bounce off the $2 support on Monday indicates that the bulls are vigorously defending the level.
Both moving averages have flattened out, and the RSI is near the midpoint, signaling that the range-bound action between $2 and $2.65 may continue for a few more days.
The next trending move is likely to begin if buyers drive the price above $2.65 or sellers pull the XRP/USDT pair below $2. If the $2 support breaks down, the pair could decline to the $1.61 level. On the upside, a break above $2.65 clears the path for a rally to $3 and then to $3.40.
BNB price prediction
BNB (BNB) turned up from the support line of the descending channel pattern on Sunday and reached the resistance line on Wednesday.
If buyers do not give up much ground from the resistance line, the prospects of a break above the channel improve. The BNB/USDT pair could ascend to $675 and, after that, to $698.
Contrarily, a break below $625 suggests that the bears are aggressively defending the resistance line. The pair may then tumble to the support line near $580, extending the stay inside the channel for a few more days.
Solana price prediction
Solana (SOL) turned up from $126 on Sunday and broke above the breakdown level of $140 on Monday.
The recovery is facing selling at the 20-day EMA ($147), but a positive sign is that the bulls have not allowed the price to slide below $140. A shallow pullback increases the possibility of a break above the 20-day EMA. If that happens, the SOL/USDT pair could climb to the 50-day simple moving average (SMA) ($160).
Sellers will have to pull and sustain the price below the $140 support to prevent the upside. The pair could then drop to $123 and eventually to $110.
Dogecoin price prediction
Dogecoin (DOGE) rebounded off the $0.14 support on Sunday, but the relief rally may face selling at the 20-day EMA ($0.17).
If the price turns down sharply from the 20-day EMA, the bears will make one more attempt to pull the DOGE/USDT pair below $0.14. If they manage to do that, the pair could tumble to the solid support at $0.10.
Alternatively, if buyers push the price above the 20-day EMA, the next stop could be the 50-day SMA ($0.20). Sellers will try to halt the recovery at the 50-day SMA, keeping the pair inside the $0.14 to $0.21 range for some more time.
Cardano price prediction
Cardano (ADA) rebounded off the $0.50 support on Sunday, but the recovery is likely to face selling at the moving averages.
If the price turns down from the 20-day EMA ($0.61), it suggests that the bears are selling on every minor rally. That increases the risk of a break below the $0.50 support. If that happens, the ADA/USDT pair could slump to $0.40.
Instead, if buyers pierce the 20-day EMA, the pair could reach the 50-day SMA ($0.69). Sellers are expected to defend the zone between the 50-day SMA and the downtrend line, but if the bulls prevail, the pair will signal a potential trend change.
If buyers maintain the price above the 20-day EMA, the HYPE/USDT pair could surge to $42.50. Buyers may find it difficult to push the price above the $42.50 to $45.80 resistance zone.
On the downside, a break below the 20-day EMA signals a lack of buyers at higher levels. That opens the doors for a fall to the 50-day SMA and later to the crucial support at $30.50.
Bitcoin Cash price prediction
Bitcoin Cash (BCH) turned up from the 20-day EMA ($450) on Wednesday, indicating that lower levels continue to attract buyers.
The price has reached the overhead resistance of $500, where the bears are expected to mount a strong defense. However, if buyers do not cede much ground to the bears, it increases the likelihood of a break above $500. If that happens, the BCH/USDT pair could surge to $550.
This positive view will be invalidated in the near term if the price turns down and breaks below the 50-day SMA ($424). The pair may then plunge to $375.
Sui price prediction
Sui (SUI) turned up sharply on Monday and reached the 20-day EMA ($2.94) on Tuesday, where the bears are posing a stiff challenge.
The downsloping 20-day EMA and the RSI in the negative territory signal that bears hold the edge. Sellers will try to pull the price toward the $2.29 to $2 support zone, but the buyers are likely to have other plans.
The bulls will try to arrest the decline and push the price above the 20-day EMA. If they manage to do that, the SUI/USDT pair could climb to the 50-day SMA ($3.39). Such a move suggests the correction may be over.
This article does not contain investment advice or recommendations. Every investment and trading move involves risk, and readers should conduct their own research when making a decision.
Pfizer’s stock price (PFE) rose in latest intraday trading and tackled the pivotal resistance of $24.50, amid the dominance of the upward correctional wave in the short term, with ongoing positive pressure due to trading above the 50-day SMA, coupled with positive divergence from the Stochastic after reaching oversold levels compared to the stock’s movements.
Therefore we expect the stock to rise as long as it breaches the aforementioned resistance of $24.50, targeting the next one at $26.50.
Nevertheless, what happens next will be more revealing. Dynamic support for the intermediate uptrend, beginning from January, is being tested. Gold needs to recover from support around the 50-Day MA if it is to retain the current trajectory. A decline below Tuesday’s low of $3,295 puts it at risk of dropping below an interim swing low at $3,293, which is part of the near-term uptrend that began following a test of support at the 50-Day MA. Other lower price levels that subsequently could see signs of support include the intersection of an uptrend and downtrend line (blue) around $3,272. There is also a top rising trend channel line (purple) crossing at the same point. Then, a little lower is a prior interim swing low at $3,245.
Several Lines Converge
The purple rising channel represents the upswing that began from the October 2023 lows. A decisive bull breakout of the channel triggered on April 10, followed by a retracement that successfully tested the price area around the line as support. The current pullback is a second test of support near the top purple channel line.
It represents a longer trend than a shorter rising trend channel (blue) that began from the January lows. The point of highlighting where the three lines meet is that a decline below $3,272 will mean that both a downtrend line and top channel line have been broken. If price then stays below that price level, it will confirm the bearish sentiment.
Strength Needed Above $3,370
Alternatively, support around the 50-Day MA holds and leads to a bullish reversal. An early sign of strength would be seen on a rally above today’s high, however, that would not be convincing enough to confirm a bullish reversal. Rather, a decisive rally above Tuesday’s high of $3,370 would be needed.
For a look at all of today’s economic events, check out our economic calendar.
A new study shows that pairing fish oil supplements with weight training can enhance antioxidant defenses, improve lipid levels, and sharpen neuromuscular function, even in already fit young men.
Among other measures for a healthy lifestyle, omega-3 fatty acid supplements are popular due to their anti-inflammatory and antioxidant effects. Recently, a team of researchers examined the effects of omega-3 supplements when combined with strength training in healthy men. The report was published in the journal Nutrients.
Introduction
Exercise, nutrition, and stress management are the traditional pillars of a healthy lifestyle. With the rise of specialized and intensive physical training modalities, alternative solutions are now needed to maintain health and enhance physical performance. Omega-3 supplements are commonly used by physically active individuals and professional athletes.
Oxidative stress during exercise increases free radical production. When this overwhelms the muscle cell’s antioxidant capacity, it results in inflammation and muscle cell damage, adversely affecting health and muscle performance.
Sports nutrition aims to prevent this by providing adequate energy and nutrition during strength training and intense exercise, including omega-3 supplements. These fats, such as EPA and DHA, must be obtained from the diet, primarily from oily fish and plant foods like walnuts, chia seeds, flaxseeds, Brussels sprouts, and kidney beans, as the body cannot synthesize them. Both EPA and DHA are key anti-inflammatory molecules that promote heart and brain health.
The conversion of EPA and DHA from plant-based sources is limited, making seafood or supplementation preferable for optimal intake.
In athletes, omega-3 supplements have been shown to reduce fatigue and inflammation after exercise. They enhance muscle protein synthesis in response to anabolic stimuli via the mTOR (mechanistic target of rapamycin) signaling pathway. This builds muscle mass and strength.
They accelerate muscle recovery and adaptation to training. They also enhance nerve transmission and nerve membrane fluidity while reducing inflammation. Yet few studies have explored how omega-3 supplements affect the outcome of resistance training.
The current study assessed changes in physiological and physical adaptation to exercise training. It employed biochemical markers and indicators of neurological and functional alterations following exercise. It aimed to garner evidence for future nutritional strategies to optimize athletic recovery and performance over the long term.
About the study
The study included 30 physically active male participants (aged 18–30 years) who were randomized into either an experimental group, undergoing standardized resistance training three times a week and receiving daily 3150 mg of omega-3 supplements (1620 mg EPA and 1170 mg DHA), or a control group with only resistance training. The study period was eight weeks.
Numerous biomarkers were analyzed in this study. They included inflammatory mediators that indicate immune activation and tissue stress following high-intensity exercise. Their elevation can predict poor exercise recovery and training adaptation. Glutathione and malondialdehyde serve as markers of oxidative capacity, while blood lipids indicate cardiometabolic health and physical fitness.
Brain-derived neurotrophic factor (BDNF), dopamine, and serotonin are biomarkers of neuronal health and function. These are deeply involved in cognitive flexibility, balancing inhibitory and excitatory neurotransmitters, synaptic plasticity that helps build neuronal pathways, and neuromuscular function.
Study findings
Omega-3 supplements markedly improved physiological markers of exercise recovery and training adaptation after resistance training. They had significant anti-inflammatory effects while also increasing antioxidant capacity. In addition, they improved markers of cardiometabolic risk, neurological function, and motor development.
Lipid markers
Lipid markers showed an 8% to 10% reduction in ‘bad’ cholesterol – low-density lipoprotein (LDL) cholesterol and triglycerides – and an 11% rise in ‘good’ high-density lipoprotein (HDL) cholesterol, suggesting a lower cardiovascular risk.
Animal studies suggest that higher unsaturated fatty acids increase lipid oxidation and inhibit lipid synthesis. Fish oil exerts more potent cholesterol-regulating effects than monounsaturated fatty acids because of its polyunsaturated fats.
Inflammation and oxidative stress
Inflammatory markers like interleukin-6 (IL-6) and TNF-α were reduced by ~27–41%. Antioxidant capacity mounted, with 15% higher glutathione and 33% lower malondialdehyde levels.
Neuromuscular markers
Neurological markers like BDNF, dopamine, and serotonin also increased by 12–19%. Physical performance improved as shown by increased muscular strength and power. So did speed, agility, and reflexes, compared to the controls.
The higher DHA concentrations enhanced the functional activation of fast-twitch type II muscle fibers and led to improvements in neuromuscular power, reflecting effective neuromuscular adaptation. These improvements may be partly attributed to increased membrane fluidity and enhanced neurotransmitter sensitivity, facilitating faster motor unit recruitment and synaptic efficiency. Omega-3 supplementation also optimized energy metabolism and enhanced mitochondrial function, improving ATP production and boosting cell recovery.
Implications
“The convergence of these anti-inflammatory, anabolic, and structural membrane effects likely explains the superior strength gains observed in this study.” These changes could help athletes improve their performance significantly, especially in competitive situations where explosive movement or increased responsiveness can make a substantial difference in the outcome.
Importantly, such alterations occurred in resistance-trained adults, who are typically slow to manifest such improvements. These effects remain highly relevant, therefore, despite the lack of statistical significance in most group × time interactions.
Earlier mechanistic research supports these findings, showing that omega-3 fatty acids modulate peroxisome proliferator-activated receptor gamma coactivator-1α (PGC-1α), a key regulator of mitochondrial function.
Properly regulated physical activity, combined with optimal nutritional support, can potentially reset the metabolism throughout the body. Omega-3 fatty acids play a crucial role in this, as they act on multiple organs to enhance metabolic resilience. The skeletal muscle, in this paradigm, is thus seen as both a contractile locomotor apparatus and an endocrine organ that affects gene transcription to optimize the functioning of multiple systems by metabolic responses to resistance training.
Conclusion
These findings suggest that omega-3 supplements can be combined with strength training to enhance physiological function and physical performance. “This combination may represent a promising strategy for optimizing athletic adaptations and recovery in physically active populations.”
Given the small, homogeneous sample and lack of placebo control, further research should include diverse populations and utilize other physical training platforms to extend these findings and provide greater generalizability.
Journal reference:
Okut, S., Ozan, M., Buzdagli, Y., et al. (2025). The Effects of Omega-3 Supplementation Combined with Strength Training on Neuro-Biomarkers, Inflammatory and Antioxidant Responses, and the Lipid Profile in Physically Healthy Adults. Nutrients. DOI: 10.3390/nu17132088, https://www.mdpi.com/2072-6643/17/13/2088
A bold price prediction is making waves across the XRP community. Multiple viral posts on X (formerly Twitter) claim that Ripple Co-founder Chris Larsen said XRP could surge past $1,000. But, there’s a condition. He expects such a surge only if Ripple managed to capture just 10% of SWIFT’s global payment volume.
The claim has got XRP fans into action, with a few taking it as a bold prophecy of the token’s long-term value. Some have referred to the remark as anything but optimism. They called it a “calculated vision” based on XRP’s velocity, usability, and rising institutional adoption.
A closer examination suggests that there is no definite source for this statement. Larsen never makes such a specific price projection or explicitly equates the XRP value with SWIFT transaction volume in any public interviews, speeches, or official documents.
What’s true is that Larsen has repeatedly spoken of Ripple’s vision to change international payments and displace archaic systems such as SWIFT. Even Ripple CEO Brad Garlinghouse estimated five years ago that XRP stood a chance of taking up to 14% of SWIFT’s global transaction volume in five years.
Notably, this $1,000 XRP claim has gained even more traction amid recent rumors of a potential Ripple–SWIFT collaboration. Although unconfirmed, the overlap of these rumors has fueled speculation and boosted attention in the XRP community. This shows how fast price claims can go viral.