About Editorial team of BIPNs

Main team of content of bipns.com. Any type of content should be approved by us.
25 06, 2025

Binance Coin (BNB) Price Prediction 2025, 2026-2030

By |2025-06-25T00:08:18+03:00June 25, 2025|Crypto News, News|0 Comments

Binance Coin traders use a variety of tools to try and determine the direction in which the BNB market is likely to head next. These tools can roughly be divided into indicators and chart patterns. When trying to predict the Binance Coin price, traders also try to identify important support and resistance levels, which can give an indication of when a downtrend is likely to slow down and when an uptrend is likely to stall.

Binance Coin Price Prediction Indicators

Moving averages are among the most popular Binance Coin price prediction tools. As the name suggests, a moving average provides the average closing price for BNB over a selected time frame, which is divided into a number of periods of the same length. For example, a 12-day simple moving average for BNB is a sum of BNB’s closing prices over the last 12 days which is then divided by 12.

In addition to the simple moving average (SMA), traders also use another type of moving average called the exponential moving average (EMA). The EMA gives more weight to more recent prices, and therefore reacts more quickly to recent price action.

50-day, 100-day and 200-day moving averages are among the most commonly used indicators in the crypto market to identify important resistance and support levels. If the BNB price moves above any of these averages, it is generally seen as a bullish sign for Binance Coin. Conversely, a drop below an important moving average is usually a sign of weakness in the BNB market.

Traders also like to use the RSI and Fibonacci retracement level indicators to try and ascertain the future direction of the BNB price.

How to read Binance Coin charts and predict price movements?

Most traders use candlestick charts, as they provide more information than a simple line chart. Traders can view candlesticks that represent the price action of Binance Coin with different granularity – for example, you could choose a 5-minute candlestick chart for extremely short-term price action or choose a weekly candlestick chart to identify long-terms trends. 1-hour, 4-hour and 1-day candlestick charts are among the most popular.

Let’s use a 1-hour candlestick chart as an example of how this type of price chart gives us information about opening and closing prices. The chart is divided into “candles” that give us information about Binance Coin’s price action in 1-hour chunks. Each candlestick will display BNB’s opening price, closing price, as well as the highest and lowest prices that Binance Coin reached within the 1-hour period.

It’s also important to pay attention to the color of the candle – a green candle means that the closing price was higher than the opening price, while a red candle tells us the opposite. Some charts will use hollow and filled candlestick bodies instead of colors to represent the same thing.

What affects the price of Binance Coin?

Just like with any other asset, the price action of Binance Coin is driven by supply and demand. These dynamics can be influenced by fundamental events such as block reward halvings, hard forks or new protocol updates. Regulations, adoption by companies and governments, cryptocurrency exchange hacks, and other real-world events can also affect the price of BNB. The market capitalization of Binance Coin can change significantly in a short period of time.

When trying to make a Binance Coin forecast, many traders also try to monitor the activity of BNB “whales”, which are entities and individuals that control large amounts of BNB. Since the Binance Coin market is relatively small compared to traditional markets, “whales” can single-handedly have a big influence on Binance Coin’s price movements.

Bullish and bearish price prediction patterns

Some traders try to identify candlestick patterns when making cryptocurrency price predictions to try and get an edge over the competition. Some candlestick formations are seen as likely to forecast bullish price action, while others are seen as bearish.

Here are some of the most commonly followed bullish candlestick patterns:

Here are some common bearish candlestick patterns:

  • Hammer
  • Bullish Engulfing
  • Piercing Line
  • Morning Star
  • Three White Soldiers
  • Bearish Harami
  • Dark Cloud Cover
  • Evening Star
  • Shooting Star
  • Hanging Man

DISCLAIMER: Not Investment Advice

The information provided is for general information purposes only. No information, materials, services and other content provided on this page constitute solicitation, recommendation, endorsement or any financial, investment, or other advice. Seek independent professional consultation in the form of legal, financial, and fiscal advice before making any investment decision.


Source link

24 06, 2025

Impossible Cloud Network Partners With Moonveil To Elevate Decentralization In Web3 Gaming

By |2025-06-24T22:17:40+03:00June 24, 2025|News, NFT News|0 Comments


Impossible Cloud Network, a well-known decentralized cloud ecosystem, has announced its new partnership with Moonveil, an inclusive web3 gaming platform. The collaboration focuses on establishing a completely decentralized ecosystem for Web3 gaming. The platform disclosed this joint effort in a recent social media post on its official X account.

Impossible Cloud Network and Moonveil to Bring Real Decentralization to Web3 Gaming

As the collaboration includes, Impossible Cloud Network is integrating with Moonveil to enhance decentralization in the Web3 gaming sector. The initiative aims to decrease dependence on conventional Web2 infrastructure while developing a resilient and entirely Web3-native gaming framework. This takes into account the inclusion of tokenomics as well as the broader gameplay infrastructure.

The present blockchain-based games often depend on centrally controlled services, such as AWS, for scalability. In this respect, both the platforms are co-developing a forum in which game infrastructure, liquidity mechanisms, and identity systems are driven by community-led networks. ICN’s Managing Director, Sebastian Pfeiffer, also commented on this development. He said that the collaboration clarifies that decentralization does not require any compromise on scalability or performance.

Powering Decentralized Gaming with Scalable Web3 Infrastructure

Moonveil’s integration permits ICN to deliver a future-proof, completely sovereign network that backs even the gaming environments that are most demanding. Apart from that, Moonveil’s founder, MJ, also expressed enthusiasm about this mutual endeavor. As per MJ, this remarkable synergy is a notable step to boost decentralization of backend and game mechanics on equal basis.

Thus, the Impossible Cloud Network’s collaboration with Moonveil offers a cutting-edge infrastructure that presently handles more than 1B operations per week for over 1,000 enterprise consumers. Simultaneously, Moonveil delivers scalability, identity mechanisms, efficient gaming layers, and asset interoperability. Together, both the companies are setting new standards in decentralization within the Web3 gaming world.


Source link

24 06, 2025

XAG/USD has a key support level at $35.50

By |2025-06-24T22:16:32+03:00June 24, 2025|Forex News, News|0 Comments


  • Silver is hesitating below $36.40 with risk appetite undermining demand for safe havens.
  • US Dollar’s weakness is keeping Silver prices from depreciating further.
  • XAG/USD: A breach of $35.50 would confirm a bearish H&S formation.

Silver (XAG/USD) is bouncing up from a key support area at $35.50 on Tuesday, following a three-day reversal from multi-year highs at $37.35. The pair is drawing support from US Dollar weakness amid the risk-on mood, but the weak demand for safe havens is also keeping Silver upside attempts limited.

Investors are celebrating what the US President, Donald Trump, announced as a “complete and total ceasefire”, which only hours later is under threat amid accusations of violation from Iran. Israel has vowed a strong response in case of attack, but so far, risk appetite prevails.

On the macroeconomic domain, further calls for Fed easing, this time from the Vice Chair for Supervision Bowman, have underscored the divergence within the Federal Reserve’s committee and increased bearish pressure on the US Dollar ahead of Powell’s testimony to Congress, due later today.

XAG/USD: The $35.50 is the neckline of a bearish H&S formation

A look at the 4-hour charts, and we see the pair moving without a clear bias, with upside attempts limited at below Monday’s high, at $36.40. The Doji candles on the daily chart indicate a hesitant market following a three-day reversal from long-term highs.

The broader trend remains positive, but the lower highs this week anticipate a potential Head & Shoulders pattern, which is often a signal of a trend shift. A break of the neckline, at $35.50, suggests that there is room for a deeper correction, aiming at $34.10 (June 4 low) and the $32.70 area, which held prices on May 22, 27, 28 and 30.

XAG/USD 4-Hour Chart

Silver FAQs

Silver is a precious metal highly traded among investors. It has been historically used as a store of value and a medium of exchange. Although less popular than Gold, traders may turn to Silver to diversify their investment portfolio, for its intrinsic value or as a potential hedge during high-inflation periods. Investors can buy physical Silver, in coins or in bars, or trade it through vehicles such as Exchange Traded Funds, which track its price on international markets.

Silver prices can move due to a wide range of factors. Geopolitical instability or fears of a deep recession can make Silver price escalate due to its safe-haven status, although to a lesser extent than Gold’s. As a yieldless asset, Silver tends to rise with lower interest rates. Its moves also depend on how the US Dollar (USD) behaves as the asset is priced in dollars (XAG/USD). A strong Dollar tends to keep the price of Silver at bay, whereas a weaker Dollar is likely to propel prices up. Other factors such as investment demand, mining supply – Silver is much more abundant than Gold – and recycling rates can also affect prices.

Silver is widely used in industry, particularly in sectors such as electronics or solar energy, as it has one of the highest electric conductivity of all metals – more than Copper and Gold. A surge in demand can increase prices, while a decline tends to lower them. Dynamics in the US, Chinese and Indian economies can also contribute to price swings: for the US and particularly China, their big industrial sectors use Silver in various processes; in India, consumers’ demand for the precious metal for jewellery also plays a key role in setting prices.

Silver prices tend to follow Gold’s moves. When Gold prices rise, Silver typically follows suit, as their status as safe-haven assets is similar. The Gold/Silver ratio, which shows the number of ounces of Silver needed to equal the value of one ounce of Gold, may help to determine the relative valuation between both metals. Some investors may consider a high ratio as an indicator that Silver is undervalued, or Gold is overvalued. On the contrary, a low ratio might suggest that Gold is undervalued relative to Silver.


Source link

24 06, 2025

USD/JPY Forecast: Trade Deal Stalemate and Oil Risks Cloud the Outlook

By |2025-06-24T22:14:18+03:00June 24, 2025|Forex News, News|0 Comments

  • USD/JPY is stuck in a safe haven standoff with no clear winner.
  • With central banks cautious and Middle East risks simmering, a breakout could hinge on geopolitics.
  • All eyes on 148—can bulls push through, or will the range hold yet again?
  • Looking for actionable trade ideas to navigate the current market volatility? Subscribe here to unlock access to InvestingPro’s AI-selected stock winners.

On the currency pair, where both components are considered so-called safe havens, we’re observing a tug-of-war with no clear advantage for either side. On one hand, central banks remain passive, having left interest rates unchanged during their June meetings. On the other hand, the market is clearly uncertain about developments in the Middle East. Under these conditions, we may see a prolonged sideways trend—although a resumption of the conflict in the Middle East could spark increased volatility, not only in this market but also in the market. Beyond military developments, attention should also be paid to the ongoing Washington–Tokyo trade agreement negotiations, which, according to official statements, have not led to any breakthroughs at this stage.

Bank of Japan Remains With Cautious Stance

At the ’s latest meeting earlier this month, interest rates were once again left unchanged. This stance may come as a surprise, given that inflation has remained above the Bank’s defined target for more than three years. One symbolic example is the price of rice, which rose by more than 100% year-on-year in May. In response, the Japanese government decided to release strategic reserves of the commodity in an effort to curb price increases. However, this move is likely to have only a short-term impact (similar to previous BOJ interventions in the foreign exchange market) and is far from sufficient over the longer term.

Figure 1: Inflation Dynamics in Japan


Japan’s monetary policy officials continue to express concern about the pace of , especially amid uncertainty regarding the outcome of U.S. trade negotiations. According to BOJ Governor Ueda’s latest statement, the Bank is prepared to raise interest rates further in the coming months. However, this seems more like verbal intervention than a firm signal of concrete action.

At its June meeting, the effectively maintained the status quo—retaining its broadly hawkish stance but leaving the door open for possible rate cuts in September, depending on the development of the tariff war. Meanwhile, several dovish voices have emerged in recent days suggesting that another cut could come as early as July. Among these are Michelle Bowman and Christopher Waller. Bowman was recently nominated by Donald Trump to serve as Vice Chair for Supervision at the Federal Reserve. Her views may align closely with those of the current President, who has made it clear he supports steep interest rate cuts.

Key Resistance on USDJPY Defended

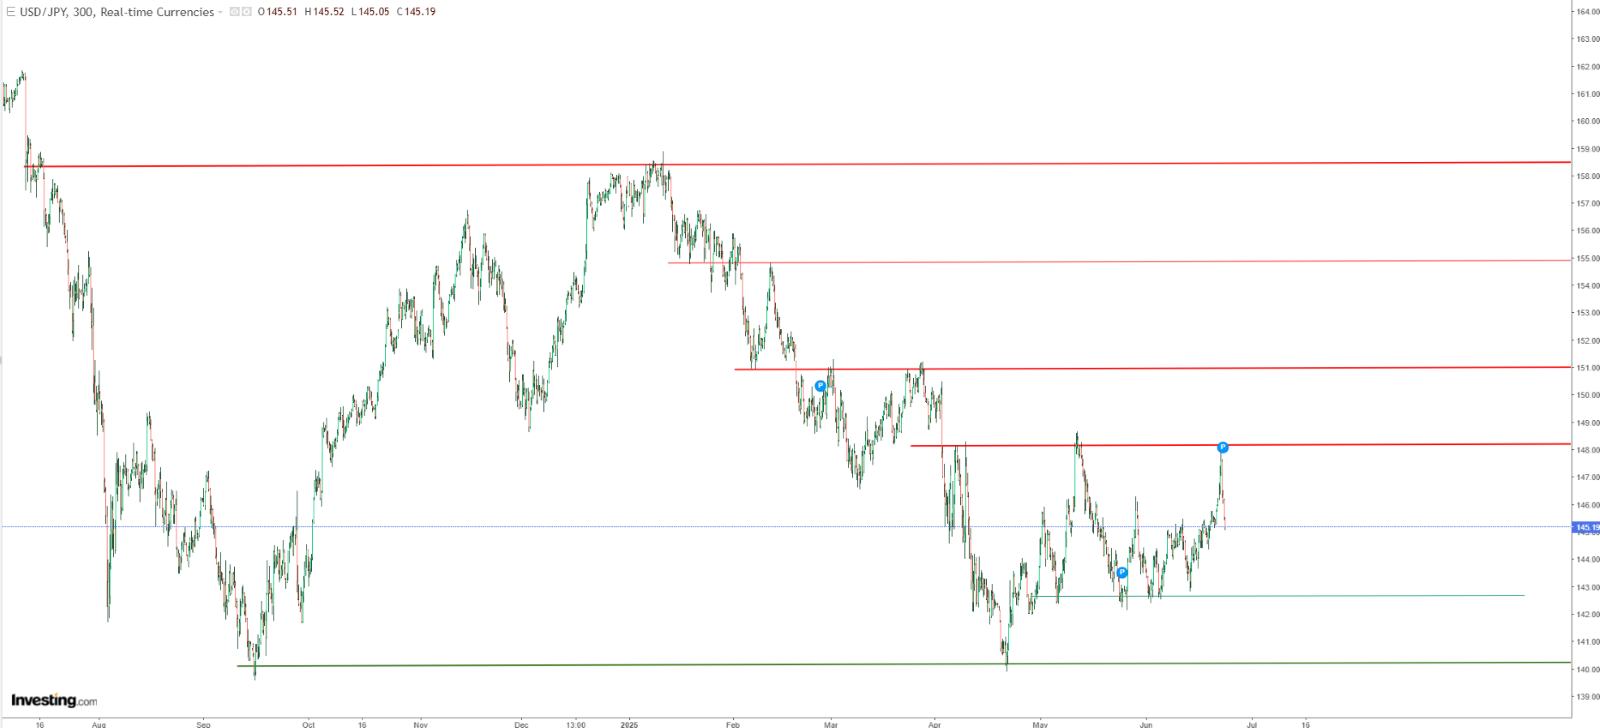
The latest bullish push on the USDJPY pair led to a test of a key resistance zone in the 148 yen per dollar region. However, any attempt to break above this level was quickly met with a strong wave of selling pressure, keeping the pair locked in a medium-term consolidation.

Figure 2: Technical Analysis of USDJPY

USDJPY Chart
The next directional move will likely depend on whether the pair eventually breaks out of the 143–148 yen per dollar range—and in which direction.

****

Be sure to check out InvestingPro to stay in sync with the market trend and what it means for your trading. Whether you’re a novice investor or a seasoned trader, leveraging InvestingPro can unlock a world of investment opportunities while minimizing risks amid the challenging market backdrop.

Subscribe now and instantly unlock access to several market-beating features, including:

  • ProPicks AI: AI-selected stock winners with a proven track record.
  • InvestingPro Fair Value: Instantly find out if a stock is underpriced or overvalued.
  • Advanced Stock Screener: Search for the best stocks based on hundreds of selected filters and criteria.
  • Top Ideas: See what stocks billionaire investors such as Warren Buffett, Michael Burry, and George Soros are buying.

ProPicks AI

Disclaimer: This article is written for informational purposes only. It is not intended to encourage the purchase of assets in any way, nor does it constitute a solicitation, offer, recommendation or suggestion to invest. I would like to remind you that all assets are evaluated from multiple perspectives and are highly risky, so any investment decision and the associated risk belongs to the investor. We also do not provide any investment advisory services.


Source link

24 06, 2025

Is It Better to Start Your Day With Coffee or Tea? Here’s What Health Experts Recommend

By |2025-06-24T22:11:20+03:00June 24, 2025|Dietary Supplements News, News|0 Comments


Key Takeaways

  • Both coffee and tea are rich in antioxidants and offer unique health benefits, from brain and heart support to improved metabolism and immune function.
  • Coffee provides a stronger, faster energy boost, while tea offers a gentler lift with added calm from L-theanine—making your best pick dependent on how your body handles caffeine.
  • The right choice depends on your personal health needs, energy levels, and how each one makes you feel.

For many people, no morning routine is complete without a caffeinated beverage. This usually involves coffee or tea—two drinks that are very popular, especially at the start of the day. However, if overall wellness is at the top of your mind, you might wonder if either drink is superior in terms of health benefits. To find out, we asked dietitians to call out the better morning drink, plus how each beverage affects the body.

Benefits of Drinking Coffee 

If you’re a coffee fan, you’ll be glad to know that there are many benefits to a cup of joe. “Brewed coffee provides antioxidants, including chlorogenic acid and other polyphenols,” shares registered dietitian Maddie Pasquariello, MS, RDN. And as Pasquariello notes, antioxidants are compounds that protect the body from cellular damage by scavenging for free radicals. This may help reduce the risk of chronic conditions, such as heart disease and cancer. 

“The antioxidants in coffee can also support brain health, metabolic function, and liver detox pathways,” explains registered dietitian Samantha Peterson, MS, RD. Even the caffeine in coffee has some health benefits, as it can help protect against inflammation, according to Pasquariello. 

  • Maddie Pasquariello, MS, RDN, is a registered dietitian nutritionist and founder of Nutrition With Maddie
  • Samantha Peterson, MS, RD, registered dietitian and founder of Simply Wellness

Benefits of Drinking Tea 

As with coffee, caffeinated teas like green and black tea are beloved morning brews. They also boast their own list of impressive benefits for the body. According to Peterson, green and black teas are antioxidant powerhouses, as they’re rich in catechins—particularly epigallocatechin gallate (EGCG) in green tea and theaflavins in black tea. “These antioxidants support cardiovascular health, metabolic shifts, hormonal balancing, and immune resilience,” Peterson says. “Plus, tea provides a gentler energy lift thanks to its L-theanine content, which promotes a calm, focused alertness without the jitters or cortisol spike that some people experience with coffee.”

Is Coffee or Tea the Better Morning Drink? 

Ready for a plot twist? Neither coffee or tea is superior to drink in the morning. “Overall, the difference between swapping tea for coffee or vice versa won’t make a huge difference when it comes to your overall health, with all else being equal,” shares Pasquariello. 

And while it is possible you could get more polyphenols and caffeine by drinking black coffee instead of black or green tea, nutrition is much more complex. “Your health is made up of so many more habits and components, [so] you probably wouldn’t notice a huge difference in terms of preventing chronic disease or improving overall health,” Pasquariello adds.

How to Choose

If neither drink is technically better, how do you choose between coffee vs. tea? Consider factors like energy stability, mood, focus, digestion, and sleep quality, advises Peterson. “It’s less about one being ‘right’ and more about honoring your unique needs,” she explains.

For example, if you need a stronger cognitive kickstart or you’re engaging in high-intensity mental or physical work in the morning, coffee might be the way to go. That’s because it offers a more immediate energy boost, per Peterson. “It’s also a great option for those who metabolize caffeine well and don’t experience negative side effects like anxiety, digestive upset, or disrupted sleep,” she says. 

In contrast, tea provides a calmer, more sustained energy boost. This might be the better option if coffee makes you feel jittery, or you find it tough to drink on an empty stomach, notes Pasquariello. “The same goes if you tend to wake up with anxiety, have a slow caffeine metabolism, or you’re working on hormonal balance, adrenal health, or gut healing,” Peterson explains. Finally, tea can be a good option if you struggle to stay hydrated with water alone (though plain water is always optimal, of course), according to Pasquariello. 

“Ultimately, the right choice depends on your body, goals, and how you respond to caffeine,” Peterson concludes.


Source link

24 06, 2025

ETH eyes recovery as Israel-Iran conflict spills into US military base

By |2025-06-24T22:07:23+03:00June 24, 2025|Crypto News, News|0 Comments

Ethereum price today: $2,300

  • Ethereum experienced a surge in volatility following the US involvement in the Israel-Iran conflict over the weekend.
  • Ethereum investors have booked $750 million in combined realized profits and losses since the market began declining on Friday.
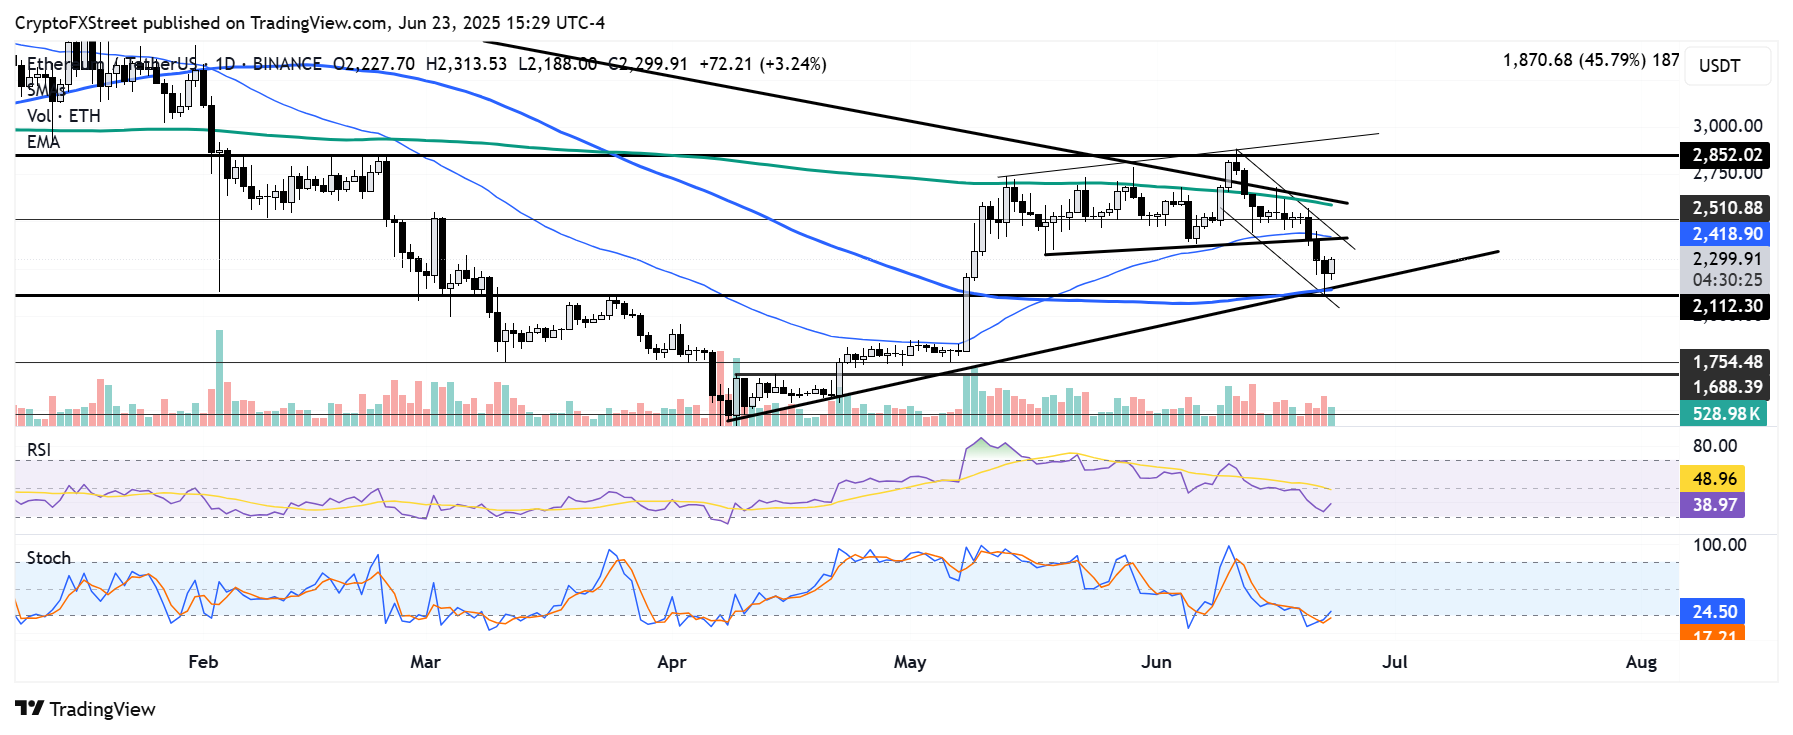
  • ETH found support at $2,110, near the lower boundary of a broader symmetrical triangle and the 100-day SMA.

Ethereum (ETH) is up 5% on Monday, showing signs of recovery amid reports that Iran has launched missiles at a United States (US) military base in Qatar. The geopolitical tensions sparked an increase in ETH volatility, resulting in a rise in realized profits and losses over the weekend.

Ethereum volatility and short-term holders selling spikes amid recovery signs

Ethereum briefly retreated from $2,300 but quickly bounced back after Iran reportedly launched missiles at a US military base in Qatar, according to Axios. The strike comes as a retaliation for the US attack on three Iranian nuclear sites over the weekend — a move that pushed ETH toward $2,100.

“The market remains at an inflection point, with digital assets straddling the line between risk-on momentum and risk-off defensiveness amid ongoing geopolitical uncertainty,” wrote QCP analysts in a Monday note.

Most ETH long traders bore the consequences of the sustained price drop, with long liquidations reaching nearly $600 million since Friday, according to Coinglass data.

The price decline also saw investors booking about $500 million in realized profits and over $250 million in losses from their selling activity during the same period. The selling was spearheaded by short-term holders, as evidenced by the sharp plunge in the 90 and 180-day Mean Coin Age. A drop in the Mean Coin Age across the different age cohorts represents a rising distribution and vice versa for an increase.

ETH Network Realized Profit/Loss & Mean Coin Age. Source: Santiment

“ETH’s drawdown [has] been accompanied by a 15-point jump in 7-day implied volatility (IV) to 83%, reflecting increased downside hedging and uncertainty,” wrote Sean Dawson, Head of Research at crypto options exchange Derive, in a note to investors on Monday.

“The surge in short-dated IV […] confirms the market is bracing for more instability. Volatility markets are telling us this isn’t over.”

However, investors on the spot market are buying the dip at a modest pace, with three consecutive days of exchange net outflows reaching nearly 110,000 ETH on Monday, according to CryptoQuant’s data.

US spot Ethereum ETFs also stretched their weekly inflow streak, recording $124 million in a ninth consecutive week of net inflows, according to a CoinShares report on Monday.

Outflows in crypto exchanges represent buying and vice versa for inflows. In exchange-traded funds (ETFs), the reverse is true.

Ethereum Price Forecast: ETH finds support at $2,110, eyes recovery

After breaking below the lower boundary of a smaller symmetrical triangle and the 50-day Exponential Moving Average (EMA) on Friday, ETH declined over 10% during the weekend. It eventually bounced off the $2,110 key support level near the lower boundary of a broader symmetrical triangle and the 100-day Simple Moving Average (SMA).

ETH/USDT daily chart

If ETH stages a recovery and flips the upper boundary of a descending channel, it could retest the resistance near $2,500. A successful move above this resistance could see ETH rise toward the $2,850 level.

On the downside, ETH could decline further toward $1,800 if it fails to hold the $2,110 key support level.

The Relative Strength Index (RSI) and Stochastic Oscillator (Stoch) are below their neutral levels but trending upward, indicating a slowdown in bearish momentum.


Source link

24 06, 2025

Hedera Hashgraph price trapped in a hesitant place – Forecast today

By |2025-06-24T20:15:19+03:00June 24, 2025|Forex News, News|0 Comments


Hedera Hashgraph’s currency price settled higher in latest intraday trading, boosted by trading above the 50-day SMA, but still dominated by the main downward trend, with negative signals from the Stochastic after reaching overbought levels compared to the price’s movements.


Therefore we expect the price to decline and target the support of $0.1385, provided the resistance of $0.1616 holds on.


Today’s price forecast: Bearish


Source link

24 06, 2025

EUR/USD, USD/JPY and AUD/USD Forecast – US Dollar Looks Weak in Early Tuesday Trading

By |2025-06-24T20:13:30+03:00June 24, 2025|Forex News, News|0 Comments

Scan QR code to install app

Important DisclaimersThe content provided on the website includes general news and publications, our personal analysis and opinions, and contents provided by third parties, which are intended for educational and research purposes only. It does not constitute, and should not be read as, any recommendation or advice to take any action whatsoever, including to make any investment or buy any product. When making any financial decision, you should perform your own due diligence checks, apply your own discretion and consult your competent advisors. The content of the website is not personally directed to you, and we does not take into account your financial situation or needs.The information contained in this website is not necessarily provided in real-time nor is it necessarily accurate. Prices provided herein may be provided by market makers and not by exchanges.Any trading or other financial decision you make shall be at your full responsibility, and you must not rely on any information provided through the website. FX Empire does not provide any warranty regarding any of the information contained in the website, and shall bear no responsibility for any trading losses you might incur as a result of using any information contained in the website.The website may include advertisements and other promotional contents, and FX Empire may receive compensation from third parties in connection with the content. FX Empire does not endorse any third party or recommends using any third party’s services, and does not assume responsibility for your use of any such third party’s website or services.FX Empire and its employees, officers, subsidiaries and associates, are not liable nor shall they be held liable for any loss or damage resulting from your use of the website or reliance on the information provided on this website.Risk DisclaimersThis website includes information about cryptocurrencies, contracts for difference (CFDs) and other financial instruments, and about brokers, exchanges and other entities trading in such instruments. Both cryptocurrencies and CFDs are complex instruments and come with a high risk of losing money. You should carefully consider whether you understand how these instruments work and whether you can afford to take the high risk of losing your money.FX Empire encourages you to perform your own research before making any investment decision, and to avoid investing in any financial instrument which you do not fully understand how it works and what are the risks involved.

Source link

24 06, 2025

Could Taurine Supplements Slow Down Aging?

By |2025-06-24T20:10:22+03:00June 24, 2025|Dietary Supplements News, News|0 Comments


Taurine is a sulfur-containing amino acid made by the body. It’s also found in protein-rich foods, energy drinks, and supplements. Some research suggests that it may help delay aging, but newer studies have cast doubt on how well it works as an anti-aging supplement.

How Does Taurine Work?

Supporters of taurine say it may promote relaxation, sleep, brain function, and athletic performance. Some also believe it can support metabolic and heart health by regulating blood pressure, boosting cardiac fitness, and improving blood vessel function.

“Taurine may possess antioxidant properties, potentially contributing to improved cardiovascular health,” said Anastasiya Shor, PharmD, BCPS, the director of the Drug Information Center and Assistant Professor at Touro College of Pharmacy.

There’s a belief that taurine levels naturally decrease with age, which could lead to a number of age-related diseases. Some say that boosting taurine levels can help improve health and extend lifespan, but the research on taurine’s anti-aging benefits is thin.

New Research Questions Taurine’s Anti-Aging Effects

Shor noted that current evidence supporting taurine’s anti-aging effects primarily stems from animal studies and small-scale human trials, making it difficult to draw definitive conclusions about its effectiveness.

Existing human clinical trials have found that taurine can increase muscle strength and exercise capacity, according to Vijay K. Yadav, PhD, a biogerontologist and associate professor at Rutgers University’s Institute for Infectious & Inflammatory Diseases.

In 2023, Yadav co-authored a study indicating that blood concentrations of taurine decline with age in mice, monkeys, and humans. The study found that taurine supplementation improved lifespan in mice and healthspan in monkeys, while taurine deficiency was associated with poor health and reduced lifespan in mice.

However, a recent study funded by the National Institutes of Health found that circulating taurine levels do not consistently decline with age and concluded that low taurine concentrations are unlikely to serve as a reliable biomarker of aging.

Yadav’s 2023 study focused on taurine levels from birth to age 60, while the recent study focused on ages 30 to 90. The data remain consistent when considering the overlapping years covered in both studies.

Yadav said that’s because the most significant declines in taurine levels happen in early life: levels decline by roughly 70% between birth and age 30, remain stable from age 30 to 60, and then increase slightly from 60 to 90. Even with this slight increase, taurine levels are still down 60% in old age compared to birth, he added.

Are Taurine Supplements Safe?

Taurine is generally recognized as safe by the Food and Drug Administration when added to beverages in small amounts, such as 45 parts per million or 0.0045%.

A typical energy drink contains between 750 mg and 1 gram of taurine per can, Shor said, which is roughly the same amount found in 100 grams of dried red seaweed.

Taurine naturally occurs in meat, eggs, seafood, and human breast milk. Shor said people who eat a typical Western diet usually get enough taurine, and the body also produces it on its own.

Daily consumption of up to 3 grams is considered safe. However, doses above 6 grams per day haven’t been studied for longer than four weeks, she added.

It’s hard to say how much is too much because there are no established USDA dietary reference intake guidelines for taurine. “Those who consume large amounts of taurine-containing products should consult their healthcare provider, as taurine is often combined with other ingredients that could be harmful if ingested in excessive quantities,” Shor said.

Who Should Take a Taurine Supplement?

“Vegetarians and vegans may consume less taurine than omnivores, but whether supplementation is necessary remains unclear,” Shor said.

Ultimately, more research is required before making an official recommendation.

“Although I have spent 15 years of my career studying taurine, I do not recommend supplementation,” Yadav said. “I am very hopeful that by next year we will have strong data to recommend it or not recommend it.”

What This Means For You

While early evidence suggests that taurine may help to slow aging and improve health, experts say it’s too early to recommend supplementation and that more research is needed.

Verywell Health uses only high-quality sources, including peer-reviewed studies, to support the facts within our articles. Read our editorial process to learn more about how we fact-check and keep our content accurate, reliable, and trustworthy.
  1. Santulli G, Kansakar U, Varzideh F, Mone P, Jankauskas SS, Lombardi A. Functional role of taurine in aging and cardiovascular health: an updated overviewNutrients. 2023;15(19):4236.doi:10.3390/nu15194236

  2. Chen Q, Li Z, Pinho RA, et al. The dose response of taurine on aerobic and strength exercises: a systematic reviewFront Physiol. 2021;12:700352.doi:10.3389/fphys.2021.700352

  3. Singh P, Gollapalli K, Mangiola S, et al. Taurine deficiency as a driver of aging. Science. 2023;380(6649):eabn9257.doi:10.1126/science.abn925

  4. Fernandez ME, Bernier M, Price NL, et al. Is taurine an aging biomarker? Science. 2025;388(6751):eadl2116.doi:10.1126/science.adl2116.

By Mira Miller

Miller is a journalist specializing in mental health, women’s health, and culture. Her work is published in outlets ranging from Vice to Healthnews.


Source link

24 06, 2025

Will MATIC Price Surge to $1? — TradingView News

By |2025-06-24T20:05:53+03:00June 24, 2025|Crypto News, News|0 Comments

Story Highlights

  • The live price of the Polygon coin is .
  • The MATIC price could reach a maximum of $0.47181 in 2025.
  • POL price with a potential surge may reach a high of $4.94731 by 2030.

Polygon POLUSDT has a mind-blowing Layer-2 scaling solution project for Ethereum, which is primarily designed to address slow speeds and the network’s high transaction fees. 

As a result, Polygon is seen as a revolutionary framework for developers and users, as it attracts by offering a more efficient Ethereum experience, which is the reason contributing to POL’s price value, too.

Through, POL, which is its native token (formerly MATIC), is utilized for transaction fees and network governance, in the framwork of interconnected Ethereum-compatible blockchain networks. 

Its use case makes it an attractive altcoin, and even its token POL price is attracting attention. The coin is expected to show a surge in the coming sessions, but it would require a technical eye to understand. 

Therefore, if you are curious about whether the POL price can rebound to $1. Will Polygon go up? And is Polygon a good investment? We bring our Polygon Price Prediction for 2025 – 2030 to explore the POL price prediction.

Table of contents

  • Overview
  • Polygon Price Prediction 2026 – 2030
  • Polygon Price Action 2026
  • POL Price Prediction 2027
  • Polygon Crypto Price Forecast 2028
  • MATIC Coin Price Projection 2029
  • Polygon Price Prediction 2030
  • Market Analysis
  • FAQs

Overview

Cryptocurrency
Token
Price
Market Cap
Trading Volume
Circulating Supply
All-time High $1.29 Mar 14, 2024
All-time Low $0.1533 Apr 07, 2025

Polygon Price Prediction 2025

As evident on the POL/USD daily chart on COINBASE, its price has been down more than 75% since December 2024, and Q1 2025 played a significant role in pushing it deep down the well.

However, in April of Q2 2025, bullish forces revived and took it to the 0.236 level-based resistance in mid-May. Despite the efforts, the Polygon was still very low and was among the list of altcoins that showed muted growth in Q2 compared to other altcoins.

However, the muted growth was brief as mid-May to June bears pushed its price back to April’s low, which shows that the asset strongly lacks bullish conviction in the short term.

The POL price could pull below $0.1000 if bearish forces continue downward pressure.

All these circumstances occurred during Donald Trump’s presidential start in 2025, and by H1 so far, the market participants have witnessed multiple wars, resulting in bearish dominance. 

The recent Israel-Iran agreement was the most significant factor that pushed altcoins like POL’s price in June.

POLUSD Price

However, on June 24th, POL saw a 7% intraday rise with a ceasefire announcement, which reignited people’s expectations. Therefore, if the conditions improve, the 0.236 Fibonacci level could be retested in June or July. 

If it clears that $0.4572 level in June or July, the odds of clearing Fibo are 0.50, 0.786, and the 1.0 level could be retested by the end of 2025. 

Additionally, RSI has reached oversold territory, and with the recent intraday rise, RSI has reversed, too. It shows that the Bullish sentiment is increasing in the short term.

Also, read our Ethereum ETHUSDT Price Prediction 2025-2030

Polygon Price Prediction 2026 – 2030

Year Potential Low ($) Potential Average ($) Potential High ($)
2026 $0.18870 $0.47179 $0.75488
2027 $0.30194 $0.75488 $1.20782
2028 $0.48311 $1.20782 $1.93252
2029 $0.77297 $1.93252 $3.09205
2030 $1.23676 $3.09205 $4.94729

Polygon Price Action 2026

Anticipating further expansion, MATIC’s potential high for 2026 is projected to be $0.75488, while the potential low is estimated at $0.18870, resulting in an average price of $0.47179.

POL Price Prediction 2027

MATIC crypto can make a potential high of $1.20782 in 2027, with a potential low of $0.30194, leading to an average price of $0.75488.

Polygon Crypto Price Forecast 2028

As the POL price progresses, the potential high price for 2028 is projected to be $1.93252, with a potential low of $0.48311, resulting in an average price of $1.20782.

MATIC Coin Price Projection 2029

Polygon coin price potential high for 2029 could be $3.09205, while a potential low of $0.77297, with an average price of $1.93252.

Polygon Price Prediction 2030

With an established position in the market, POL’s potential high for 2030 is projected to be $4.94729. On the flip side, a potential low of $1.23676 will result in an average price of $3.09205.

Market Analysis

Firm Name 2025 2026 2030
CoinCodex $ 0.71 $ 0.50 $ 0.90
Binance $0.24 $0.26 $0.31
Flitpay $6.25 $4 $10.4

CoinPedia’s MATIC Price Prediction

Coinpedia’s price prediction for Polygon is bullish, suggesting the MATIC crypto price may reach new swing highs and possibly surpass its all-time high in the near future.

The Polygon Price Forecast 2025 predicts a swing high of $0.47181, with an average price of $0.29488.

Year 2025
Potential Low $0.11795
Potential Average $0.29488
Potential High $0.47181

FAQs

Is MATIC a good investment?

Yes, it is a profitable investment, but the digital asset should be under due consideration for the long term. 

How high can Polygon MATIC price go by 2025?

According to our MATIC price prediction, the altcoin could reach a maximum of $0.47181 by 2025. With a potential surge, the price could go as high as $4.94731 by 2030.

Is Polygon better than Solana?

While it is not a direct apples-to-apples comparison, as one is a layer-2 and the other is a layer-1.

How high can Polygon MATIC transactions go?

At its best, it can process 65,000 transactions per second.

Why Polygon is faster than Ethereum?

The major functionality of this altcoin is to enable the multichain Ethereum ecosystem. It provides a network that offers interoperability between previous and present infrastructure scenarios of Ethereum.

Can polygon hit $100?

As per our MATIC price prediction, $100 dollars target is possible over the next 18 years.

Has MATIC changed to POL?

Yes, MATIC has been upgraded to POL as the network token for Polygon.

MATIC

BINANCE

Source link

Go to Top