The XRP price is back in the spotlight as fresh projections place the digital asset on a steady path toward a $1.5 trillion Market Capitalization and a 27% crypto market dominance. Notably, analysts remain broadly optimistic about XRP’s long-term outlook, pointing to historical trends, current price movements, and key resistance levels as strong indicators backing this bold prediction.
XRP Price Eyes $1.5 Trillion Market Cap And 27% Dominance
Despite still experiencing strong consolidation, the XRP price is reportedly on track to capture 27% of the total crypto market dominance and reach a $1.5 trillion market cap. This projection by a prominent market analyst, Egrag Crypto on X (formerly Twitter), has sparked discussions within the XRP community, drawing mixed reactions over the possibility of this ambitious forecast.
At the heart of this analysis is the notion that the total crypto market cap could eventually expand to a $5.5 trillion valuation, possibly driven by skyrocketing institutional adoption, broader retail participation, regularity clarity, and more. Under such a scenario where XRP is also forecasted to command a 27% market share, its total market cap would equate to roughly $1.485, bringing its projected price close to a historical all-time high of $27.
Supporting Egrag Crypto’s optimistic outlook is a historical analysis of XRP dominance levels, particularly focusing on the 0.5 Fibonacci Retracement level around the 5.75% mark. The analyst shared a detailed price chart, identifying this key level as a long-standing resistance zone where XRP dominance has been consistently rejected, first in October 2019, then in November 2020, and again in January and March 2025.
According to the analyst, repeated testing of this key resistance is likely to trigger a breakout reaction once it is breached. He offered a unique analogy, describing the resistance testing as “knocking on the door—the more you knock, the higher the chances it opens.”
Having already knocked on this resistance level four times in the past, XRP is now approaching its fifth attempt. The analyst believes that this could be the moment the “door” opens, signaling a potential breakout that could lead to a rise to the projected $1.5 trillion market cap and 27% dominance.
Notably, the XRP market cap currently stands at $2.77 billion, meaning it would need to surge by over 54,000% to reach the ambitious $1.5 trillion valuation. In addition, XRP’s present market dominance is around 3.93%—a far cry from the projected 27% market share. This highlights the scale of the growth required, both in value and influence, for XRP to meet the analyst’s forecasted milestones.
Bull Flag Set-Up Support Analyst’s Bold Predictions
Adding strength to Egrag Crypto’s optimistic market cap and dominance forecast is the emergence of a Bull Flag formation on the macro XRP chart, which historically signals continuation to the upside following a consolidation period.
The “KABOOM” zone labeled on the analyst’s XRP chart also signifies the critical breakout resistance threshold XRP must overcome. A successful breakout here could lead the price into a low resistance area marked as the “VOID,” potentially paving the way for rapid gains and a rise to the 27% market dominance.
GBP/USD weekly forecast remains bullish amid broad dollar weakness.
Weaker US data and easing US-China trade tensions support the pound.
All eyes are on the BoE and FOMC meetings due next week.
The GBP/USD weekly forecast remains strongly bullish as the pair hits its third consecutive week in gains. The price marked a 39-month top at 1.3635 before pulling back ahead of the weekend.
-If you are interested in forex day trading then have a read of our guide to getting started-
The bullish momentum gained traction after a period of consolidation earlier in the week. The weaker dollar and improved risk sentiment helped the buyers. However, the key catalyst was progress in the US-China trade negotiation, concluded in London with an agreement to ease restrictions on exports, including rare earth metals. Though the announcement had no details, it boosted risk appetite and weighed on the safe-haven Greenback.
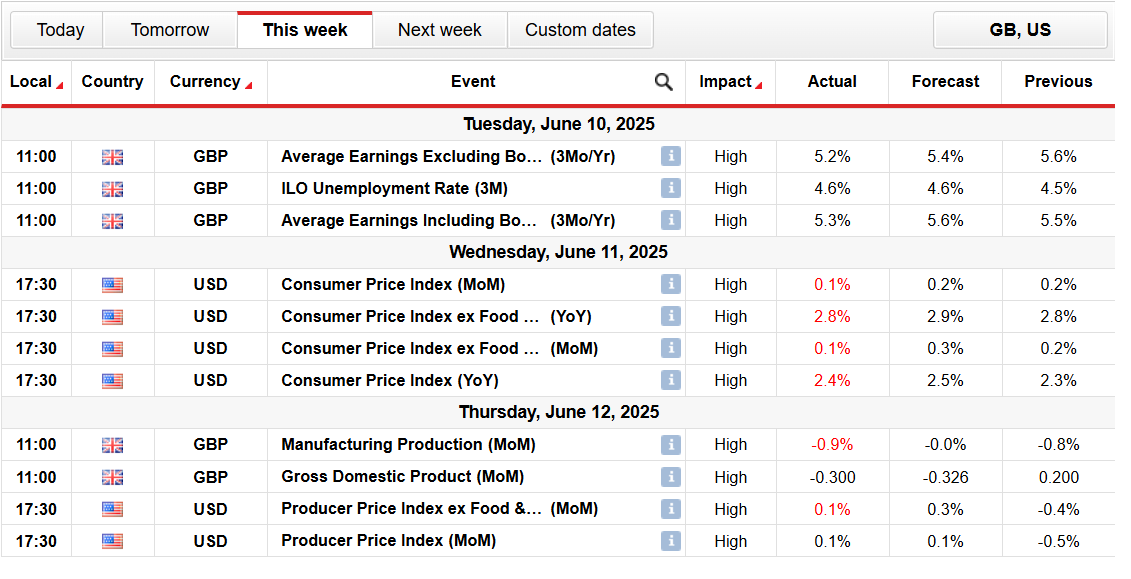
The US inflation data surprised the market to the downside, with a 0.1% rise on a monthly basis, which dragged annual inflation to 2.4%, missing the estimate of 2.5%. The core inflation also remained downbeat, increasing odds for a dovish Fed. This was further fueled by softer US PPI data and rising weekly jobless claims that deepened the USD losses and provided additional strength to the pound.
However, the rally proved to be short-lived. Geopolitical tensions ignited later in the week due to Israel’s attack on Iran, killing Iranian military officials and scientists. Iran responded in retaliation, which escalated the fear of broader conflict.
The safe-haven demand for the US dollar soared on the news that triggered a significant pullback of more than a hundred pips in the GBP/USD pair. The downward pressure was further intensified by the UoM Consumer Sentiment Index that rose to 60.5, well above the expected 53.5.
Major Events for GBP/USD in the Week Ahead
US and UK Key Data Ahead
Looking ahead, next week, the market participants will focus on the upcoming central bank meetings. Both the US Federal Reserve and the Bank of England are set to announce their key policy decisions midweek. Consensus suggests no change from either the Fed, which is expected to hold rates at 4.25%-4.50%, or the BoE, which is also expected to hold rates at 4.25%.
Moreover, the US and UK retail sales data, along with UK CPI and US jobless claims, will be important to watch. Meanwhile, geopolitics and the Fed’s further commentary will also shape the outlook.
GBP/USD Weekly Technical Forecast: Bulls Supported by 20-SMA
GBP/USD Daily Chart
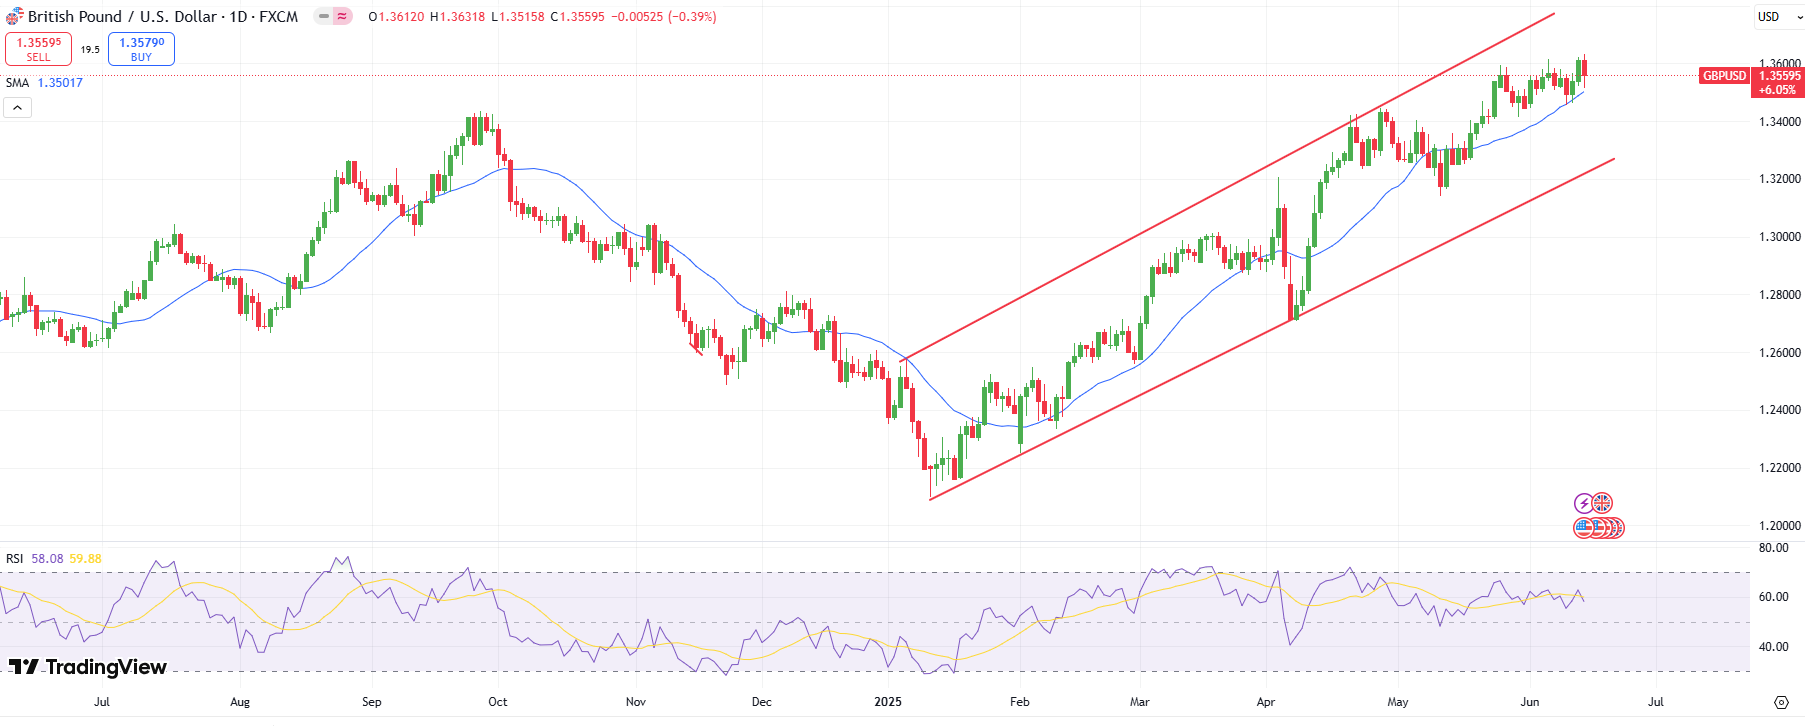
The daily chart of the GBP/USD suggests a consolidation within a broad uptrend. The Friday pullback remained strongly supported by the 20-day SMA. Meanwhile, a strong support zone also emerges in the 1.3420-60 area. The daily RSI is at 58.00 with a tilt to the downside, which suggests further consolidation.
-Are you looking for the best AI Trading Brokers? Check our detailed guide-
On the upside, the resistance lies at 1.3600, which is a round number ahead of 1.3635, which is a fresh 39-month top. Breaking the level may gather enough traction to test 1.3700.
Looking to trade forex now? Invest at eToro!
67% of retail investor accounts lose money when trading CFDs with this provider. You should consider whether you can afford to take the high risk of losing your money.
Much about matcha has been said about matcha on the internet, and by now, it is only evident that matcha has garnered its fair share of love and hate. But what is matcha, and how did it become a coffee double?
Well, matcha is a powdered form of green tea made from finely ground Japanese green tea leaves. Packed with antioxidants, these shade-grown plants are a powerhouse of vitamins A, C, & K, according to the National Library of Medicine study of 2020.
Matcha Beyond Trend?
The hype about matcha goes way beyond the devotion to trends. While its wide success is attributed to the Instagram influencers ‘ newfound obsession with ‘Matcha-latte’, its health benefits are beyond any cup. Matcha is found to be one of the highest caffeine sources, while it is also known to have an umami flavour that attracts many. On the other hand, the procaffeinators are staying loyal to their espressos and iced Americanos, casting matcha as a doppleganger of coffee with an earthy taste.
“The need for higher caffeine content during the day brought Matcha as the new alternative to coffee. Owing to its antioxidant properties, matcha matches its hype and can help people with alertness throughout the day. However, it should be taken seriously as matcha packs tend to contain 19–44 caffeine mg /g per serving,” said expert nutritionist, Varnit Yadav, Institute of Nutrition and Fitness Sciences, India, and JPS Health & Fitness, Australia, certified exercise and nutrition Coach.
“No Compulsion to Consume Matcha Daily”, says the Nutritionist
It’s a slippery slope while trying a new trend, especially if it includes consuming something daily. As for matcha, due to its high caffeine content, it can give a whole lot of attention, but it can also disrupt many rhythmic functions of the body.
According to coach Varnit, “There’s no compulsion to consume matcha regularly. It is an optional item that can be consumed in the range of 2-5 grams per day. Since per serving can be very high in caffeine content, it is important to keep in mind your tolerance for such beverages.”
With every trend comes its pros and cons. While matcha offers a one-of-a-kind antioxidant-rich drink and boosts brain function, it is also known to cause many problems for people every day. As per Coach Varnit’s opinion, here are some short-term problems matcha can cause:
Digestive distress: While good in moderation, excessive amounts of matcha can cause an upset stomach. Or if taken on an empty stomach, it can cause flatulence and acid reflux.
Nausea: Due to the high caffeine and catechins content in matcha, it can irritate the stomach lining, causing nausea and vomiting (rarely)
Anxiety: Individuals with pre-existing anxiety should steer clear of matcha as its elevated caffeine content might raise anxiety levels.
Elevated heart rate: A Large amount of coffee causes a rapid heart rate, and when mixed with matcha, it can exacerbate the heart rate, causing restlessness.
Disturbance in sleep: While the L-theanine improves brain function and memory, it is vital to keep the intake in moderation as the high caffeine content can lead to lack of sleep.
So, what is the alternative? As per Varnit’s advice, “Know your body and its limitations. Moreover, build your tolerance over time, learning if your body is handling it well. Listen to your body and not trends!”
Long-term Side Effects of Matcha
Often, consistency is key, but not when it comes to matcha intake. Matcha, due to its high caffeine content and abundance of Epigallocatechin gallate (EGCG), aka antioxidants, can lead to liver toxicity, especially in people with existing liver problems. “If you are sensitive to caffeine or such products, the effects can be amplified at times. Moreover, excessive Matcha Can disrupt many things,” said Coach Varnit.
Excessive Matcha Can Disrupt Sleep: Consuming more than 5–6 grams of matcha daily means a high intake of caffeine and L-theanine, which can interfere with the body’s natural sleep cycles. Over time, this may lead to difficulty falling asleep or experiencing deep, restful sleep
Caffeine Buildup Affects Sleep Quality: Matcha contains more concentrated caffeine than regular green tea. Regularly exceeding the recommended limit can lead to overstimulation of the nervous system, making it harder for the body to wind down at night
Risk of Heavy Metal Contamination: If the source of the matcha isn’t verified or tested for quality, it could contain heavy metals like lead or arsenic. These can accumulate in the body and may pose long-term health risks, particularly to the liver.
Potential Liver Strain: Low-quality or contaminated matcha can negatively impact liver function. Continuous exposure to harmful compounds through unchecked products can overwork the liver and impair its detoxification processes.
Which Group Should Avoid Matcha?
Learning about the many restrictions of Matcha from the aforementioned reasons, one thing is clear: Matcha is not for everyone. It might be an acquired taste, but should it be acquired? The answer is no, and Coach Varnit tells you who should avoid matcha and why.
“People who have high BP are at risk, and people with already existing liver conditions need to be mindful of picking the right extract of matcha. There’s a safe range of caffeine intake for pregnant women (up to 200 milligrams). Also, people belonging to such demographics should always consult their physician before adding a beverage of such kind to their routines.”
Matcha is a great new alternative to coffee and people looking to try something new. While it promotes antioxidant levels and boosts brain function, it should be remembered that it should be taken in moderation. As for matcha, try it in small amounts and watch it do wonders for your routine without causing health risks.
On the hourly chart, the rate of XRP is trying to return to the local resistance of $2.18. If buyers’ pressure continues, one can expect a level breakout, followed by a move to the $2.20 range.
On the weekly chart, one should focus on the candle closure in terms of the support of $2.0594. If a breakout happens, the accumulated energy might be enough for a test of the vital $2 zone and below.
Psyllium husk, a popular dietary fiber supplement derived from Plantago ovata seeds, is widely used for digestive health and cholesterol management. However, recent incidents highlight significant contamination risks that threaten consumer safety, particularly from Salmonella and heavy metals like lead.
Salmonella Outbreaks
In 2021, Denmark experienced a severe Salmonella outbreak linked to psyllium supplements, resulting in 33 illnesses, 19 hospitalizations, and three deaths. The outbreak strain was traced to Husk brand capsules, with contamination confirmed in products recovered from patients’ homes. Those affected, ranging from ages 2 to 92, included immunocompromised individuals using psyllium for pre-existing gastrointestinal conditions, potentially masking early symptoms of infection. This incident marked the first documented case of a herbal supplement causing a Salmonella outbreak in Denmark, prompting international recalls across Scandinavia.
Heavy Metal Contamination
Beyond pathogens, lead contamination is prevalent in psyllium products. Independent testing of nine supplements found lead in all samples, with four exceeding safety thresholds. One product contained 38.7 mcg of lead per maximum daily serving, over 60 times California’s Proposition 65 warning level. Lead accumulates in the body and poses long-term neurological and cardiovascular risks, though manufacturers often attribute its presence to environmental pollution during cultivation.
Why Psyllium Is Vulnerable
Several factors increase contamination risks:
Agricultural Sourcing: Psyllium plants absorb heavy metals like lead and arsenic from soil, while exposure to animal feces or contaminated water may introduce Salmonella.
Processing Gaps: Unlike pharmaceuticals, psyllium husk lacks sterilization during grinding or encapsulation. Its powder form provides an ideal environment for pathogens to persist.
Consumer Vulnerability: Typical users include elderly or immunocompromised individuals managing chronic digestive issues, who face higher risks of severe outcomes from infections.
Regulatory and Consumer Responses
Authorities now emphasize stricter screening:
Manufacturers must test raw materials for pathogens and heavy metals, with recalls initiated at the first sign of contamination.
Consumers should discard recalled lots immediately, verify third-party safety certifications (e.g., NSF, USP), and store supplements in cool, dry conditions to prevent microbial growth.
While psyllium retains proven benefits for heart and digestive health, these incidents underscore that “natural” sourcing does not guarantee safety. Robust quality control remains critical for protecting high-risk populations.
Solana hovers above key support near $140, with whale activity rising and technical signals flashing red as the price braces for a decisive breakout or breakdown.
With volatility tightening and Solana trading just above a key support zone, the pressure is building. Price action is getting squeezed between major levels, while whales are making bold bets and technicals are flashing warning signs.
Solana Hits Make-or-Break Support Zone
Solana is back at a critical level, and the next move could define its short-term trend. According to Coinvo, SOL is currently testing a key support area around $141 to $144, which has acted as a strong base multiple times since early April. The market’s leaning in; this is the same zone that sparked the last rally toward $160, so participants are watching closely to see if the bulls can defend it once again.
Solana tests a key support zone near $141, a level that previously sparked a rally toward $160. Source: Coinvo via X
If this support holds, price could see another leg higher, possibly pushing SOL back toward the $160 to $165 resistance zone that’s been a stubborn ceiling. But if it breaks, Coinvo believes that downside could open up fast, exposing the SOL Solana price towards the support zones of $120 and $100.
Whale Wallet Stakes $135M
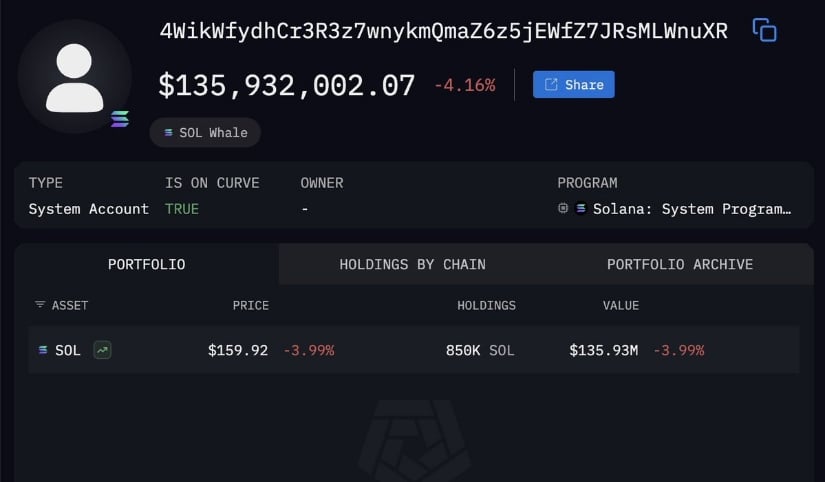
While Solana hovers around its make-or-break support zone near $141, a massive new wallet just made a bold move, staking over $135 million worth of SOL on June 11, after withdrawing from Coinbase.
A new whale wallet stakes 850,000 SOL worth $135M. Source: SolanaFloor via X
The image shared by SolanaFloor shows SOL trading near $159; this action signals deep conviction from a player willing to lock in 850,000 SOL while the broader market watches from the sidelines. It’s a vote of confidence amid technical uncertainty.
Solana Eyes Bounce From Key Demand Zone
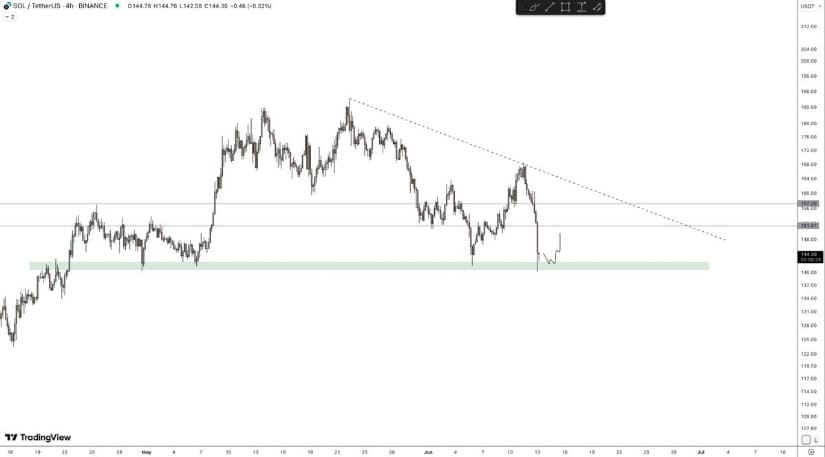
As Solana reaches the support levels around $140, a new chart analysis suggests that this level may act as a lifeline. A tweet from Cypher shows SOL bouncing off a clearly defined demand zone, one that has held firm several times since late April.
Solana attempts a bounce from a key demand zone near $140, with traders eyeing a possible move toward $150 to $155. Source: Cypher via X
With a descending trendline pressing from above and horizontal support just underfoot, SOL now sits at the center of a technical squeeze; a bounce here could retest the mid-$150s. At the same time, a failure could break open downside toward $130 or lower.
The $135M staking move signals confidence, but the price still needs to confirm with the structure. Until SOL clears the downtrend or decisively breaks below, traders are watching for signs of strength at this support zone.
Solana Meme Volume Hits 16-Month Low
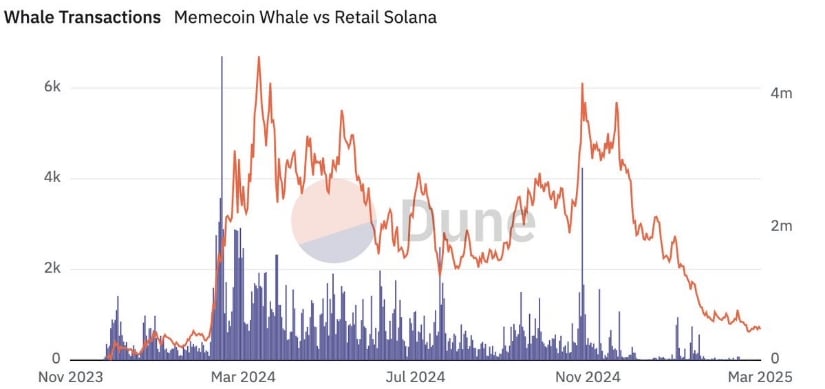
As Solana fights to defend its support near $140, fresh on-chain data shows another shift: whale memecoin activity on SOL has completely dried up. A tweet by Greeny highlights that whale transaction volume tied to meme tokens is now at its lowest since February 2024.
Whale memecoin activity on Solana plunges to a 16-month low as SOL tests critical support near $140. Source: Greeny via X
The chart reflects a sharp collapse in whale activity, with retail users still engaged, but the big players clearly stepping back, a rare disconnection from earlier cycles. This comes right as SOL attempts a technical bounce. Either way, with volatility compressing, all eyes are now locked on SOL Solana price structure and whether the $140 level holds or breaks.
Solana Price Prediction Eyes Head & Shoulder Breakdown
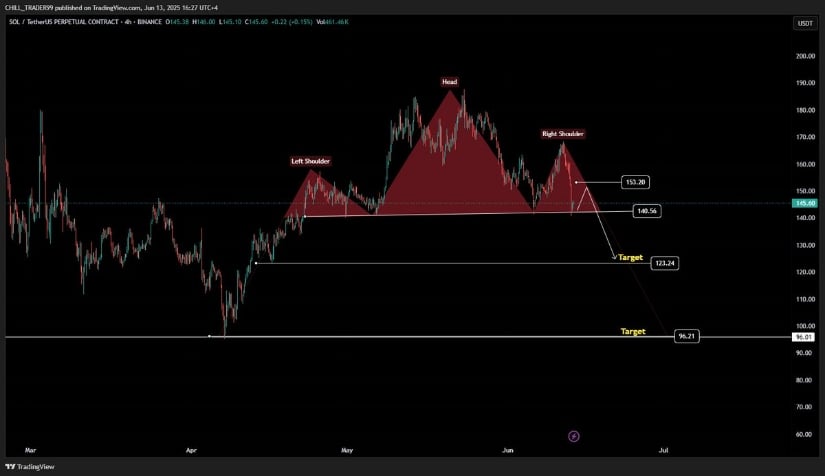
Solana’s chart is shaping up into a classic head and shoulders pattern, and it’s raising red flags. As noted by Chill Trader, the neckline support around $140 is now under serious pressure. This level has been key since April, but if it fails, the pattern’s measured move points to possible drops toward $123 and even $96.
Solana forms a classic head and shoulders pattern with neckline support under threat at $140. Source: Chill Trader via X
Volume is starting to tick up on red candles, hinting that sellers are gaining confidence. The structure is already in place, left shoulder, head, right shoulder, now it’s all about whether the neckline breaks. Until then, bulls still have a shot at recovery, but if $140 gives way, the next wave down could come quickly.
Final Thoughts
Solana is standing right on the edge, and the direction could define whether bulls regain control or sellers press the advantage. With the price sitting at a critical support near $140 and patterns like the head and shoulders beginning to unfold, the participants are watching closely.
Whale memecoin volume drying up, rising sell pressure, and conflicting signals make this a pivotal moment for SOL. A clean bounce from here could flip the short-term narrative bullish again, but if the neckline cracks, SOL Solana price could be looking at sharp downside toward $123 or even $100.
Dogecoin (DOGE) is under the microscope again as traders look for opportunities in a market that’s showing mixed signals.
Today’s analysis dives into the latest price movements, chart patterns, and what traders can expect next from this popular meme coin.
Dogecoin Price Analysis
Dogecoin (DOGE) has shown a mix of price movements recently. Over the last 24 hours, DOGE dropped 2%, bringing its weekly performance to a near flat level with a slight 1% gain.
The short-term recovery featured a lovely micro uptrend that revealed some buying interest and created a higher low that initially served as support.
Zooming out, the trend looks more bearish. Dogecoin dropped 13.39% over the past month, wiping out the short-term uptrend as the price fell through key higher lows from the recent rally.
The daily chart backs this downtrend, showing that DOGE now trades below all major moving averages—often a bearish signal. Although DOGE showed strength for six to seven days, that momentum has now faded.
DOGE recently broke below the micro higher low at $0.18892. This kind of breakdown usually marks a trend reversal and indicates a shift from bullish to bearish momentum. Since early May, DOGE has trended downward, with only a short-lived “opium pump” attempting—and failing—to reverse the slide.
Dogecoin Price Prediction
Current technicals and market signals point to a bearish near-term outlook for Dogecoin. If the breakdown below $0.18892 confirms a trend reversal, the chart suggests another 4.3% decline ahead. This forecast matches the broader downtrend that has taken shape since early May.
In the longer term, a long-term ascending triangle might still form over the next year and create the setup for a breakout, but this scenario remains far off and uncertain.
Externally, the market is closely watching upcoming SEC decisions on several crypto ETFs, including one tied to Dogecoin. With June deadlines approaching, these rulings could act as bullish catalysts.
However, most analysts think a Dogecoin ETF remains premature, especially given the recent approvals for Bitcoin and Ethereum. Still, they expect regulators won’t ignore Dogecoin forever, which could influence future price moves.
Despite DOGE’s past peaks of $67 billion, $69 billion, and even $73 billion in valuation—compared to the current $28 billion—its price action hasn’t delivered the explosive gains seen in previous cycles since December.
Returning to December’s price would mean just over a 2x increase from today, but that isn’t likely in the immediate future.
Given current conditions, short-term trades offer the clearest path to profits. Traders may find more success by scalping DOGE and targeting the expected 4.3% drop rather than waiting for a long-term breakout right now.
Next Meme Coin to Explode: Solaxy (SOLX)
One of 2025’s biggest presales may be happening right now. Solaxy (SOLX) is closing in on $50 million raised, and only two days remain before $SOLX goes live on exchanges. The hype around this Solana Layer-2 project keeps growing.
Most Layer-2 projects just bundle transactions and stop there. Solaxy’s team is going further. Their roll-up tech gathers thousands of Solana transactions, compresses them, and sends back a summary—but they didn’t stop at that.
They also built a fast and easy bridge powered by Hyperlane. It lets users move assets between Solana, Ethereum, and Solaxy without switching wallets or waiting for long confirmations.
Another standout feature is the Igniter Protocol. It lets anyone create a meme coin without writing code. Once created, the coin will show up on Solaxy’s upcoming DEX as soon as trading begins.
Solaxy also offers tools for developers, including a real-time block explorer. The $SOLX token powers the entire system—it covers transaction fees, powers governance votes, and ties everything together. This isn’t a random mix of features—it works as a full ecosystem.
The $SOLX presale ends on Monday, June 16 at 2PM UTC. While the official launch date isn’t out yet, Solaxy plans to launch the Layer-2 network and start trading $SOLX at the same time.
You can still buy $SOLX tokens for $0.001758 each—but this is the final set price before the market decides the value. On June 12, the team made a big move by burning 35 billion $SOLX tokens—worth around $62 million at presale prices. That’s about 25% of the total supply gone.
This article has been provided by one of our commercial partners and does not reflect Cryptonomist’s opinion. Please be aware our commercial partners may use affiliate programs to generate revenues through the links on this article.
We will conduct an individually randomized, quadruple-blind (blinded trial participants, investigators, data collectors and data analysts), superiority trial of daily antenatal MMS supplementation containing 60 mg elemental iron or 45 mg elemental iron as compared to MMS containing 30 mg elemental iron. This trial protocol was written in accordance with the Standard Protocol Items: Recommendations for Interventional Trials (SPIRIT) checklist (see Additional file 1).
Study setting
In Tanzania, an estimated 56% of pregnant women are anemic based on the 2022 Demographic and Health Survey [3]. Two previous trials of MMS versus IFA, in which both groups received 60 mg iron, have been conducted in the country, and both indicated the beneficial effects of MMS [20, 21]. Tanzania is currently considering switching to MMS as the standard of care, but there are concerns about reducing the iron dose from 60 mg in the current IFA to 30 mg in MMS. The study will be conducted at selected public antenatal care clinics in Dar es Salaam, Tanzania. The study clinics currently provide all pregnant women with IFA containing 60 mg iron free of charge as the standard of care. The same study clinics were part of a recent non-inferiority trial of low-dose calcium supplementation in pregnant women [22].
Eligibility criteria and recruitment
The trial flow diagram is shown in Fig. 1. Research staff will assess the eligibility criteria for pregnant women who present for antenatal care at study clinics. The trial inclusion criteria are (i) pregnant women attending their first antenatal care visit, (ii) less than 20 weeks of gestation based on the last menstrual period (LMP), (iii) adult ≥ 18 years old, (iv) intending to stay in the study area until 6 weeks postpartum, and (v) provide written informed consent. Trial exclusion criteria are (i) severe anemia defined as a hemoglobin concentration < 8.5 g/dL per Tanzania standard of care; (ii) sickle cell disease including genotypes HbSS, HbSC or hemoglobin C disease (HbCC); and/or (iii) concurrent enrollment in another nutritional clinical trial. At the screening visit, participants who consent will have a finger prick for the collection of capillary blood that will be used to quantify hemoglobin concentration with the point-of-care HemoCue Hb 301 system (HemoCue AB, Ängelholm, Sweden). The HemoTypeSC test (Silver Lake Research Cooperation, Irwindale, USA) will be used for point-of-care hemoglobinopathy screening. Participants will also be asked to provide written consent for the storage of their data and blood specimens in future studies.
Fig. 1
MMS-MAP trial flow diagram
Interventions
Pregnant women will be randomized to one of three trial regimens (i) MMS that contains 15 micronutrients, including 30 mg elemental iron (standard UNIMMAP formulation), (ii) MMS that contains 45 mg elemental iron plus the standard UNIMMAP formulation for the other 14 micronutrients, or (iii) MMS that contains 60 mg elemental iron plus the standard UNIMMAP formulation for the other 14 micronutrients. The only difference between the randomized groups will be the amount of iron contained in the MMS supplements. Iron will be given in the form of ferrous sulfate for all three groups. To ensure blinding, the three MMS supplements will have the same appearance, color, odor, taste, size, and weight. The trial regimen will be manufactured by DSM Nutritional Products South Africa (Gauteng, South Africa).
All participants will be counseled to take one MMS (with IFA) tablet orally per day from randomization until delivery. Participants will receive a 35-day supply of MMS in blister packs at the randomization visit and at each subsequent monthly pregnancy visit (Additional file 2). Multiple strategies will be used to enhance participant adherence to the MMS regimens. At each pregnancy visit, research staff will take a pill count of tablets returned in the regimen blister packs. Study staff will then counsel participants on MMS and provide advice on overcoming side effects and other potential barriers. Text message reminders for adherence and upcoming study visits will also be sent to study participants. Participants who report they plan to travel outside of the study area may be given extra blister packs of the regimen to ensure daily regimen supply.
Concomitant care provided during the trial
At each trial site clinic, all participants will be provided with the standard of care throughout the study according to the national guidelines for antenatal care in Tanzania. Participants will have access to study clinics for post-trial care through the routine health system, and in the case diagnoses such as hypertensive disorders of pregnancy, red blood cell disorders, or depression are diagnosed through study procedures, we will refer participants to appropriate standard care. Any woman who is identified to be severely anemic (Hb < 8.5 g/dL) during the study will be discontinued from taking study supplements and referred for treatment according to the Tanzanian antenatal guideline for the management of severe anemia in pregnancy. We will continue to follow the women with severe anemia per the standard visit schedule according to the protocol, but they will not receive the trial regimen.
Assignment of interventions: allocation and blinding
Pregnant women will be randomized in a 1:1:1 ratio to the three trial groups. The allocation sequence will be generated by two non-study staff at George Washington University through computer-generated randomization lists that will be stratified by the study clinic and block randomization (block sizes of 9). The two non-study staff hold the randomization list codes until completion of the primary trial analysis or as requested by the Data and Safety Monitoring Board (DSMB). An independent study pharmacist will privately prepare regimen blister packs with participant IDs based on the randomization lists for each clinic. At the randomization visit, research staff will assign pregnant women to the next available participant ID, which corresponds to a set of pre-labeled blister packs. The trial statistician and data analysts will be blinded to the treatment allocation for the primary statistical analysis. Therefore, the trial is quadruple blind because all trial participants, investigators, outcome assessors, and trial data analysts will be unable to determine the randomized group for any individual participant and will not be able to determine participants who are in the same randomized group. Furthermore, the randomization procedures will ensure complete allocation concealment.
Sample size
We will perform three statistical tests of superiority for the primary outcome: (i) MMS 60 mg iron versus MMS 30 mg iron; (ii) MMS 45 mg iron versus MMS 30 mg iron; (iii) MMS 60 mg iron versus MMS 45 mg iron. Therefore, to account for multiple testing, the α was set to 0.01667 (0.05/3). Table 2 presents a summary of the outcome prevalence assumptions, relative risks, and power calculations for the trial. Based on data from a prior calcium trial conducted in Tanzania, we expect the prevalence of the primary outcome of maternal third-trimester moderate or severe anemia to be 25% in the MMS 45 mg iron group. A meta-analysis of iron trials and cohort studies suggests that there is a 0.88 relative risk for anemia per 10 mg increase in iron dose [12]. Therefore, we assumed a relative risk of 0.82 for comparisons with a 15 mg difference in iron (MMS 45 mg iron vs MMS 30 mg iron and MMS 60 mg iron vs 45 mg iron) and a relative risk of 0.67 for the comparison with a difference of 30 mg iron (MMS 60 mg iron versus MMS 30 mg iron). Based on these assumptions, we require third-trimester hemoglobin data from 1,808 women per arm. Assuming a conservative 15% of pregnant women will have missing third-trimester hemoglobin data (including 5% fetal loss and 10% missing blood samples), the total sample size for the trial will be 6381 (2,127 participants in each of the three randomization groups). R pwr package version 1.3 was used for sample size calculations [23].
Table 2 Power assuming n = 2,127 pregnant women randomized in each group with primary endpoint data (third-trimester anemia) available for 1,808 in each group
Participant timeline
An overview of screening, randomization, and follow-up is presented in Fig. 2. Study visits include a randomization visit and pregnancy study visits every 4 weeks until delivery. Regardless of pregnancy outcome, we will also conduct a visit around the end of the pregnancy and a postnatal visit scheduled after 42 days postpartum. Participant retention will be promoted at clinic visits and through phone calls and home visits.
Fig. 2
Schedule of enrollment, interventions, and assessments (SPIRIT figure)
Pregnancy study visits
Pregnant participants will have a study visit at the time of randomization and monthly follow-up visits until delivery. Starting at 32 weeks of gestation, all participants will also receive weekly phone calls to check their pregnancy status. Participants will be asked to contact the research team at the time of labor onset. All women will receive an ultrasound assessment of fetal biometry around the time of randomization. All ultrasound images will be electronically stored, and a random 10% will be assessed for quality by the study obstetrician and the ultrasound quality control team. Participants will also receive a malaria rapid diagnostic test (RDT) at the first antenatal care visit, the time of randomization, as the standard of care. At pregnancy follow-up visits, participants who report a history of fever during the last month or have a body temperature of > 37.5 ℃ measured at the study visit will also have a malaria RDT performed. At all pregnancy visits, study physicians will perform a clinical exam and treat all comorbidities per Tanzanian standard of care. Blood pressure will be assessed with electronic blood pressure monitors and standardized procedures. Participants will also provide urine samples at each pregnancy visit, and dipsticks will be used to assess proteinuria. Nurses will measure maternal height with stadiometers at the randomization visit. Maternal weight will be taken on digital weighing scales, and the mid-upper arm circumference (MUAC) will be taken with a measuring tape at randomization and each pregnancy visit. A 24-h diet recall will be conducted at the first pregnancy follow-up visit and at 32 weeks of gestation. The Patient Health Questionnaire (PHQ)−9 and FACIT Fatigue Scale [24, 25] will be administered to assess symptoms of depression and symptoms of anxiety and fatigue, respectively, at randomization and at 32 weeks of gestation.
Labor and delivery study visit
Clinic records and interviews with the clinic staff and participants will be used to ascertain labor and delivery information. Participants who deliver outside of the study area will be reached by phone by the research staff to obtain relevant information from the mother and/or facility records. Maternal blood pressure and proteinuria will be assessed by clinic or study staff or collected from clinic records. Infant length and weight will also be taken by study staff or recorded from facility records.
Postpartum study visit
Women or women/infant pairs will have a study visit at 6 weeks postpartum (42 days) and will be discharged from the trial after completion of this visit. At the postpartum visit, research staff will assess maternal and infant morbidity and hospitalization history. Nurses will also collect weight and blood pressure from mothers. Study nurses will assess infant feeding, infant weight with a digital infant balance scale to the nearest gram, and infant length to 1-mm precision with a rigid length board with an adjustable footpiece. Study nurses will measure infant head circumference and MUAC with a flexible measuring tape. All infant anthropometric measurements will be recorded in duplicates. A verbal autopsy will be conducted to ascertain the cause of infant death [21].
Data management
All data will be entered into an electronic data capture system developed in Tanzania, and the program will have in-built skip patterns and range check validations for each variable. All identifiable electronic data will remain in Tanzania and will be stored on secure local servers that are accessible only by the respective study data teams and investigators. Data from the trial will be stored indefinitely on servers in Tanzania and the USA.
XRP price has
tumbled to its lowest level in over a week, falling to $2.0856 on Friday before
recovering slightly to $2.1729 on Saturday, as the cryptocurrency faces
pressure from both geopolitical tensions and technical selling.
In this article, we answer the question of why XRP is going down today, explore the outlook based on technical analysis, and review the latest price forecasts.
“Gold and oil are climbing on real-world demand and
risk aversion. Crypto is dipping as traders cash in on short-term volatility,
and because it’s still not viewed as a true safe haven, at least not yet,” said Dr Kirill Kretov, Senior Automation Expert at CoinPanel. “When traditional finance is stressed, gold benefits from its reputation as a safe haven.”
“The
parties’ proposed resolution will preserve the resources of the Second Circuit
by avoiding the need to decide appeals, obviate any remand for further
proceedings in this Court, and bring 4.5 years of hard-fought litigation to an
end,” the filing attorneys wrote.
The
settlement motion represents the final chapter in a case that began in December
2020 when the SEC accused Ripple of conducting unregistered securities sales.
While Judge Analisa Torres ruled in July 2023 that secondary XRP sales are not
securities, she also determined that institutional sales during funding rounds
violated securities laws.
Technical Breakdown
Accelerates XRP Price Selling
From a
technical perspective, XRP has struggled to break above the $2.33 resistance
level, facing three rejections at that price point over recent sessions. The
repeated failures have created what analysts describe as a head-and-shoulders
pattern, with the neckline sitting at $2.285.
Trading
volume peaked during the heaviest selling, with over 7 million units changing
hands as the price declined from $2.288 to $2.260 – a 3.7% drop in a single
session. While XRP formed a double bottom at $2.250 and attempted a recovery,
the bounce came on declining volume, suggesting weakening buying interest.
The broader
cryptocurrency market has been under pressure since Israel launched airstrikes
against Iran’s nuclear facilities on June 13. Bitcoin dropped 4% to around
$103,000, while Ethereum fell 8% and other major tokens posted similar
declines.
In my
previous technical analysis, I suggested that XRP might have a chance for a
stronger rebound due
to the completion of a flag pattern, which points to an upward target
around the $3.30 level. But what do expert forecasts say about this potential?
XRP Price Predictions: 10,
100 or even 1,000 per one XRP token?
Technical
analysis experts like Michaël van de Poppe focus on chart patterns and
resistance levels, suggesting XRP could retest its previous all-time high of
$3.40 in the near term. Meanwhile, CoinDesk’s AI-assisted model provides a more
measured approach, forecasting $2.85 by July 2025 based on current momentum and
trading volume patterns.
Long-term
forecasts extending to 2030 vary significantly, with conservative
estimates around $12-17 from established analysts, while some community-driven
predictions reach extraordinary levels. The more realistic projections consider
XRP’s potential market capitalization relative to the global remittance market,
which processes approximately $7.5 trillion annually.
The legal
settlement with the SEC removes a major overhang that has weighed on XRP for
years. The cryptocurrency industry views the resolution as a symbolic victory,
particularly given that XRP is no longer classified as a security in secondary
market transactions.
However,
market participants remain focused on near-term technical levels. If XRP’s
support at $2.25 fails to hold, analysts see a potential decline toward $2.234.
Conversely, a sustained break above $2.35 could signal renewed upward momentum.
Institutional
interest in XRP continues to grow despite the recent price weakness. Several
publicly listed companies have announced XRP-focused treasury strategies, while
Ondo Finance launched its flagship US Treasury product on the XRP Ledger this
week.
Looking
ahead, traders are monitoring potential catalysts including a possible XRP spot
ETF decision from Franklin Templeton, which could arrive later this month. The
combination of regulatory clarity and institutional adoption may provide
longer-term support, even as short-term volatility persists amid ongoing
geopolitical tensions.
XRP News, FAQ
Why is the XRP price
falling?
XRP’s price
decline stems from multiple converging factors that have created sustained
selling pressure throughout 2025. The primary drivers include technical
breakdown patterns, with XRP confirming a bearish head-and-shoulders formation
that projects further declines toward $2.00. The token has struggled to
maintain momentum above the critical $2.40 resistance level, leading to
repeated rejections and weakening buyer confidence.
Is it worth investing in
XRP now?
Yes, the potential
upside catalysts include the pending SEC decision on Franklin Templeton’s XRP
ETF application on June 17, 2025, with market observers estimating up to 88%
probability of approval. The resolution of Ripple’s legal battle with the SEC,
including the recent $125 million settlement agreement, has removed a major
regulatory overhang that previously suppressed institutional interest.
What’s happening with XRP
at the moment?
XRP is
currently experiencing a critical inflection point as multiple catalysts
converge in June 2025. The token is trading around $2.15, having declined from
recent highs near $2.40, and is testing key technical support levels that could
determine its near-term direction.
Regulatory
developments remain at the forefront, with Ripple and the SEC filing a joint
motion to release $125 million from escrow, effectively concluding their
4.5-year legal battle. This settlement, while positive for long-term clarity,
has yet to provide the expected price boost as markets focus on technical
factors and broader economic conditions.
Is XRP likely to go down?
The
probability of further XRP declines depends largely on whether current
technical support levels hold. Bearish indicators include the confirmed
head-and-shoulders pattern with a measured target of $2.00, representing
approximately 14% downside from current levels. The breakdown below the $2.33
neckline has activated this bearish scenario, with initial support at $2.25
already tested.
XRP price has
tumbled to its lowest level in over a week, falling to $2.0856 on Friday before
recovering slightly to $2.1729 on Saturday, as the cryptocurrency faces
pressure from both geopolitical tensions and technical selling.
In this article, we answer the question of why XRP is going down today, explore the outlook based on technical analysis, and review the latest price forecasts.
“Gold and oil are climbing on real-world demand and
risk aversion. Crypto is dipping as traders cash in on short-term volatility,
and because it’s still not viewed as a true safe haven, at least not yet,” said Dr Kirill Kretov, Senior Automation Expert at CoinPanel. “When traditional finance is stressed, gold benefits from its reputation as a safe haven.”
“The
parties’ proposed resolution will preserve the resources of the Second Circuit
by avoiding the need to decide appeals, obviate any remand for further
proceedings in this Court, and bring 4.5 years of hard-fought litigation to an
end,” the filing attorneys wrote.
The
settlement motion represents the final chapter in a case that began in December
2020 when the SEC accused Ripple of conducting unregistered securities sales.
While Judge Analisa Torres ruled in July 2023 that secondary XRP sales are not
securities, she also determined that institutional sales during funding rounds
violated securities laws.
Technical Breakdown
Accelerates XRP Price Selling
From a
technical perspective, XRP has struggled to break above the $2.33 resistance
level, facing three rejections at that price point over recent sessions. The
repeated failures have created what analysts describe as a head-and-shoulders
pattern, with the neckline sitting at $2.285.
Trading
volume peaked during the heaviest selling, with over 7 million units changing
hands as the price declined from $2.288 to $2.260 – a 3.7% drop in a single
session. While XRP formed a double bottom at $2.250 and attempted a recovery,
the bounce came on declining volume, suggesting weakening buying interest.
The broader
cryptocurrency market has been under pressure since Israel launched airstrikes
against Iran’s nuclear facilities on June 13. Bitcoin dropped 4% to around
$103,000, while Ethereum fell 8% and other major tokens posted similar
declines.
In my
previous technical analysis, I suggested that XRP might have a chance for a
stronger rebound due
to the completion of a flag pattern, which points to an upward target
around the $3.30 level. But what do expert forecasts say about this potential?
XRP Price Predictions: 10,
100 or even 1,000 per one XRP token?
Technical
analysis experts like Michaël van de Poppe focus on chart patterns and
resistance levels, suggesting XRP could retest its previous all-time high of
$3.40 in the near term. Meanwhile, CoinDesk’s AI-assisted model provides a more
measured approach, forecasting $2.85 by July 2025 based on current momentum and
trading volume patterns.
Long-term
forecasts extending to 2030 vary significantly, with conservative
estimates around $12-17 from established analysts, while some community-driven
predictions reach extraordinary levels. The more realistic projections consider
XRP’s potential market capitalization relative to the global remittance market,
which processes approximately $7.5 trillion annually.
The legal
settlement with the SEC removes a major overhang that has weighed on XRP for
years. The cryptocurrency industry views the resolution as a symbolic victory,
particularly given that XRP is no longer classified as a security in secondary
market transactions.
However,
market participants remain focused on near-term technical levels. If XRP’s
support at $2.25 fails to hold, analysts see a potential decline toward $2.234.
Conversely, a sustained break above $2.35 could signal renewed upward momentum.
Institutional
interest in XRP continues to grow despite the recent price weakness. Several
publicly listed companies have announced XRP-focused treasury strategies, while
Ondo Finance launched its flagship US Treasury product on the XRP Ledger this
week.
Looking
ahead, traders are monitoring potential catalysts including a possible XRP spot
ETF decision from Franklin Templeton, which could arrive later this month. The
combination of regulatory clarity and institutional adoption may provide
longer-term support, even as short-term volatility persists amid ongoing
geopolitical tensions.
XRP News, FAQ
Why is the XRP price
falling?
XRP’s price
decline stems from multiple converging factors that have created sustained
selling pressure throughout 2025. The primary drivers include technical
breakdown patterns, with XRP confirming a bearish head-and-shoulders formation
that projects further declines toward $2.00. The token has struggled to
maintain momentum above the critical $2.40 resistance level, leading to
repeated rejections and weakening buyer confidence.
Is it worth investing in
XRP now?
Yes, the potential
upside catalysts include the pending SEC decision on Franklin Templeton’s XRP
ETF application on June 17, 2025, with market observers estimating up to 88%
probability of approval. The resolution of Ripple’s legal battle with the SEC,
including the recent $125 million settlement agreement, has removed a major
regulatory overhang that previously suppressed institutional interest.
What’s happening with XRP
at the moment?
XRP is
currently experiencing a critical inflection point as multiple catalysts
converge in June 2025. The token is trading around $2.15, having declined from
recent highs near $2.40, and is testing key technical support levels that could
determine its near-term direction.
Regulatory
developments remain at the forefront, with Ripple and the SEC filing a joint
motion to release $125 million from escrow, effectively concluding their
4.5-year legal battle. This settlement, while positive for long-term clarity,
has yet to provide the expected price boost as markets focus on technical
factors and broader economic conditions.
Is XRP likely to go down?
The
probability of further XRP declines depends largely on whether current
technical support levels hold. Bearish indicators include the confirmed
head-and-shoulders pattern with a measured target of $2.00, representing
approximately 14% downside from current levels. The breakdown below the $2.33
neckline has activated this bearish scenario, with initial support at $2.25
already tested.
The cryptocurrency market shows a sign of disruption as major tokens record a sharp drop toward critical support levels. Bitcoin in particular, has relinquished all its gains from this week, highlighting rising bearish sentiment.
Following in the footsteps, the altcoin market witnesses a similar price trend with Ethereum & XRP price constantly failing to break out of their consolidated price trend. With this, investors are actively looking for important watch zones as the market could expect increased volatility due to the ongoing geopolitical tensions.
Are you one of many to understand the market possibilities? In this article we will uncover the possible short-term targets of Bitcoin, Ethereum, & XRP tokens.
Bitcoin Price Forms A Bullish Pattern?
After recording a top of $110,198 this week, the Bitcoin price has experienced a strong selloff, resulting in its value recording a low of $104,161 yesterday. This has resulted in an increased FOMO-like situation in the crypto market. Moreover, with a drop of over 50% in its daily trading volume its valuation stands at $2.08 trillion.
Despite this downturn, BTC has formed an expanding channel pattern in the daily time frame. This suggests a high possibility of a reversal pattern in the upcoming time.
The 50-day EMA acts as a strong support around the $102,655 mark, indicating a major retest point around that level. Furthermore, the 200-day EMA displays a constant rise in the daily time frame, suggesting a building momentum.
On the other hand, the Moving Average Convergence Divergence (MACD) indicator shows a rising red histogram with its 12 & 26-day EMAs witnessing a bearish crossover. This indicates a mixed short term price action for BTC.
If the odds began to favor the bulls, this could result in the largest crypto token retesting its upper price targets of $107,281 & $109,631 respectively. Conversely, a bearish setback may pull the value toward its low of $104,810 or lower support of $102,470 during the upcoming week.
Ethereum Price Repeatedly Fails To Gain Momentum!
The ETH coin price continues recording a sideways price action by constantly hovering around the $2,500 mark this week. With this, it has formed a strong consolidated price action between $2,800 and $2,400 range. Moreover, with a project valuation of $307.28 billion, it dominates by 9.3689%.
In the above price chart, the trendline currently remains above 50, 100, & 200-day EMAs, and is currently retesting the 20-day EMA, suggesting strong bullish momentum. These Exponential Moving Averages (EMA) play a vital role during price corrections or market rallies, providing potential “safe exit points” for short-term investors.
The Relative Strength Index (RSI) has failed to breach the overbought range, resulting in it dropping toward its neutral point in the daily time frame. This type of trend suggests an increasing bearish action for Ethereum in the crypto market.
The Ethereum price could retest its immediate resistance level of $2,603 if the bulls regain momentum. Further upper resistance levels still remain around the $2,750 and $3,000 respectively. Conversely, a bearish reversal may result in it retesting its crucial support trend level of $2,400 or $2,205 shortly.
XRP Price On Crossroads This Week?
Ripple’s XRP price falls prey to a similar price action as it records a consolidated price action over the brief period of time. Consequently, this altcoin’s dominance has dropped to 3.86% this week with a market capitalization of $127.015 billion. However, despite such action, it continues to maintain its 4th position in the market.
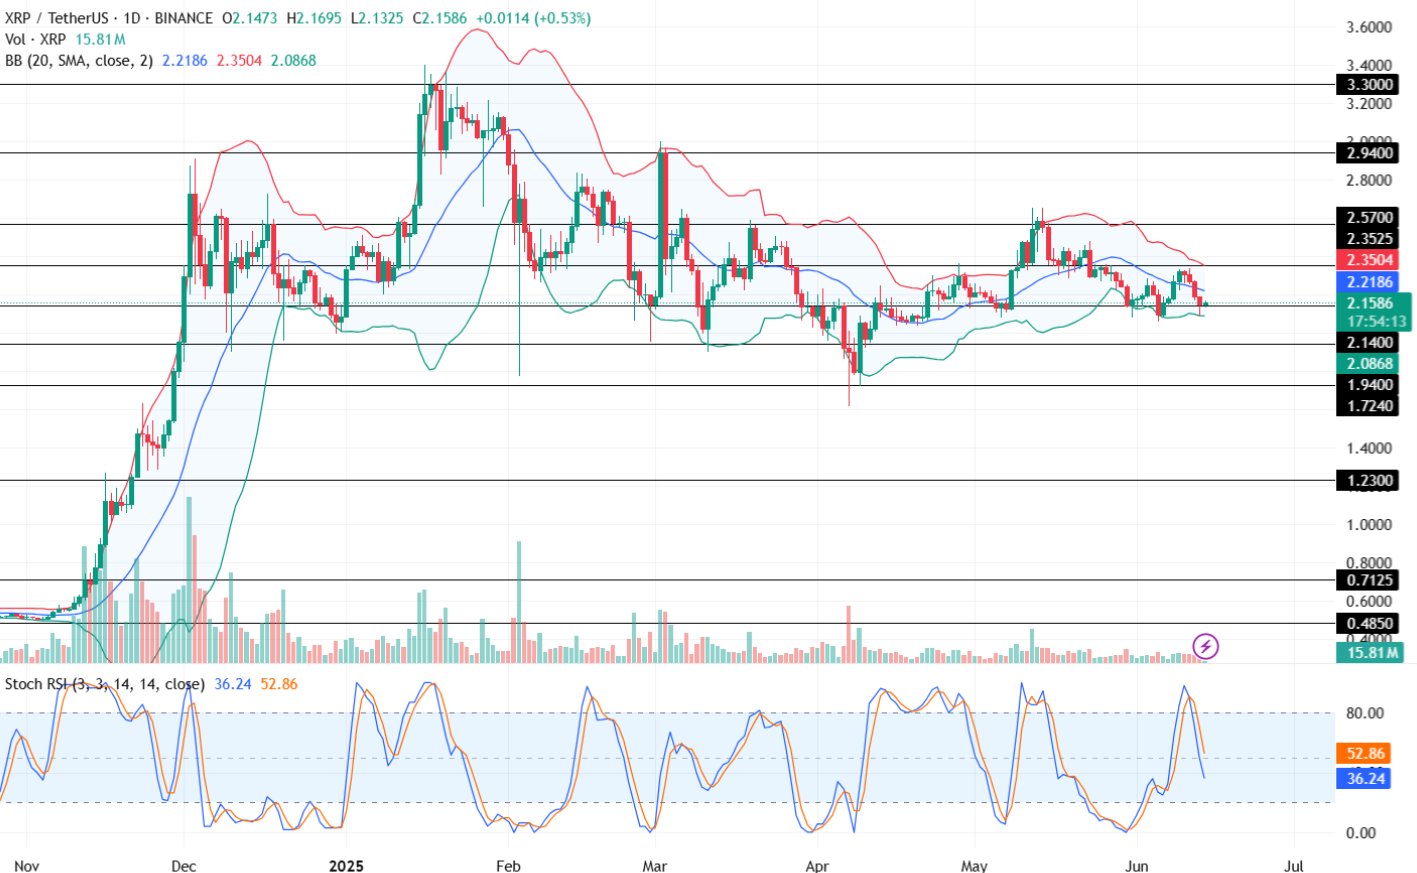
The Stoch RSI trendlines are at 36.24 (blue) and 52.86 (orange). The sharp drop toward the halfway mark suggests a weak bullish sentiment for altcoin in the 1D time frame. Notably, this indicator helps traders identify the overbought and oversold conditions more accurately than traditional RSI.
The Bollinger Bands (BB) records a narrow passage suggesting a decline in the price action for the XRP price. Adding to this, the price trend has dropped below the Simple Moving Average (SMA) line and is on the verge of retesting its lower band.
A successful retest around the $2.14 mark could result in it heading toward its upper price targets of $2.35 and $2.57 respectively. Conversely, its key support trendline still remains around the $2 mark if the market turns bearish.


-1749817287539.jpg "How Much Matcha is Too Much Matcha: Expert Explains Its Side Effects")