In a volatile crypto market, Solana (SOL) price regained momentum lately. After surging 17% over the past six days through Friday, it rose from a low of $142 to $166 as of June 11.
Such a rebound places SOL in an important resistance area. The technical indicator, DeFi usage, and ETF-related developments were all favoring additional gains.
As investor engagement increases and fundamentals improve, Solana price seems ready to challenge critical levels in the coming days.
Solana Price Eyes $180 After Reclaiming Support
The latest upward trend in Solana price is the result of a successful bounce off the $142 support zone. This recovery has restored the confidence among traders. The volumes have gone up by over 40% in a day, as indicated by CoinMarketCap.
At press time, SOL price was approximately $158 and tested a crucial horizontal resistance area between $165 and $170.
Technical analyst Posty highlighted a breakout setup showing Solana price reclaiming previous demand zones and forming higher lows. The structure favored a short-term rally up to the level of $180.
SOL Price has overcome the first resistance and now approaches mid-term consolidation zones. A bullish close above $170 would be a good indication that momentum is continuing, and the next technical target would be $180.
Source: Posty, X
This follows the bullish structures on the 4-hour chart, and a clean break and retest sequence is developing.
As long as the altcoin maintains this bullish market structure, Solana price is expected to hold its upward trajectory.
Analyst Showed Bullish Structure for SOL Price With $220 Target
Furthermore, analyst Immortal strengthened the bullish thesis. In his analysis, he showed a classic inverse head-and-shoulders pattern developing around the $155-$160 area. This reversal formation indicates that the bottom of a new uptrend is being formed.
The chart also included a projected move showing Solana price rising to $220.62, representing a potential 39% upside from the current price.
Meanwhile, the immediate support of $153 -159 has been tested several times, which speaks of accumulation. The pattern’s neckline aligns closely with the $166 level currently being contested.
Source: Inmortal, X
The chart risk-reward box highlighted an 8.1 to 1 reward ratio, which is a good example of asymmetric reward potential in favor of buyers.
This structure, combined with increasing trading volumes, supports a breakout continuation scenario. That is if SOL price stays above $159 and clears $170 on higher timeframes.
Network Activity Supports Bullish Outlook
In addition, Solana’s fundamentals support the ongoing rally. According to DeFiLlama data, Solana’s DeFi Total Value Locked has increased by $860 million over the past five days to $8.81 billion.
Interestingly, such a rise underscored a previously unseen level of on-chain activity, users interacting with decentralized exchanges and liquidity protocols.
Adding weight to this, DEX volumes on the Solana network almost doubled, with an increase of $1.53 billion on June 8 to $2.95 billion on June 11.
The price action has more supporting volume and liquidity surge, and bullish breakouts are more sustainable.
Increased activity is not limited to traditional DeFi. Trading meme coins on Solana blockchain also saw an increase, with the SOL-based meme coin market cap increasing by 6.7% over the last 24 hours. This speculative activity has historically preceded larger moves in Solana price.
ETF Approval Optimism Adds to On-Chain Momentum
On the regulatory front, spot Solana ETF approval odds have climbed to 61%, the highest since January, according to Polymarket.
This increase follows the U.S. Securities and Exchange Commission’s demand for updated S-1 registration statements of ETF issuers, as the regulator takes a step forward in the examination procedure.
Should regulatory developments proceed, a spot ETF launch can result in additional capital flows into SOL. In the meantime, the new development provides a solid macro story to the already positive technical and network indicators.
The cryptocurrency market is buzzing with optimism following a notable statement from Jesse Pollak, a prominent figure in the crypto space and contributor to the Base ecosystem, who tweeted on June 13, 2025, that ‘today is a good day to grow on Base.’ This statement, shared via his official Twitter account, has sparked interest among traders and investors, particularly those focused on layer-2 scaling solutions for Ethereum like Base, which is backed by Coinbase. As of 10:00 AM UTC on June 13, 2025, the crypto market has shown a positive response, with Ethereum (ETH) trading at $3,450, up 2.3% in the last 24 hours, according to data from CoinMarketCap. Base, as a layer-2 solution, directly benefits from Ethereum’s price movements and network activity, making this tweet a potential catalyst for increased attention. Additionally, trading volume for ETH has surged by 15% over the same period, reaching $18.2 billion, reflecting heightened market interest. This event also ties into broader stock market dynamics, as Coinbase (COIN) stock, listed on NASDAQ, saw a 1.8% increase to $225.40 as of the market close on June 12, 2025, per Yahoo Finance, signaling institutional confidence in Coinbase-related projects like Base.
From a trading perspective, Jesse Pollak’s statement could drive short-term momentum for Ethereum-based assets and tokens associated with the Base ecosystem. Traders should monitor key trading pairs such as ETH/USDT and ETH/BTC on major exchanges like Binance and Coinbase, where ETH/USDT saw a price spike to $3,455 at 11:30 AM UTC on June 13, 2025, with a 24-hour trading volume of $5.6 billion, as reported by Binance. The correlation between Coinbase stock performance and Ethereum’s price is also worth noting, as institutional money flow into COIN often translates to increased liquidity in Ethereum and layer-2 solutions like Base. This creates potential trading opportunities for scalpers and swing traders looking to capitalize on quick price movements in ETH and related tokens. Furthermore, on-chain metrics from Dune Analytics show a 12% increase in transactions on Base, reaching 1.2 million daily transactions as of June 13, 2025, at 12:00 PM UTC, indicating growing user adoption. Traders can use this data to assess whether the hype translates into sustained network growth, potentially impacting long-term holdings of ETH and Base-related assets.
Technical indicators further support a bullish outlook for Ethereum and Base ecosystem tokens following this event. The Relative Strength Index (RSI) for ETH stands at 62 on the 4-hour chart as of 1:00 PM UTC on June 13, 2025, per TradingView, suggesting the asset is nearing overbought territory but still has room for upward movement. Additionally, the Moving Average Convergence Divergence (MACD) shows a bullish crossover, with the MACD line crossing above the signal line at 9:00 AM UTC on the same day, indicating positive momentum. Trading volume for Base-related decentralized finance (DeFi) tokens has also spiked, with data from CoinGecko showing a 20% increase in volume for projects like Aerodrome Finance (AERO), reaching $8.5 million in the last 24 hours as of 2:00 PM UTC on June 13, 2025. In terms of stock-crypto correlation, the positive movement in Coinbase stock (COIN) often acts as a leading indicator for Ethereum price rallies, as institutional investors rotate capital between traditional markets and crypto. According to a report by Bloomberg, institutional inflows into crypto markets have risen by 10% week-over-week as of June 12, 2025, suggesting that events like Pollak’s tweet could amplify risk appetite. Traders should remain cautious of potential profit-taking, as rapid price increases in ETH (up 2.3% in 24 hours) could trigger sell-offs if resistance at $3,500 is not breached by the end of trading on June 13, 2025.
In summary, the interplay between Jesse Pollak’s optimistic statement, Base’s on-chain growth, and Coinbase’s stock performance highlights a unique cross-market opportunity for crypto traders. The correlation between COIN stock and Ethereum’s price movements underscores the importance of monitoring institutional sentiment, especially as trading volumes for ETH and Base-related tokens continue to climb. With concrete data points like a 15% surge in ETH trading volume and a 12% rise in Base transactions as of June 13, 2025, traders have actionable insights to navigate this momentum. Keeping an eye on resistance levels and institutional money flow will be critical for maximizing returns while managing risks in this dynamic market environment.
FAQ: What does Jesse Pollak’s tweet mean for Base and Ethereum traders? Jesse Pollak’s tweet on June 13, 2025, signaling optimism for growth on Base, has sparked interest in the layer-2 solution and Ethereum. With ETH trading at $3,450 and a 2.3% increase in the last 24 hours as of 10:00 AM UTC, traders can explore short-term opportunities in ETH pairs and Base-related tokens, while monitoring on-chain activity and volume spikes.
How does Coinbase stock performance impact crypto markets? Coinbase (COIN) stock, which rose 1.8% to $225.40 as of market close on June 12, 2025, often correlates with Ethereum price movements. Institutional money flow into COIN can increase liquidity in ETH and layer-2 solutions like Base, creating potential trading opportunities for crypto investors.
A top market analyst has suggested that Dogecoin will rally to a four-year high when the current downside ends, highlighting a major support level to watch.
Master Ananda shared this view in a TradingView analysis today amid a broader market recession. Bitcoin dropped to an intraday low of $102,758, sparking a broader market downtrend that did not spare Dogecoin.
DOGE, the largest meme coin by market cap, joined the wave and is already down 4.8% today. Unless the current momentum reverses, the token is on the cusp of its third consecutive losing day, having retraced 13.6% during this period.
Analyst Identifies Crucial Support
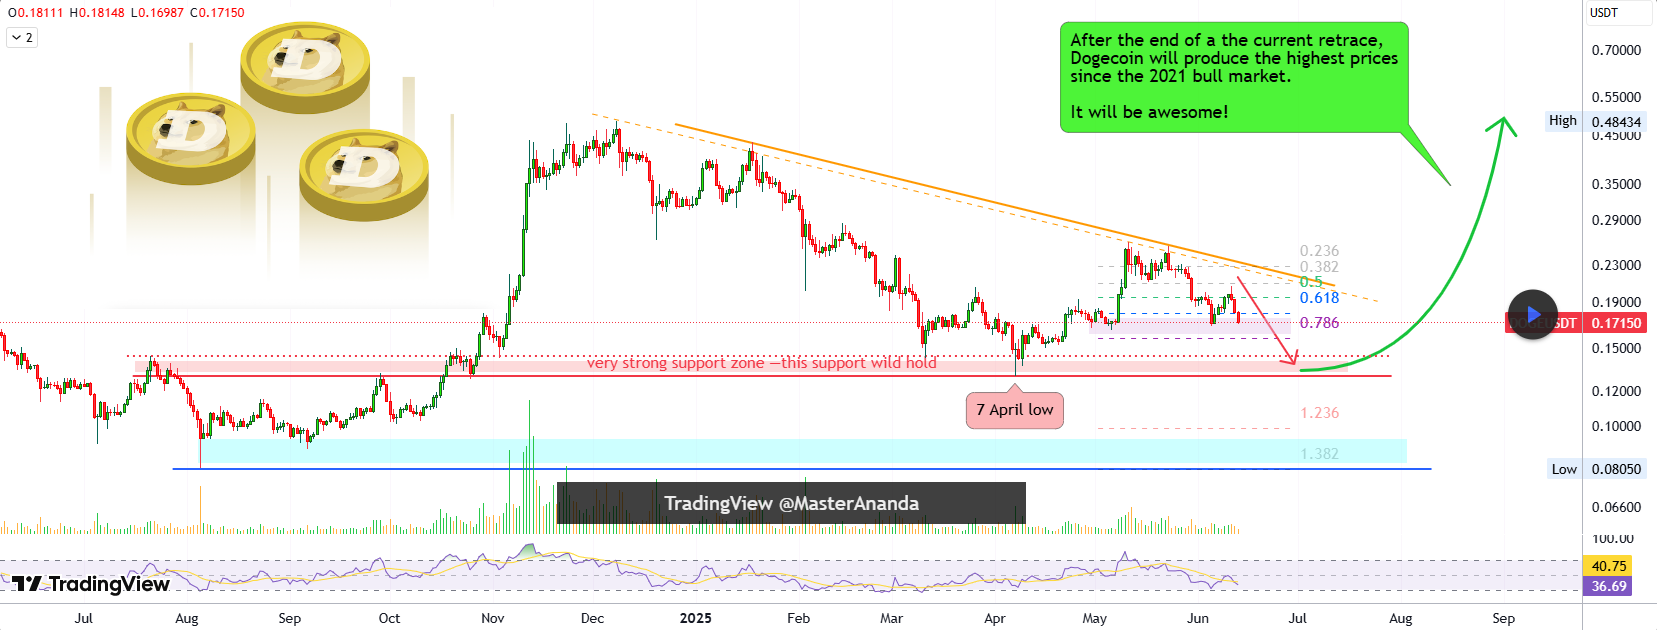
For context, Master Ananda noted that he expected Dogecoin’s current price crash as its chart structure formed a lower high on June 5, a sign of a bearish reversal. While Dogecoin rebounded from the lows of the earlier-mentioned date, it has given back its gains, aligning with the bearish indicator.
Meanwhile, the analyst identified macro support levels at the 0.618 and 0.786 Fibonacci retracement levels, at $0.178 and $0.158, respectively, that could serve as a short-term hedge against escalating price weakness. However, he noted that they are weak supports and may not suffice for the bearish momentum.
Dogecoin Analysis per MasterAnanda
Notably, DOGE has broken down from the 0.618 Fib. Support level at its current price but remains 8.6% away from the 0.786 Fibonacci level. Master Ananda noted that if the levels fail to hold, Dogecoin seems poised to retest the lows last seen in April.
Specifically, Dogecoin bounced from a major support level around $0.13 in April, a level that served as support in July 2024 and as resistance in September 2024. Notably, the meme coin retested the support in October and November of the same year but bounced extensively at each retest.
The analyst expects the $0.13 support to tame Dogecoin’s bearish momentum again if prices dump to the level. He noted that the RSI would have to go into extreme weakness for prices to fall below, which is very unlikely.
What’s Next After Support Retest?
Interestingly, Master Ananda advised going all in at the April 7 lows if prices ever retraced to that point, insisting it would be a great buy. As Dogecoin bounced from the support in October before rallying over 200%, he predicted a similar outcome.
Per the accompanying chart, the analyst expects Dogecoin to rebound from the lows and target a four-year price high. He predicted an over 250% upsurge in support to levels above December’s high of $0.484.
Dogecoin trades at $0.173 at the time of writing, 20% away from this support and 180% from the projected high. It bears mentioning that other analysts see DOGE surpassing the $0.484 mark this cycle, with targets like $1 and $2.9 in the books.
DisClamier: This content is informational and should not be considered financial advice. The views expressed in this article may include the author’s personal opinions and do not reflect The Crypto Basic opinion. Readers are encouraged to do thorough research before making any investment decisions. The Crypto Basic is not responsible for any financial losses.
The Cardano ecosystem could soon undergo a strategic treasury shift to energize its DeFi and stablecoin sectors.
On June 13, the network founder Charles Hoskinson suggested allocating around $100 million worth of ADA from the network’s treasury towards a mix of stablecoins and Bitcoin.
According to him:
“[W]e take about a hundred million worth of ADA in the treasury and convert it to a blend of a collection of stablecoins incumbent in Cardano, so USDM, USDA, as well as ADA-backed stable synthetics like iUSD and also convert some of it to Bitcoin to prime the Bitcoin DeFi.”
“What is killing Cardano is our stablecoin situation. This would start to solve it. Generate some non-inflationary revenue for the treasury, and help build up our DeFi economy.”
However, Hoskinson noted that any such move would depend on evaluating the readiness of Cardano-based DeFi protocols and ensuring sustainable ecosystem yields.
Hoskinson’s concerns are prescient considering Cardano trails far behind major players like Solana and Ethereum in DeFi and stablecoin activities.
According to DeFiLlama data, the network ranks 46th in global stablecoin activity, with a market cap of roughly $31.3 million. At the same time, the total value of assets locked on the network for DeFi activity is less than $400 million, far below that of other rival networks, which run into billions.
ADA sale impact
Meanwhile, community concerns have surfaced that selling $100 million worth of ADA could negatively affect the token’s price.
However, Hoskinson dismissed these fears, arguing that Cardano’s liquidity can easily handle such a transaction.
He said:
“The markets are deep. We could convert 140 million ADA over a week or so without moving the market using OTCs and TWAPs. It’s a false narrative.”
Hoskinson also noted that the sale would exert minimal price pressure if appropriately executed, arguing that the perception of a large sale might cause more volatility than the sale itself.
“The markets are deep. Billions of dollars of ADA trade hands every week across the world. The belief that Cardano DeFi is bullish alone would create enough buy demand to offset a liquidation at this scale. If 100 million could move the market, Cardano would have extreme volatility.”
Spending just a few minutes in the sun can help your body produce vitamin D, a hormone that supports bone health. However, sun exposure carries a risk of skin cancer, and experts recommend getting vitamin D through diet or supplements instead.
How Much Sun Do You Need for Vitamin D?
If you’re using sunscreen and plan to be outside anyway, brief sun exposure may help with vitamin D production. Research shows that about 10 minutes of midday sun with 25% of the body exposed—such as the arms and legs—can meet daily vitamin D needs during spring and summer.
“In winter, especially in northern regions, it may take up to two hours with only 10% of the body exposed, like the face and hands, to get the same amount,” said Shoshana Marmon, MD, PhD, an assistant professor of dermatology at New York Medical College.
“The sun is not a dependable source to ensure you have enough vitamin D,” Heather D. Rogers, MD, a dermatologist in Seattle, told Verywell. “The safest and most consistent way to get adequate vitamin D is through your diet—eating vitamin D–rich foods, choosing fortified options, and using supplements as needed.”
Although experts advise against relying on sun exposure for all your vitamin D needs, this doesn’t mean you should avoid sunlight altogether. Even with sunscreen, your body may still produce some vitamin D.
“Not having enough sun exposure can contribute to increased anxiety, depression, cognitive decline, and greater difficulty managing everyday stressors,” said Samia Estrada, PsyD, a clinical psychologist based in Vacaville, CA. “Getting sun while also exercising has been found to have a favorable impact on stress management.”
Where Should You Get Vitamin D?
Vitamin D’s primary role is to help the body absorb calcium from the intestines, which helps strengthen your bones, said Karl Insogna, MD,director of the Yale Bone Center at Yale Medicine.
Insgona said both vitamin D2 and D3 naturally occur in foods such as salmon, tuna, mackerel, beef liver, and egg yolks. But because most people don’t eat enough of these foods, many products—including milk, certain cereals, and some orange juice brands—have been fortified with vitamin D.
Are You Getting Enough Vitamin D?
Vitamin D is measured in international units (IU). The recommended daily intake is 600 IU for ages 1 to 70, and 800 IU for those 71 and older.
According to the National Institutes of Health, most people in the United States have adequate blood levels of vitamin D, but about 25% do not. As you age, your skin becomes less efficient at producing vitamin D, which may increase your need for supplements or vitamin D–rich foods.
The U.S. Preventive Services Task Force currently states that there isn’t enough evidence to recommend for or against routine vitamin D testing in people without symptoms of a deficiency.
Your healthcare provider may order a blood test to measure your vitamin D levels—or you can ask for one. If your levels are low, your provider may recommend dietary changes or a supplement.
What This Means For You
While brief sun exposure may contribute to vitamin D production, experts recommend getting the vitamin primarily through food or supplements to reduce skin cancer risk. If you’re concerned about your vitamin D levels, talk to your healthcare provider about testing and safe ways to increase your intake.
Verywell Health uses only high-quality sources, including peer-reviewed studies, to support the facts within our articles. Read our editorial process to learn more about how we fact-check and keep our content accurate, reliable, and trustworthy.
Bitcoin searches for support near $103,000, but rising uncertainty in global markets could cap future rallies.
Select altcoins are finding buyers at lower levels, indicating traders’ desire to buy the dip.
Bitcoin (BTC) corrected below $103,000 on news of Israel’s airstrikes on Iran, but a positive sign is that lower levels witnessed buying, pushing the price near $106,000.
Trading resource Material Indicators said in a post on X that Bitcoin’s bottom is unlikely to drop out, but sustainable upside price discovery may not happen before the next Fed meeting.
Another positive view came from a study by ETC Group head of research Andre Dragosch. It showed that Bitcoin recovers and often surpasses the pre-event price levels within 50 days.
Crypto market data daily view. Source: CoinMarketCap
However, Bollinger Bands creator John Bollinger has a different view. In a post on X, Bollinger said that Bitcoin has completed three pushes to a high after forming the “W-shaped” double bottom near $75,000. During a discussion on the post, Bollinger added that three pushes to a high “means the end of the prior trend,” which could be followed by a “reversal or a consolidation.”
Could Bitcoin and select altcoins resume their uptrends? Let’s analyze the charts of the top 10 cryptocurrencies to find out.
Bitcoin price prediction
Bitcoin fell to the 50-day simple moving average ($103,159) on Friday where the bulls are trying to arrest the decline.
The 20-day exponential moving average ($106,097) is flattening out, and the relative strength index (RSI) is near the midpoint, signaling a possible consolidation in the near term. The crucial levels to watch out for are $100,000 on the downside and the all-time high of $111,980 on the upside.
If the $100,000 level gives way, the BTC/USDT pair could tumble to $92,000. Conversely, a break and close above $111,980 signals the resumption of the uptrend. The pair could then soar to $130,000.
Ether price prediction
Ether (ETH) turned down from $2,879 on Wednesday and nosedived below the 20-day EMA ($2,580) on Friday, suggesting the markets rejected the breakout above $2,738.
The 20-day EMA is flattening out, and the RSI has dropped to the midpoint, indicating a balance between supply and demand. If the price turns up from the current level or $2,323, the bears will attempt to halt the relief rally in the $2,738 to $2,879 zone. If the price turns down from the overhead zone, the ETH/USDT pair may consolidate for some more time.
Buyers will have to catapult the price above $2,879 to start the next leg of the up move toward $3,153. On the downside, a break below $2,323 could sink the pair to $2,111.
XRP price prediction
XRP (XRP) broke above the moving averages on Monday, but the bulls could not build upon the momentum.
The price turned down on Wednesday and has reached near the solid support at $2. Buyers are expected to vigorously defend the $2 level as a break and close below it could signal the start of a new downtrend. The XRP/USDT pair could descend to $1.61 and, after that, to $1.28.
Contrary to this assumption, if the price turns up sharply from $2 and breaks above the moving averages, it suggests the range-bound action may continue for a while longer.
BNB price prediction
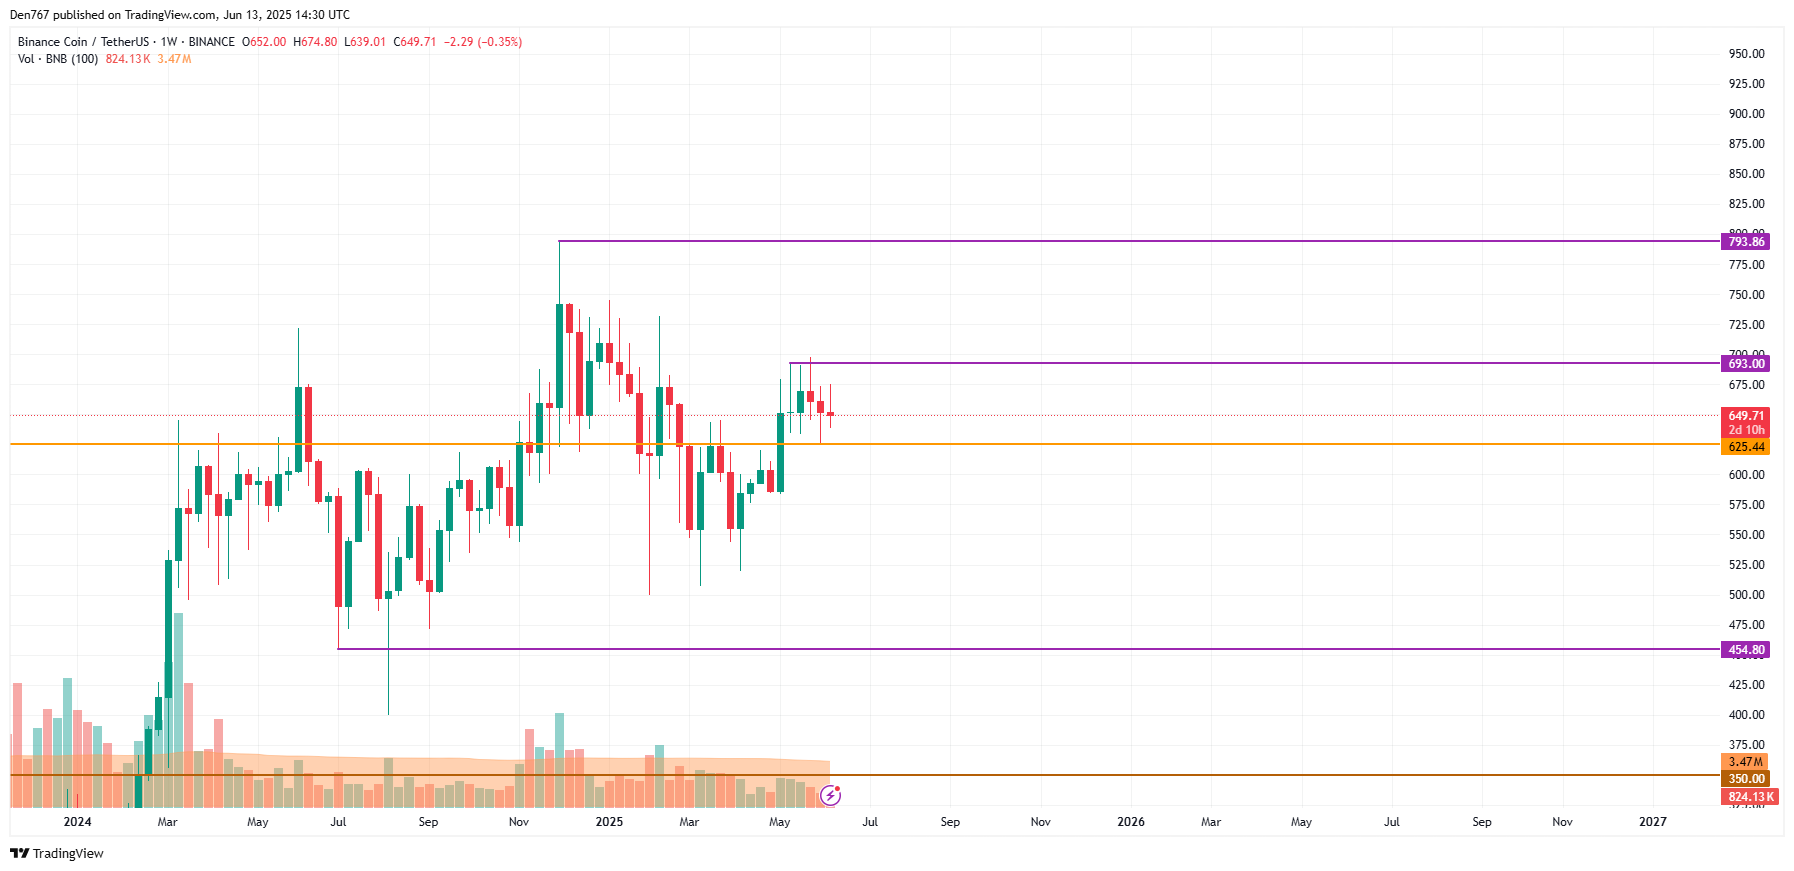
BNB (BNB) has been consolidating between $693 and $634 for several days, indicating a balance between supply and demand.
The flattish 20-day EMA ($658) and the RSI near the midpoint do not give a clear advantage either to the bulls or the bears. If the price turns up from $634 and rises above the 20-day EMA, the BNB/USDT pair could remain inside the range for some more time.
Contrarily, a break and close below $634 suggests that the bears have overpowered the bulls. That could intensify selling, pulling the pair to $600. Buyers are expected to aggressively defend the $580 to $600 support zone.
Solana price prediction
Solana (SOL) rose above the moving averages on Monday, but the bulls could not sustain the higher levels.
The price turned down from $168 on Wednesday and broke below the moving averages on June 12. The SOL/USDT pair has reached the $140 support, which is a critical level for the bulls to defend.
If the price rebounds off the $140 support, the bulls will again try to shove the price above the moving averages. On the contrary, a break and close below $140 could sink the pair to $123 and eventually to $110.
Dogecoin price prediction
Dogecoin (DOGE) turned down from the $0.21 level on Wednesday, indicating that the price remains stuck inside the lower half of the $0.26 to $0.14 range.
There is support at $0.16, but it is likely to be broken. The DOGE/USDT pair could then plummet to the $0.14 support, where the buyers are expected to step in. A solid bounce off the $0.14 level could extend the range-bound action for a while longer.
The next trending move is likely to begin on a break above $0.26 or below $0.14. If the $0.14 level cracks, the pair could collapse to $0.10. On the other hand, a break above $0.26 could drive the pair to $0.38.
Cardano price prediction
Cardano (ADA) turned down from the 50-day SMA ($0.72) on Wednesday, indicating that the bears continue to sell on rallies.
The down-sloping 20-day EMA ($0.69) and the RSI in the negative territory signal the bears have an edge. If the $0.60 level is taken out, the ADA/USDT pair could plummet to the solid support at $0.50. Buyers are expected to defend the $0.50 level with all their might.
The first sign of strength will be a break and close above the 50-day SMA. That opens the doors for a rise to the downtrend line, which is a significant level to watch out for. A break and close above the downtrend line suggests a potential trend change.
That may have tempted short-term buyers to book profits, pulling the price toward the breakout level from the symmetrical triangle pattern. The upsloping 20-day EMA ($35.93) signals an advantage to buyers, but the developing negative divergence on the RSI suggests the bullish momentum is weakening. Buyers will have to propel the price above $44 to resume the uptrend toward $50.
On the downside, a break and close below the 20-day EMA could accelerate selling, pulling the pair to $30.50.
Sui price prediction
Sui (SUI) turned down from the 50-day SMA ($3.55) on Wednesday, indicating that bears are fiercely defending the level.
The SUI/USDT pair has reached solid support at $2.86, which is a crucial level to watch out for. Sellers will try to seize control by pulling the price below the $2.86 level. If they can pull it off, the pair could tumble to $2.50.
Buyers are likely to have other plans. They will try to defend the $2.86 level. If the price bounces off the $2.86 support, the pair could reach the moving averages. If the price turns down sharply from the moving averages, it increases the risk of a break below $2.86. Buyers will have to drive the pair above the moving averages to clear the path for a rally toward the $4.25 resistance.
Chainlink price prediction
Chainlink (LINK) turned down and re-entered the descending channel pattern on Thursday, indicating that sellers are active at higher levels.
The bears are trying to pull the price below the $12.64 support. If they manage to do that, the LINK/USDT pair risks a fall to $10. Such a move extends the pair’s stay inside the channel for a few more days.
Buyers will have to swiftly push the price above the $16 level to prevent the downside move. That indicates aggressive buying at lower levels. The pair could rise to $18 and then to $20, signaling a potential trend change.
This article does not contain investment advice or recommendations. Every investment and trading move involves risk, and readers should conduct their own research when making a decision.
Israel’s Iran Strikes Trigger USD Rebound, Euro Retreats Versus US Dollar from 43-Month Highs
The Euro to Dollar exchange rate (EUR/USD) surged to 43-month highs just above 1.1630 on Thursday as the dollar came under renewed pressure.
There was, however, a sharp retreat to lows below 1.1520 on Friday following Israel’s strike on Iran’s nuclear facilities with a surge in geo-political tensions and a spike in oil prices while equity markets retreated.
According to ING; “we think the starting point was already quite rich for the pair, and a return to the 1.14-1.15 seems entirely appropriate.”
Danske Bank noted; “The attack adds significant uncertainty to diplomacy, with US officials denying direct involvement while cautioning that it could either hinder or, unexpectedly, pressure Iran towards discussions.”
The Israeli strikes have added to underlying trade and economic uncertainty. There will inevitably be unease over any escalation while markets are closed with demand for safe-haven assets.
OCBC currency strategist Christopher Wong commented; “Geopolitical noise may temporarily distort the dollar downtrend and temporarily weigh on risk proxies especially heading into the weekend.”
According to ING; “The key difference from previous Israel-Iran standoffs is that nuclear facilities have now been targeted, and while oil production does not seem to be affected just yet, markets have to add in a bigger risk premium given the crucial role of Iran in global oil supply.”
Nordea commented; “Geopolitical worries added to the list of potential headwinds for risk appetite, with Israel attacking Iran’s nuclear facilities and Iran retaliating. Oil prices shot up as a result, though from rather low levels.”
It added; “It is worth remembering that geopolitical tensions like these seldom remain the main market driver for a longer time, though as noted, this time they are by far not the only factor causing worries.”
According to ING; “The risks now point more definitively towards a prolonged period of tension, in contrast to recent episodes. And we think this could continue to take some pressure off the dollar.”
There are still doubts whether the dollar can secure sustained support given fundamental concerns and risk of capital outflows.
The Euro has also gained net support from increased speculation that the ECB will decide against further interest rate cuts.
MUFG commented; “The developments could provide a timely test of the US dollar’s traditional safe haven appeal after it hit fresh year to date lows yesterday prior to Israel’s military strikes.”
In this context, the dollar was subjected to further selling pressure on Thursday with further evidence of a softer labour market reinforcing expectations that the Federal Reserve would move close to interest rate cuts.
Continuing jobless claims rose to their highest level since November 2021.
MUFG commented; “we still expect the Fed to be reluctant to cut rates at upcoming policy meetings in June or July until they have more clarity over US trade policy and impact on inflation and labour market.”
It added; “At the same time, the release yesterday of the latest weekly initial and continuing claims have added to concerns that the US labour market is continuing to soften in response to trade disruption and heightened policy uncertainty.”
ING, however, also considers that the dollar is over-sold; “We had felt the USD negative reaction to the soft CPI print was exaggerated, and new geopolitical tensions give the Fed another argument to stay cautious, arguing for that CPI move to be scaled back.”
Like this piece? Please share with your friends and colleagues:
International Money Transfer? Ask our resident FX expert a money transfer question or try John’s new, free, no-obligation personal service! ,where he helps every step of the way,
ensuring you get the best exchange rates on your currency requirements.
This week the Council for Responsible Nutrition (CRN) hosted its annual ‘Day on the Hill.’ The day—packed with carefully-crafted messages and meetings with congressional staffers—gave about 75 dietary supplement players the opportunity to influence the industry’s regulatory future.
“Today is CRN’s annual Day on the Hill, which means it’s the day that we bring our member company executives into Washington, D.C. to have them meet face-to-face with their members of Congress,” said Steve Mister, president and CEO at CRN.
“It’s an amazing day for our teams to come together. From manufacturers to brand marketers to ingredient suppliers and beyond—we’re all aligned on the same set of issues,” added Bruce Brown, chairman of the CRN Board. “We come together, whether competitors or collaborators, with a unified message, and I think that’s really important for the industry.”
That unified message includes four distinct advocacy points: Increasing access by making all supplements FSA and HSA eligible, establishing a mandatory product listing, making members of Congress aware of the implications that tariffs have on the industry and modernizing the Drug Preclusion Act.
Being heard amid all the ‘noise’
“CRN staff that’s based here in Washington can make these arguments all the time, but when members hear from their real-life constituents, the people who create jobs in their district, the people who are responsible for the voters [and] livelihoods, the best way to cut through the clutter is to let them hear from the real members of the industry,” Mister said.
David Trosin, managing director for NSF International’s Health Sciences Certification Program, said as a D.C. resident, the environment can often feel chaotic, but staying focused is key.
“Among all that chaos, perhaps the best thing for people to do is live a healthy lifestyle—eat well, exercise and supplement to make sure you’re getting the micro and macro nutrients you need,” he said.
“That’ll go a long way to making you feel better in this chaos and to have an industry that is supporting healthy nutrition and healthy lifestyles. I think that if people know that we’re here for them and they can stay ahead of it, that they can retain their physical health, they can retain their mental health. That’s a good thing. And it’s a great industry to be a part of.”
Brown said that the bipartisan spirit from his day on the Hill left him feeling inspired.
“When I leave today, I actually leave inspired by the discussions we had on both sides of the aisle and a real willingness to listen and hear our needs as it relates to the industry of dietary supplements and improving access to important healthy nutrition products for American consumers,” he said. “Regardless of some of the division we see, public health is a priority across the aisle.”
On the hourly chart, the rate of BNB is falling after setting a local resistance of $659.42. If bulls cannot seize the initiative, traders may witness a test of the $640 range.
From the midterm point of view, ongoing sideways trading remains the most likely scenario. The volume keeps falling, which means traders might witness consolidation in the area of $640-$680 over the next few weeks.
Chinese tech giant Tencent is exploring a potential acquisition of Nexon, the South Korean game developer behind the hit title Dungeon & Fighter, Bloomberg reports. Nexon is heavily invested in Web 3 gaming, including the ambitious MapleStory franchise.
The firm has reportedly approached the family of Nexon’s late founder Kim Jung-ju, who controls a 44.4% stake in Nexon via holding company NXC Corp, to discuss a potential acquisition.
Discussions are still preliminary, and there’s no guarantee they will result in a deal, the report states, citing sources close to the matter.
If successful, Tencent would be acquiring a company with a $16.6 billion market capitalization, a move that could reignite its ambitions in global gaming M&A after a slowdown sparked by Chinese regulatory crackdowns in 2020.
The deal could help Tencent secure long-term control over popular intellectual property and give it a firmer foothold in South Korea’s lucrative gaming market.
But any deal would be complicated.
The Kim family inherited control after the founder’s death in 2022 and has since handed shares to the Korean government to cover inheritance taxes. The government has been unable to offload its stake.
Tencent previously tried to buy Nexon in 2019, but talks collapsed over pricing. This new attempt follows Tencent’s $1.3 billion investment in a new Ubisoft unit and a 10% stake in K-pop label SM Entertainment.
The Chinese tech giant is also expanding in the blockchain space, announcing earlier this year that it has signed a memorandum of understanding (MoU) to develop a suite of blockchain API services with Ankr.




:max_bytes(150000):strip_icc()/VWH-GettyImages-1318637613-8da22eb16afc49919e6c3d145a9845dc.jpg "How Much Sun Do You Really Need to Get Enough Vitamin D?")