About Editorial team of BIPNs

Main team of content of bipns.com. Any type of content should be approved by us.
4 06, 2025

XAG/USD bulls have the upper hand near mid-$34.00s, just below YTD top

By |2025-06-04T09:54:22+03:00June 4, 2025|Forex News, News|0 Comments


  • Silver consolidates in a narrow trading band just below the YTD peak touched on Monday.
  • The bullish technical setup supports prospects for a further near-term appreciating move.
  • Any corrective slide below the $33.00 mark is likely to get bought into and remain limited.

Silver (XAG/USD) struggles to capitalize on the overnight bounce from sub-$34.00 levels and oscillates in a narrow trading band during the Asian session on Wednesday. The white metal currently hovers around the $34.50 area, nearly unchanged for the day, though it remains close to the year-to-date peak (YTD) touched on Monday.

From a technical perspective, this week’s breakout through the $33.80 barrier, or the top boundary of a multi-week-old range, was seen as a key trigger for bullish traders. Moreover, oscillators on the daily chart are holding comfortably in positive territory and are still away from being in the overbought zone. This, in turn, suggests that the path of least resistance for the XAG/USD is to the upside and backs the case for a further near-term appreciating move.

Some follow-through buying beyond the $34.8-$34.90 region, or the YTD top and a twelve-year high touched in October 2024, will reaffirm the constructive outlook and pave the way for additional gains. The XAG/USD might then accelerate the momentum towards the next relevant hurdle near the $35.66 area, or March 2012 swing high, before aiming to reclaim the $36.00 mark for the first time since February 2012.

On the flip side, corrective slides below the $34.00 mark could be seen as a buying opportunity and remain limited near the aforementioned trading range resistance breakpoint, around the $33.65 region. A sustained break below the latter, however, could drag the XAG/USD to the $33.00 round figure. This is followed by the $32.75-$32.70 strong horizontal support, which if broken decisively might shift the near-term bias in favor of bearish traders.

Silver daily chart

Silver FAQs

Silver is a precious metal highly traded among investors. It has been historically used as a store of value and a medium of exchange. Although less popular than Gold, traders may turn to Silver to diversify their investment portfolio, for its intrinsic value or as a potential hedge during high-inflation periods. Investors can buy physical Silver, in coins or in bars, or trade it through vehicles such as Exchange Traded Funds, which track its price on international markets.

Silver prices can move due to a wide range of factors. Geopolitical instability or fears of a deep recession can make Silver price escalate due to its safe-haven status, although to a lesser extent than Gold’s. As a yieldless asset, Silver tends to rise with lower interest rates. Its moves also depend on how the US Dollar (USD) behaves as the asset is priced in dollars (XAG/USD). A strong Dollar tends to keep the price of Silver at bay, whereas a weaker Dollar is likely to propel prices up. Other factors such as investment demand, mining supply – Silver is much more abundant than Gold – and recycling rates can also affect prices.

Silver is widely used in industry, particularly in sectors such as electronics or solar energy, as it has one of the highest electric conductivity of all metals – more than Copper and Gold. A surge in demand can increase prices, while a decline tends to lower them. Dynamics in the US, Chinese and Indian economies can also contribute to price swings: for the US and particularly China, their big industrial sectors use Silver in various processes; in India, consumers’ demand for the precious metal for jewellery also plays a key role in setting prices.

Silver prices tend to follow Gold’s moves. When Gold prices rise, Silver typically follows suit, as their status as safe-haven assets is similar. The Gold/Silver ratio, which shows the number of ounces of Silver needed to equal the value of one ounce of Gold, may help to determine the relative valuation between both metals. Some investors may consider a high ratio as an indicator that Silver is undervalued, or Gold is overvalued. On the contrary, a low ratio might suggest that Gold is undervalued relative to Silver.


Source link

4 06, 2025

The EURJPY attempts to activate the bullish track– Forecast today – 4-6-2025

By |2025-06-04T09:51:59+03:00June 4, 2025|Forex News, News|0 Comments

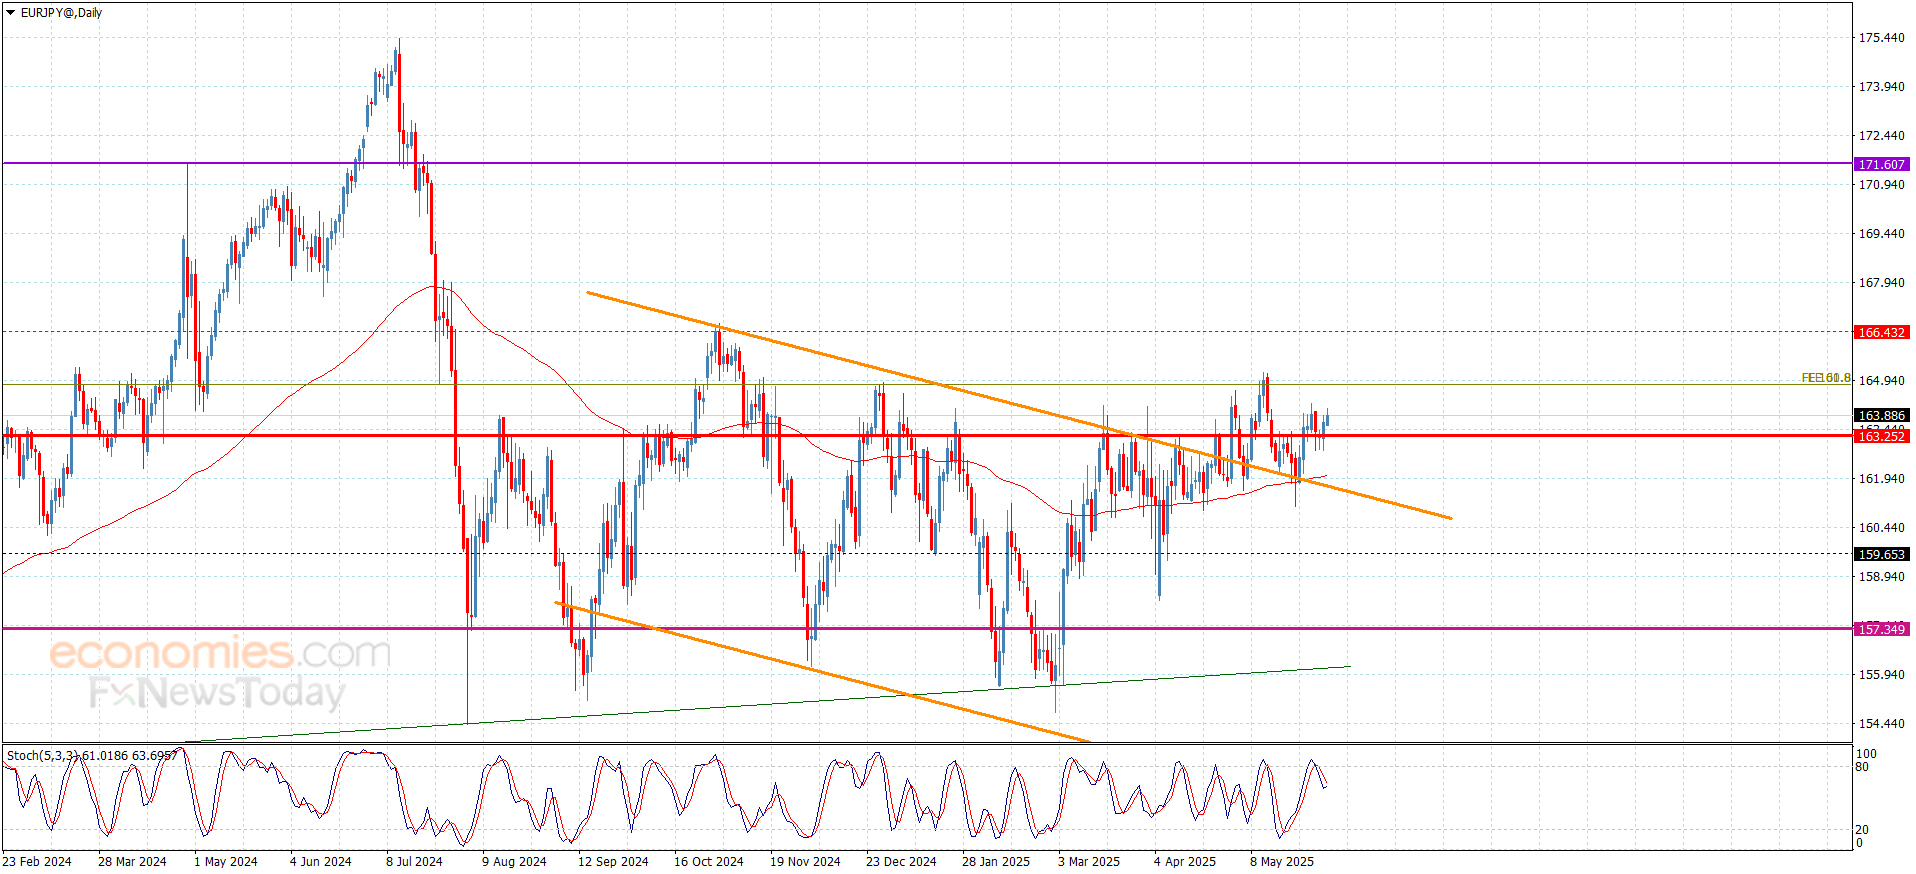
The EURJPY pair ended yesterday’s trading positively, due to its repeated stability above 163.35 level, attacking the initial barrier near 163.85, which represents one of the keys to regain the bullish bias in the near and medium period trading.


The price needs a new positive momentum, assisting to reinforce the chances for forming more of the bullish waves, to begin targeting bullish stations by its rally towards 164.85 and 165.35, while the price return to fluctuate below 163.35 will force it to activate the bearish correctional track before reaching any on the suggested positive stations.


The expected trading range for today is between 163.50 and 164.85


Trend forecast: Bullish


Source link

4 06, 2025

U.S. Vitamin and Dietary Supplements Market Share & Trends Analysis, 2032

By |2025-06-04T09:41:10+03:00June 4, 2025|Dietary Supplements News, News|0 Comments


U.S. Vitamin and Dietary Supplements Market Growth Potential


Market Statistics


Study Period 2019 – 2032
2024 Market Size USD 70.0 billion
2025 Market Size USD 75.7 billion
2032 Forecast USD 139.0 billion
Growth Rate (CAGR) 9.1%
Largest Region West
Fastest Growing Region South
Nature of the Market Fragmented


Growth Forecast


Key Players

U.S. Vitamin and Dietary Supplements Market Companies


Key Report Highlights


  • Market Size and Forecast
  • Industry Trend
  • Regulatory Landscape
  • Demand Trend Analysis
  • Companies Recent Strategical Developments
  • Key Stakeholders
  • Voice of Industry Experts/KOLs
  • Future Opportunity


Explore the market potential with our data-driven report

U.S. Vitamin and Dietary Supplements Market Analysis

The U.S. vitamin and dietary supplements market size was USD 70.0 billion in 2024, and it will grow by 9.1% during 2025-2032, to reach USD 139.0 billion by 2032. 


The market is growing because of the increased health awareness, older customers, and increasing demand for preventive medication. People are selecting supplements with multiple health benefits, such as immunological support, weight control, mental wellness, and sports performance enhancement.


The use of plant ingredients, probiotics, and functional foods further drives the market. The growing demand for personal nutrition, including supplements designed to meet specific health requirements, such as immune support and weight management, is also leading to the market growth.


The main driver of this market is e-commerce, which gives consumers an easy way to access to a large range of supplements; the trend boomed during the COVID-19 pandemic. Marketing influencers on social media platforms, including Instagram and TikTok, affect purchasing choices, particularly among the younger and health-conscious consumers, making these dietary supplements more attractive.


The Dietary Supplement Health and Education Act (DSHEA) of 1994 controls the labeling and advertising of products, and the Food and Drug Administration (FDA) checks that supplements offered in the market are safe. This provides consumer confidence and enables further market expansion.


U.S. Vitamin and Dietary Supplements Market Segmentation Analysis

Ingredients Analysis


The vitamins category held the largest market share of 75% in 2024 because of their ability to support health and wellbeing, including bone health, energy levels, and immune functions. Vitamins D, C, and B are widely consumed at all ages and segments.


The probiotics category will have the higher CAGR because of the growing awareness about the relationship between gut health and overall body health, including ingestion, digestion, and mental well-being. As consumers have more awareness about health, they prefer conscious and natural multivitamins and herbal blends.


The ingredients analyzed in this report are:


  • Vitamins (Largest Category)

    • Vitamin A
    • Vitamin B Complex
    • Vitamin C
    • Vitamin D
    • Vitamin E
    • Vitamin K

  • Minerals

    • Calcium
    • Iron
    • Magnesium
    • Zinc
    • Potassium

  • Amino Acids & Protein

    • Branched-Chain Amino Acids
    • Whey Protein
    • Collagen

  • Herbs & Botanicals

    • Ginseng
    • Echinacea
    • Turmeric
    • Aloe vera

  • Omega-3 Fatty Acids
  • Probiotics (Fastest-Growing Category)
  • Others


Product Analysis


The tablets category held the largest market share of 70% in 2024 because of its long shelf-life, accurate dosage of active ingredients, convenience, and stable form for protection of the ingredients. These can be easily stored, transported, and are available at different price points, which attracts a broad range of consumers.


The liquids category will have the higher CAGR because of the versatility and faster absorption into the bloodstream. It can be used easily for the ease of ingestion among individuals who find it difficult to swallow tablets, such as children.


The products analyzed in this report are:


  • Tablets (Largest Category)
  • Capsules
  • Soft Gels
  • Gummies
  • Powders
  • Liquids (Fastest-Growing Category) 
  • Others


Application Analysis


The immunity category held the largest market share of 80% in 2024 because of the growing focus on health after the COVID-19 pandemic. Growing awareness and an ongoing health concern among the population for maintaining a strong immune system contribute to its dominance in the market.


The energy & weight management category will have the higher CAGR due to the rising incidence of obesity and increasing awareness for fitness, weight loss, and active lifestyles. Consumers are increasingly seeking protein bars, fat burners, fiber supplements, and meal replacement shakes for weight management and energy drinks and green tea extract for energy boosting. Over 30% of the country’s population is overweight and over 40% obese.


The applications analyzed in this report are:


  • Immunity (Largest Category)
  • Energy & Weight Management (Fastest-Growing Category) 
  • Diabetes Management
  • Bone & Joint Health
  • Gastrointestinal Health
  • Brain and Mental Health
  • Insomnia
  • Anti-aging
  • Others


End User Analysis


The adults category held the largest market share, of 60% in 2024, since adult male and female consumers are both aiming for preventive healthcare and wellness. This assists the overall wellbeing, enhances energy, and delivers to the particular health issues, such as weight management, immunity, and skin health. The need for enhanced self-care and healthy aging awareness have resulted in greater demand for these supplements.


The geriatric category will have the highest CAGR because of the increasing aging population. Elder people demand dietary supplements in order to solve their problems, such as joint pain. Many supplements, such as calcium and vitamin D, are used to enhance the quality of life among them.


The end users analyzed in this report are: 


  • Adults (Largest Category)
  • Geriatric Population (Fastest-Growing Category)
  • Pregnant Women
  • Children
  • Infants


Distribution Channel Analysis


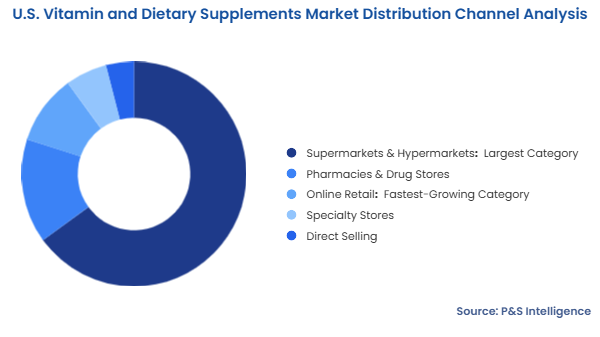
The supermarkets and hypermarkets category held the largest market share, of 65% in 2024, due to their broad availability, competitive pricing, extensive product selection, and convenience for one-stop shopping in dietary supplements.


The online retail category will have the highest CAGR due to its convenience of shopping from home, comparing prices from different apps, and accessing a wide range of products. The availability of subscription services and the product information provided by these online services. According to the survey conducted by 1WorlsSync in 2024, 73% of the U.S. consumers are reported to use their online shopping sites for these dietary supplements.


U.S. Vitamin and Dietary Supplements Market Segmentation Analysis


The distribution channels analyzed in this report are: 


  • Supermarkets & Hypermarkets (Largest Category) 
  • Pharmacies & Drug Stores
  • Online Retail (Fastest-Growing Category) 
  • Specialty Stores
  • Direct Selling

Drive strategic growth with comprehensive market analysis

U.S. Vitamin and Dietary Supplements Market Geographical Analysis

The West region held the largest market share, of 40%, in 2024 because of its health and wellness culture. A higher percentage of customers focus on plant-based and natural supplement. Customers from Oregon, California, and Washington pick supplements produced from ginseng, turmeric, and acai berry, which have more health advantages.


The South will have the highest CAGR due to the shift toward preventive care and benefits from higher consumer awareness of dietary supplements. People in Georgia, Florida, and North Carolina are increasingly taking supplements to support their health goals. Additionally, some nutrition products that are used in sports, such as energy bars, protein powders, have gained popularity in this region.


The geographical breakdown of the market is as follows: 


  • Northeast
  • Midwest
  • South (Fastest-Growing Category) 
  • West (Largest Category) 

U.S. Vitamin and Dietary Supplements Market Share Analysis

The market is highly fragmented as a huge number of companies produce these supplements. Although there are a few major brands, a host of small, local brands exist too. The rising popularity of herbal supplements has encouraged the entry of local players who sell products with unverified claims. E-commerce has made it easier for them to access the market. A huge number of companies from China and other developing countries offer herbal and natural supplements.

U.S. Vitamin and Dietary Supplements Companies:

  • Amway
  • Abbott
  • Herbalife Nutrition
  • Nature’s Sunshine Products Inc.
  • NOW Foods
  • Archer Daniels Midland
  • NU SKIN
  • DuPont de Nemours Inc.
  • Pfizer Inc.
  • Eli Lilly and Company
  • GNC Holdings, Inc.
  • Lifeway Foods, Inc.


Source link

4 06, 2025

Everything You Need to Know Trump in Crypto

By |2025-06-04T07:56:07+03:00June 4, 2025|News, NFT News|0 Comments


Donald Trump, the former U.S. President, has sparked considerable attention in the Web3 community with his deepening involvement in the cryptocurrency market. 

In recent years, “Trump crypto” has evolved from a trending search term into a broader phenomenon – reshaping how the public perceives the intersection between politics and blockchain technology.

The Trump crypto narrative can be divided into two key areas: tokens and NFTs. This article provides a comprehensive look into both, exploring everything from NFT launches and policy stances to notable statistics and the potential long-term impact should Trump return to the presidency.

The Launch of TRUMP Coin: Donald Trump’s Foray into Solana and Political Branding

On January 17, 2025 – just three days before his second presidential inauguration, Donald Trump officially launched his namesake cryptocurrency token, TRUMP coin, on the Solana blockchain. The announcement was confirmed via his verified social media accounts, including Truth Social and X.

Presented as a cultural symbol rather than an investment vehicle or campaign fundraising tool, the TRUMP coin token quickly garnered widespread attention. Within hours of its debut, trading volume surged into the millions of dollars, driven largely by FOMO across the crypto community.

Key details of the TRUMP token include:

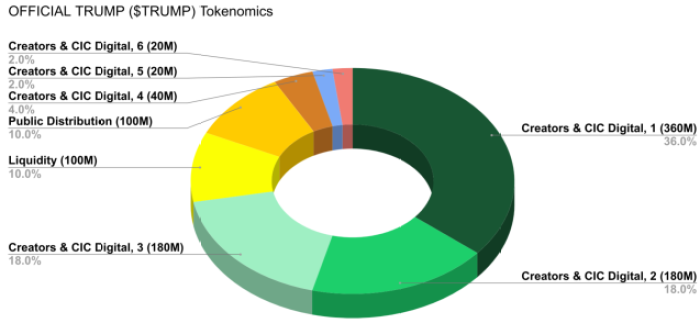
  • Blockchain: Solana
  • Total supply: 1 billion tokens
  • Token distribution: 20% went to the public, while 80% is held by Trump-linked firms CIC Digital and Fight Fight Fight.
  • Fully diluted valuation: Estimated to have reached as high as $27 billion during its initial trading days
Everything You Need to Know Trump in Crypto

Despite the excitement, the token has faced its share of criticism. Crypto analysts and community members have raised concerns about its utility, arguing that $TRUMP lacks intrinsic value beyond branding. 

Holding 80% of the supply in Trump-linked firms raised concerns about manipulation and centralization.

Trump hinted at a Mar-a-Lago event for $TRUMP holders, open only to wallets meeting a token threshold.

Some critics argue the project strays from Web3 ideals and exploits Trump’s fame for speculation.

In addition to TRUMP, several unofficial “meme tokens” such as $MAGA and $DJT have also circulated in the market. These tokens, however, have not received any official endorsement from Trump or his team. 

$DJT briefly stirred controversy after being wrongly linked to Trump, but no evidence confirmed the connection.

The Launch of $TRUMP Token: Donald Trump’s Foray into Solana and Political BrandingThe Launch of $TRUMP Token: Donald Trump’s Foray into Solana and Political Branding

Source: DexScreener

The $TRUMP launch marks a shift in Trump’s Web3 strategy, blending politics with digital assets.

Trump’s token launch shows how public figures use crypto to build and profit from their brand.

Trump in Crypto Space

Donald Trump’s first NFT collection, titled Trump Digital Trading Cards, debuted on December 15, 2022, via the Polygon blockchain. Each NFT was priced at $99 and depicted the former president in various dramatic personas, including superhero, cowboy, and astronaut. 

Despite widespread mockery and skepticism, the collection sold out within 12 hours, generating approximately $4.4 million in initial revenue.

Read more: Trump NFT Collections: The Highs, Lows, and Controversies

Trump in Crypto SpaceTrump in Crypto Space

According to data from Dune and other aggregators as of May 2025:

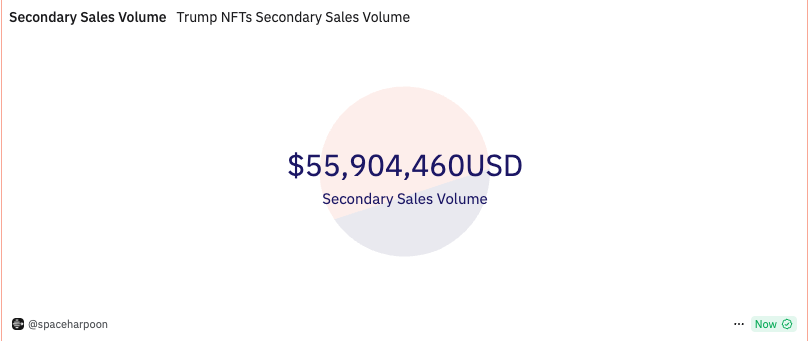
  • The total secondary market trading volume for Trump NFTs has surpassed $10 million.
  • The first collection comprised 45,000 NFTs, distributed among more than 14,000 unique owners.
  • At launch, Polygon saw a temporary surge in trading volume, increasing by nearly 200%, driven largely by the Trump NFT frenzy.
Trump in Crypto SpaceTrump in Crypto Space

Source: Dune

In 2023, Trump released a second collection – Trump Digital Cards Series 2, with 47,000 NFTs, maintaining the $99 price point. Later that year, in December, he unveiled a special “Mugshot Edition” featuring 100,000 NFTs inspired by his widely circulated booking photo taken at Fulton County Jail following his criminal indictment. 

This edition also sold out in under 24 hours. Notably, buyers who purchased 47 or more NFTs were rewarded with a physical trading card embedded with fabric from the suit Trump wore in the mugshot, along with an exclusive invitation to a gala at Mar-a-Lago.

For Trump, NFTs have proven to be more than just collectibles or memes. A portion of the proceeds from each NFT drop has reportedly been used to fund his presidential campaign, illustrating how NFTs can serve as a creative, legitimate fundraising tool in the Web3 era. 

His ability to monetize digital assets in support of political goals has set a precedent for how blockchain-based fundraising might evolve in future election cycles.

Trump’s Crypto Policy and Market Impact

In a stark reversal from his earlier stance – where he once referred to Bitcoin as a “scam” – Donald Trump has, by 2024–2025, embraced cryptocurrency as a core pillar of national financial sovereignty. Framing Bitcoin as a “hedge against authoritarian government,” Trump has made several public commitments that signal a pro-crypto shift in policy:

  • Opposing the launch of a central bank digital currency (CBDC) by the Federal Reserve
  • Restricting the regulatory authority of the SEC over the crypto market
  • Supporting Bitcoin mining operations within U.S. borders

The Web3 community — especially miners — has responded warmly to these declarations. Following Trump’s speech in Texas in May 2025, the share prices of major Bitcoin mining firms – including Riot Platforms, CleanSpark, and Marathon Digital, surged between 10–25%.

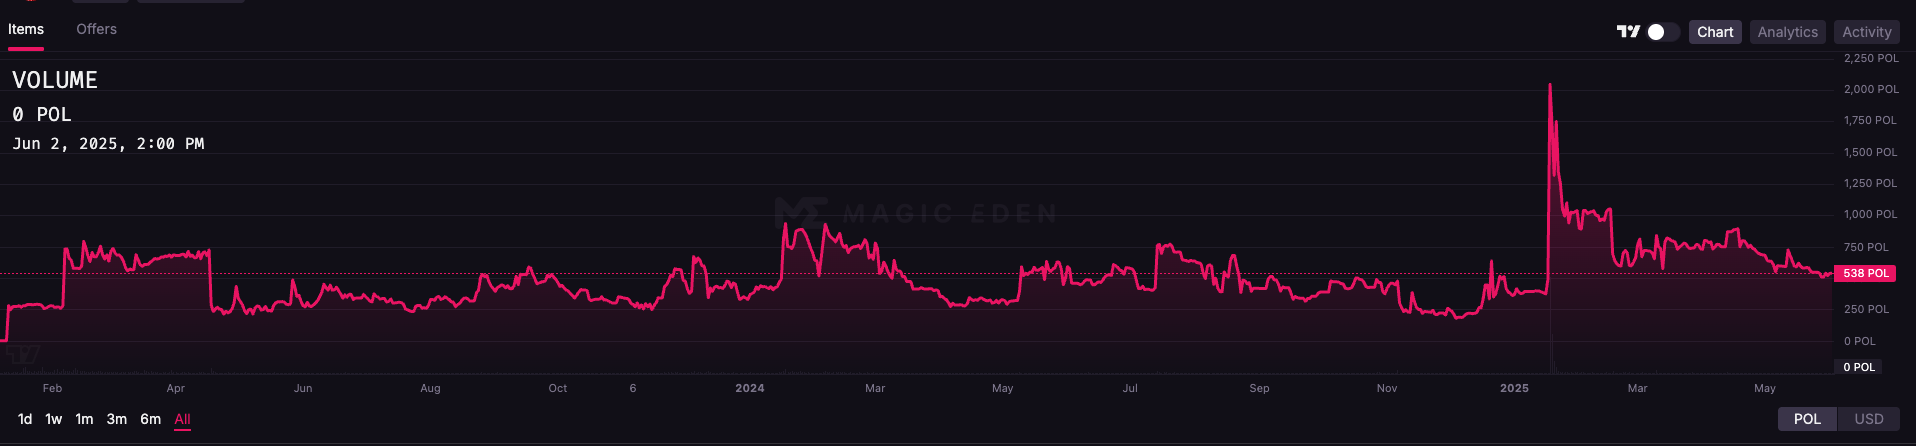
Trump Digital Trading Cards: NFT Price Movements

  • December 2022: The initial Trump Digital Trading Cards launched at $99 each and sold out within 12 hours, generating approximately $4.4 million in primary sales.
  • July 2024: Following a news cycle involving Trump, the floor price of Series 1 NFTs jumped from roughly $228 to over $500, while Series 2 saw a ~20% increase.
  • January 2025: Just before Trump’s second inauguration, Series 1 floor prices spiked from 0.059 ETH to 0.27 ETH in a single day, with daily trading volume reaching 746 ETH.
  • Cumulative volume: As of early 2025, total trading volume across all Trump NFT collections exceeded 19,736 ETH (over $65 million USD).
Trump Digital Trading Cards: NFT Price MovementsTrump Digital Trading Cards: NFT Price Movements

Source: MagicEden

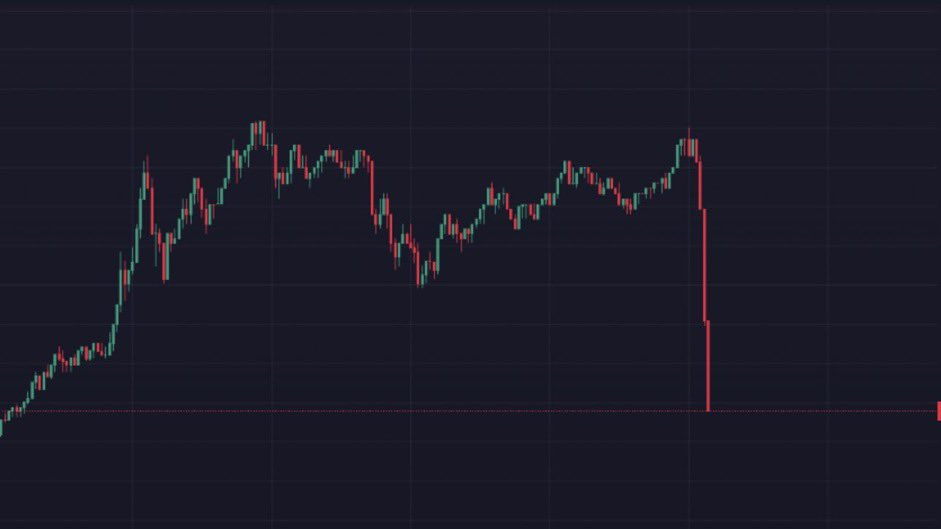
Price Volatility of the TRUMP Coin

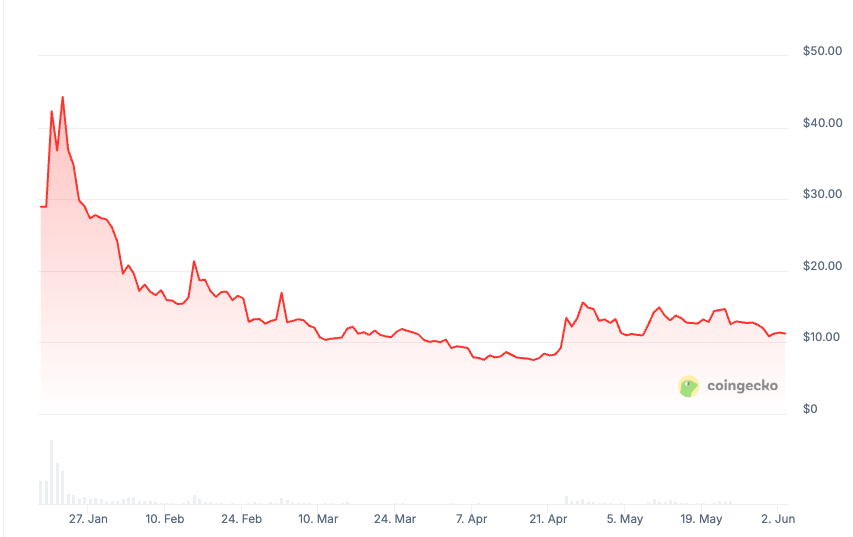
  • November 2024: Following Trump’s presidential election victory, TRUMP pumped over 300% within 24 hours, then dropped nearly 45% in the following two days as early holders took profits.
  • January 2025: TRUMP reached its all-time high of nearly $75 on January 19, just days before the inauguration.
  • April 2025: The announcement of an exclusive Mar-a-Lago dinner for the top 220 holders triggered a 58% rally, pushing the price to $14.32.
  • May 2025: After the campaign concluded, TRUMP retraced to around $11.04, marking a nearly 15% drop from its recent local high.
  • Market cap: As of June 2025, TRUMP has a market capitalization of approximately $2.2 billion, placing it among the top five memecoins on CoinMarketCap.

These figures highlight how both the Trump NFT collections and the TRUMP coin remain highly sensitive to political developments and media cycles tied to Trump’s personal brand. Whether through digital collectibles or memecoins, Donald Trump’s presence continues to move markets, blurring the lines between politics, culture, and decentralized finance.

Price Volatility of the $TRUMP TokenPrice Volatility of the $TRUMP Token

Source: CoinGecko

Trump’s Long-Term Vision: Crypto as a Pillar of Financial Freedom and Political Power

Donald Trump’s engagement with cryptocurrency goes beyond mere marketing or monetization. In public remarks and policy statements since late 2024, Trump has increasingly framed digital assets as tools for preserving financial sovereignty in the face of what he calls “globalist overreach” and “centralized tyranny.” 

By aligning himself with the crypto movement, Trump positions blockchain technology as a means for American citizens to reclaim control over their money and identity.

regulatory environment that encourages blockchain innovation within U.S. borders. His campaign has signaled that under a second Trump administration, America would become a safe haven for digital asset entrepreneurs and developers.

Ultimately, Trump’s adoption of crypto aligns closely with his broader political identity: anti-establishment, nationalist, and disruptive. In this context, the TRUMP coin is not just a meme asset – it’s a symbol of how political influence and blockchain technology may increasingly intertwine in the years ahead.

Conclusion

While not a pioneer of the crypto movement, Donald Trump is effectively leveraging the Web3 ecosystem to build political, financial, and cultural influence. 

From multi-million-dollar NFT collections to vocal policy commitments supporting digital property rights, Trump has made cryptocurrency a strategic pillar of his 2025 presidential campaign.

“Trump crypto” is no longer a passing trend – it may well become a defining case study in the convergence of blockchain technology and political power. Should Trump return to the White House, he would be in a position to enact pro-crypto policies that could reshape the regulatory landscape in the United States and catalyze a new era for the global digital asset economy.


Source link

4 06, 2025

XAU/USD battles key resistance ahead of high-impact US data

By |2025-06-04T07:53:14+03:00June 4, 2025|Forex News, News|0 Comments


  • Gold price bounces back toward $3,400 early Wednesday, awaits US jobs data.
  • The US Dollar loses JOLTS survey-led traction as trade jitters remain a drag.  
  • Gold price retests key resistance zone near $3,377 on the daily chart amid bullish RSI.

Gold price is staging a tepid turnaround above $3,350 in Asian trading on Wednesday. Gold buyers keenly await the high-impact US data releases and speeches from Federal Reserve (Fed) policymakers for a sustained move higher.

Gold price looks to US data for further gains

Having retreated from the monthly high of $3,392 on Tuesday, Gold price is recovering some ground amid a renewed selling wave around the US Dollar (USD) as trade concerns return to the fore.

The Trump administration’s deadline for its trading partners to submit their best offers on trade looms this Wednesday while a doubling of levies to 50% on imported steel and aluminium will take effect at 4 GMT.

Additionally, markets remain wary of the likely talks between US President Donald Trump and his Chinese counterpart Xi Jinping on Friday, especially after US Federal Bureau of Investigation (FBI) Director Kash Patel confirmed via a post on X the arrest of two Chinese nationals charged for smuggling potential bioterror fungus into the US.

Last week, both sides accused each other of violating the terms of an agreement in May to lower some tariffs.

The USD-denominated bright metal could receive a brief boost as the Greenback sees a fresh leg down on US steel and aluminium tariffs coming into effect. 

Attention will then turn toward the top-tier US ADP Employment Change and ISM Services PMI data due later in the American session for fresh signs on the health of the US economy. This could provide hints on the Fed’s next policy move and direction on the USD.

On Tuesday, the US Dollar found some respite from stronger-than-expected JOLTS Job Openings, which are closely watched by the Fed.

The number of job openings on the last business day of April stood at 7.39 million, following 7.2 million openings recorded in March. The market expectation was for 7.1 million.

Gold price technical analysis: Daily chart

The short-term technical outlook remains constructive so long as the confluence of the 21-day Simple Moving Average (SMA) and the 38.2% Fibonacci Retracement (Fibo) level of the April record rally at $3,297 is held.

The 14-day Relative Strength Index (RSI) is pointing north while comfortably above the midline, justifying the renewed upside.

Gold buyers must scale the 23.6% Fibo resistance at $3,377 on a daily candlestick closing basis to resume the recent upswing toward the lifetime highs of $3,500.

Ahead of that, the May high of $3,439 must be taken out.

Gold price stormed through the falling trendline resistance, then at $3,346, to finish Monday at $3,382.

Alternatively, sellers could attempt control on a break below the falling trendline resistance-turned-support, now at $3,325.

The next support is seen at the abovementioned powerful confluence of $3,297.

The last line of defense for buyers is aligned near $3,240, where the 50% Fibo level and the 50-day SMA hang around.

Economic Indicator

ADP Employment Change

The ADP Employment Change is a gauge of employment in the private sector released by the largest payroll processor in the US, Automatic Data Processing Inc. It measures the change in the number of people privately employed in the US. Generally speaking, a rise in the indicator has positive implications for consumer spending and is stimulative of economic growth. So a high reading is traditionally seen as bullish for the US Dollar (USD), while a low reading is seen as bearish.


Read more.

Next release:
Wed Jun 04, 2025 12:15

Frequency:
Monthly

Consensus:
115K

Previous:
62K

Source:

ADP Research Institute


Source link

4 06, 2025

Solana Price Prediction: Rising USDC Mints and Institutional Moves Fuel Optimism for $200 Target

By |2025-06-04T07:38:14+03:00June 4, 2025|Crypto News, News|0 Comments

Solana gains strength, reclaiming $160 amid rising USDC mints and growing institutional support, signaling a potential move toward $200.

Solana has reclaimed momentum as price currently sits slightly shy of the $160 mark, posting a healthy 2.39% gain over the last 24 hours. While not a major spike, this reclaim signals strength returning after recent consolidation. Price reclaiming key psychological levels like this can often act as a continuation trigger. With SOL now close to holding firmly above $160, the next test will be whether it can build a base here and push toward previous highs.

Solana’s current price is $159.16, up 2.39% in the last 24 hours. Source: Brave New Coin

$1.75B Minted on Solana

Following Solana’s reclaim of the $160 level, a deeper look reveals $1.75 billion in USDC was minted on the Solana network throughout May. This was not a one-time event. Instead, it came through eight separate $250 million mints by Circle, as tracked by SolanaFloor’s on-chain data.

Solana Price Prediction: Rising USDC Mints and Institutional Moves Fuel Optimism for 0 Target

Solana’s network sees $1.75 billion in USDC minted during May, reflecting growing institutional trust and deeper liquidity. Source: SolanaFloor via X

This kind of sustained and structured capital injection points to rising institutional trust and expanding network utility. It also hints at growing liquidity depth, something Solana has been working toward steadily. If this pace continues, it could pave the way for stronger on-chain flows and reinforce SOL’s momentum beyond just price action.

SOL Technicals Signal Room to Run

With Solana reclaiming $160 and deeper liquidity signals showing up, the technicals now add fuel to the fire. According to analysis shared by CryptosRus via Cryptolingrid, SOL is currently testing the $160 mark as support within an ascending broadening pattern, while the price is tightening inside a growing range, and that compression could lead it higher.

 CryptosRus

Solana (SOL) tests $160 support within an ascending broadening pattern, signaling potential upside toward the $190-$200 range. Source: CryptosRus via Cryptolingrid on X

Crypto analyst Cryptolingrid believes should this setup play out cleanly, the next zone to watch lies between $190 and $200. These levels align with previous resistance levels and the upper bounds of this broadening structure. For now, SOL just needs to hold its footing above $160.

Solana Price Prediction Targets $200 as Channel Support Holds

After reclaiming the $160 level and confirming it as support, Solana is now showing signs of strength along its rising channel. A new chart from Satoshi Flipper highlights a clean bounce off the channel’s lower boundary, a structure that has guided SOL’s uptrend since April. The reaction here adds weight to the idea that Solana isn’t just holding, it’s offering a positive reaction.

 Satoshi Flipper

Solana confirms support at $160 with a bounce off its rising channel, setting sights on the $200 target zone. Source: Satoshi Flipper via X

If this channel pattern continues to play out, the Solana price prediction starts leaning toward the $200 zone. This upper trendline has served as resistance before, and with SOL stabilizing above $160 and on-chain activity rising, the technical setup is lining up.

Galaxy Digital’s Bitcoin Shift Adds Weight to Solana’s Momentum

In a recent post from SolanaFloor, fresh on-chain data shows a surprising development. Galaxy Digital has moved 464 cbBTC worth around $48.6 million from Coinbase to the Solana network.

SolanaFloor

Galaxy Digital moves $48.6M in cbBTC from Coinbase to Solana network. Source: SolanaFloor via X

That’s not just a routine transfer; it’s a bold move that hints at growing trust in Solana’s infrastructure for real asset flow. The timing couldn’t be better. With USDC mints ramping, technicals turning bullish, and now major firms like Galaxy shifting capital on-chain, the fundamentals are starting to line up with price action.

Final Thoughts

Solana is starting to show signs of strength again, not just on the chart, but fundamentally as well. From reclaiming $160 to handling over $1.7B in USDC mints, the ecosystem feels like it’s getting tighter, more active, and increasingly backed by real capital.

Price action is still unfolding, but the setup looks promising. With strong support holding, a healthy technical structure in place, if that continues, the path toward $190 to $200 doesn’t look so far off.

Source link

4 06, 2025

Natural Gas Price Forecast: Support Holds as Gas Targets Key Upside Resistance

By |2025-06-04T05:51:09+03:00June 4, 2025|Forex News, News|0 Comments


Above $3.84 Leads Higher

The next key upside pivot level is the prior lower swing high at $3.84 (B). A decisive rally above that higher level will trigger the continuation of a rising ABCD pattern with an initial upside target around $4.08. That price level can be considered as the beginning of a price range up the 61.8% Fibonacci retracement at $4.12.

Recent Signs of Strength

Given recent signs of strength, it looks like there is a good chance the breakout may trigger. Notice that the prior three days found support around the 20-Day MA (purple). A breakout above the 50-Day MA was confirmed yesterday with a daily close above the line. Once reclaimed both the 20-Day and 50-Day lines are potential support and will likely be used by traders as an area to enter or add in anticipation of rising prices.

In addition, support last week was also confirmed by a 50% retracement level and an AVWAP (light blue) support level anchored from the April swing low. Notice that previously, the AVWAP line represented an area of resistance from May 15 to May 27. Again, once a prior resistance line is successfully tested as support the stage is set for the trend to move higher.

20-Day May About to Rise Above 50-Day Line

The 20-Day and 50-Day lines have been converging, with the faster 20-Day line targeting a rise above the 50-Day soon. That would provide another bullish sign in support of a strengthening trend. If the parameters of the rising trend channel are retained, there is the potential for resistance to be seen near the top line of the channel. The timing could coincide with the approach to the $4.08 target zone. There are three hits of the top channel line thereby confirming the line. If a third hit leads to a bearish reversal the bottom of the channel becomes a potential target.

For a look at all of today’s economic events, check out our economic calendar.


Source link

4 06, 2025

Bitcoin (BTC) Price Prediction for June 3 — TradingView News

By |2025-06-04T05:36:58+03:00June 4, 2025|Crypto News, News|0 Comments

The rates of all of the top 10 coins are going up today, according to CoinStats.CoinStats”>

BTCUSD

The price of Bitcoin BTCUSD has increased by 2% over the last 24 hours.TradingView”>

On the hourly chart, the rate of BTC has set a local resistance of $106,692. As most of the daily ATR has been passed, there are low chances of seeing sharp moves by the end of the day. 

However, if the bar closes around current prices, there is a possibility of seeing a test of the $108,000 tomorrow.TradingView”>

On the bigger time frame, the price of the main crypto is rising after a false breakout of the support of $103,621. If the growth continues, traders may witness a further upward move to the $108,000-$110,000 range.TradingView”>

From the midterm point of view, the rate of BTC is on the way to the resistance of $109,588. If the weekly bar closes around that mark or above, one can expect a new all-time high shortly.

Bitcoin is trading at $106,570 at press time.

Source link

4 06, 2025

Mainnet Migration, Cyberlancers Update, and Steam Launch in June 2025

By |2025-06-04T03:54:11+03:00June 4, 2025|News, NFT News|0 Comments


Here is a comprehensive digest of news and updates regarding the Web3 crypto game “Off the Grid” for the period from May 29 to June 3, 2025, based on available information from various sources, including posts found on X and web articles.

1. **Mainnet Migration Progress**: Leading up to June 3, 2025, there were updates regarding the mainnet migration of “Off the Grid” from its testnet phase. Posts on X indicated that this transition includes players receiving new wallet addresses, transferring in-game items to the mainnet, and maintaining the marketplace as a distinct feature. This migration is described as a significant update, preparing the game for broader accessibility and functionality enhancements.
– Source: https://t.co/UXVBqsEFV0

2. **Introduction of Cyberlancers**: Around May 30, 2025, news emerged about the introduction of “Cyberlancers” within “Off the Grid.” While specifics on Cyberlancers are limited in the available data, this appears to be a new feature, character class, or gameplay element being rolled out, generating interest among the community as part of ongoing game development and content updates.
– Source: https://t.co/Qo2fJq9Ows

3. **Steam Launch Confirmation for June 2025**: Recent posts on X, dated June 2 and June 3, 2025, reaffirmed that “Off the Grid” is set to launch on Steam in June 2025, marking it as the first Web3 blockchain-integrated game on the platform since Valve’s crypto ban in 2021. The launch will include full cross-play support across PC, Xbox Series X/S, and PS5, highlighting the game’s aim to reach a wide audience on multiple platforms. This aligns with earlier web reports from May 21, 2025, confirming the planned release.
– Source 1: https://t.co/Dp3zRcbZDt
– Source 2: https://t.co/jmbICI6Cvb


Source link

4 06, 2025

Bird & Blend’s Matcha Latte Magic Whisk: The ultimate Gen Z kitchen accessory

By |2025-06-04T03:37:29+03:00June 4, 2025|Dietary Supplements News, News|0 Comments


Where even the faintest aroma of a pumpkin spice latte signals the presence of a Millennial, so too do matcha lattes of varying brightly hued flavour profiles serve as a symbol of Gen Z.

Whether you’re strolling down the streets of trendy Shoreditch or marvelling at shop windows in Marylebone, one thing’s for sure: you’ll come across more than one chic spot offering a variety of matcha-flavoured goods.

Gone are the days of cringeworthy “coffee diversion here” road signs; nowadays, all it takes is a flash of green and an arrow pointing in the direction of a café with distinct mid-century aesthetics, and those samba-clad feet pivot so fast you might just see smoke. So much so that a global shortage of matcha appears to be brewing, as Japanese farmers fight to meet the skyrocketing demand.

Artisinally crafted from finely ground tea leaves, both ceremonial-grade matcha powder (made from shade-grown tea leaves with a subtle creamy, sweet flavour) and culinary-grade matcha powder (made from the lower parts of the tea plant and more astringent in flavour) are at risk of commercial shortage. This is a big problem for cafés that have garnered a cult following thanks to various blueberry/lavender/vanilla/strawberry/mango-infused matcha drinks.

I am therefore choosing to take this recent news as a sign to stop being lazy and start making matcha at home. When it comes to iced lattes, the process is a breeze, and there’s really no excuse not to indulge in the refreshing caffeine boost from the comfort of my own kitchen. Sure, I won’t necessarily achieve the same lightly frothed finish as a professionally made latte, but it does the job.

It’s when I’m craving a piping hot matcha latte, however, that I run into a roadblock. I’d rather pop to a café and pay a small premium than endure watching as my oat milk slowly heats up in a saucepan, praying that it won’t burn due to my lack of electric frother. This is where Bird & Blend’s latest innovation, the Matcha Latte Magic Whisk (RRP £99), is set to be my personal saviour. Designed by the UK-based tea experts and engineered by award-winning British appliance manufacturer, Dualit, it’s a match(a) made in heaven.

Keep scrolling for my full review.

  • Capacity: 250ml
  • Included in box: lid, power base, whisk, basket
  • Additional features: ergonomic handle, lacquered bamboo-coloured finish (stainless steel option available too)

Design and user-friendliness

Realised much like a simple, miniature kettle, the Magic Whisk is nevertheless slightly larger than a standard Nespresso frother. Size-wise, it sits somewhere between a handheld bullet blender and a Velvetiser. I adore when a kitchen appliance is void of a ridiculous excess of bells and whistles, and the only button on this device is the ‘on’ switch. The timer is automatic, and the whisk and basket mechanism adheres magnetically to the base, which is incredibly satisfying and surprisingly sturdy.

If you’re a fan of crazy matcha flavours and pairings, you’ll want to invest in some of Bird & Blend’s flavoured range, which includes bonkers blends like Honey Bunny, Mint Choc Chip, Ice Cream, Banana and Salted Caramel. I personally don’t have much of a sweet tooth and prefer my matcha lattes plain and ceremonial-grade.

Thanks to the device’s built-in timer, all I had to do was fill the vessel with my milk of choice (oat, in case you were wondering) to the max line, press start and then scatter in a teaspoon of my favourite matcha powder before popping on the lid. In just two minutes, with no ridiculous queue and overworked barista in sight, I had a perfectly frothed, bright green and piping hot delight.

Ultra-smooth microfoam aside, I was particularly impressed by the device’s silent operation. Perfect for those who get in trouble with flatmates and partners for loudly grinding coffee beans early in the morning. Opting for matcha instead will not only prevent a caffeine crash later down the line, but it’ll keep the peace in your household.

When it comes to the craft of matcha, however, the brilliant but lazy device does encourage one to bypass the traditional green tea ceremony – which is not only wonderfully meditative, but an incredibly important part of Japanese culture. The appliance has, however, prevented me from whisking splashes of fluorescent tea onto my clothes at the office.


Source link

Go to Top