About Editorial team of BIPNs

Main team of content of bipns.com. Any type of content should be approved by us.
29 05, 2025

Facts About Eye Exams – HealthyWomen

By |2025-05-29T01:30:50+03:00May 29, 2025|Fitness News, News|0 Comments

May is Healthy Vision Month.

My partner, Tom, often brags about his great eyesight. And I’ve always just assumed he has perfect vision because he’s dating me.

But I had to give him major side-eye when he told me it’s been decades since his last eye exam.

To be clear, everyone should get an eye exam at age 40 — regardless of how good you think your vision is. This is because your eyes change as you age, and the earlier you catch signs of disease — the better. But eye exams are especially important for women and people assigned female at birth (AFAB) considering women are at higher risk for eye diseases than men.

Read: Women’s Eye Health 101 >>

What does an eye exam include?

The standard eye exam evaluates vision and overall eye health through a series of different tests.

First, your healthcare provider (HCP) will go over your medical history with you. This can include medications you’re taking, family history of health conditions and whether you wear corrective lenses.

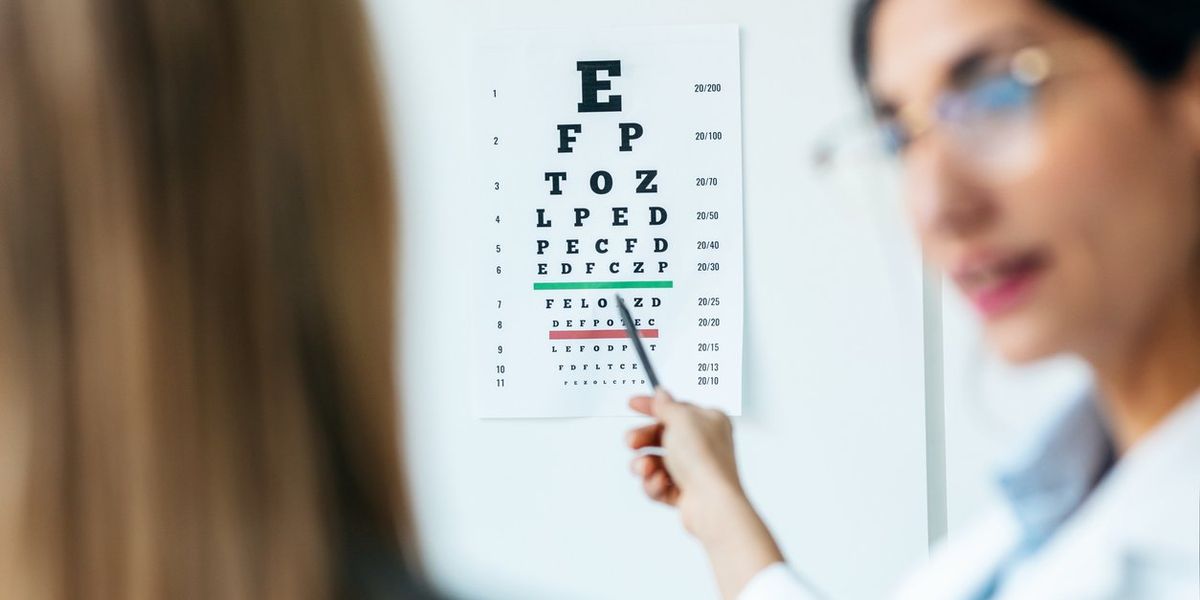
To test how well you can see, most HCPs use a version of the iconic Snellen vision test. The chart has big letters at the top that get increasingly smaller toward the bottom. The test measures visual acuity, or how sharp your vision is from 20 feet away. This is where the term “20/20 vision” comes from. The top number refers to the distance — 20 feet — and the bottom number is the last line you can read correctly.

If you wear contacts or glasses, your HCP will have you look through a device called a refractor or a phoropter, which has different lenses to help determine your prescription.

An eye exam also checks:

  • Eye movement
  • Eye pressure
  • The front part of your eye (cornea, eyelids, iris and lens)
  • Pupils
  • Side vision

To check for signs of damage in your retina and optic nerve, the HCP will put drops in your eye that widen (dilate) the pupil. Note: The dilation can make you sensitive to sunlight, so bring your sunglasses and someone to drive you home.

Who should get an eye exam and how often?

If you have overall healthy eyes, the frequency of eye exams depends on your age.

If you’re 20 to 39 years old:

  • Get a complete eye exam every five to 10 years
  • Get yearly exams if you wear corrective lenses

If you’re 40:

  • Get an eye exam even if you have had no previous problems

After age 40, get an eye exam:

  • Every two to four years until age 54
  • Every one to three years for people ages 55 to 64
  • Every one to two years for people ages 65 and older

People with a family history of eye disease, health conditions like diabetes and other risk factors may need to be seen more frequently than people who don’t have known eye issues. Check in with your HCP to see if you need an exam.

Ophthalmologist vs. optometrist

Routine eye care can be provided by both ophthalmologists and optometrists. The difference between the two is the level of training.

Ophthalmologists have medical degrees (MDs) and surgical training to care for all eye conditions. People with more serious eye problems should see an ophthalmologist.

Optometrists, on the other hand, are not medical doctors but have a doctor of optometry (OD) degree and can provide routine eye and vision exams.

Eye problems found during an exam

Many serious eye conditions don’t have symptoms in the early stages. An exam can help diagnose disease and prevent vision loss and blindness.

Common eye conditions found during an exam can include:

  • Cataracts: Clouding in the lens of the eye that can cause blurry vision, trouble with night vision, sensitivity to light and double vision
  • Diabetic retinopathy: An eye condition that affects the blood vessels in the eyes of people with diabetes. It can cause floating spots, blurred vision and blindness
  • Glaucoma: A group of eye diseases that affect the nerve in the back of the eye (optic nerve) and cause loss of side vision and blindness
  • Age-related macular degeneration: An eye disease that causes blurry central vision and can lead to vision loss

Eye exams are also crucial for catching early signs of chronic health conditions, such as diabetes, multiple sclerosis and high blood pressure.

Read: Glaucoma 101 >>

Eye exam cost

The cost of an eye exam can vary depending on where you go and whether you have vision insurance. Without insurance, the price can range anywhere from $50 to $200.

Medicaid may cover routine eye exams, but plans vary by state, so check your coverage before getting an exam.

Does Medicare cover eye exams?

Original Medicare plans do not cover eye exams. Most Medicare Advantage (Part C) plans cover vision care, including yearly eye exams and coverage of glasses or contact lenses.

Keep an eye on your eye health

Getting an eye exam is the best way to spot early warning signs of disease and other problems that may cause vision loss and blindness. An exam can even help diagnose chronic conditions hidden in plain sight.

If you haven’t had an eye exam, or it’s been a long time — make an appointment.

This educational resource was created with support from Viatris, a HealthyWomen Corporate Advisory Council member.

From Your Site Articles

Related Articles Around the Web



Source link

29 05, 2025

Sees more upside above 196.50

By |2025-05-29T00:32:03+03:00May 29, 2025|Forex News, News|0 Comments

  • GBP/JPY retraces to near 194.50 as the Pound Sterling struggles to extend upside.
  • The Japanese Yen gains as likely changes in bond composition this year have prompted a rise in bond yields.
  • Traders reassess BoE dovish bets after hot UK inflation and strong Retail Sales data for April.

The GBP/JPY pair corrects to near 194.50 during European trading hours on Wednesday after refreshing an almost two-week high around 195.60 the previous day. The pair faces selling pressure as the Pound Sterling (GBP) underperforms after a strong run-up in the past few trading days.

British Pound PRICE Today

The table below shows the percentage change of British Pound (GBP) against listed major currencies today. British Pound was the weakest against the Japanese Yen.

USD EUR GBP JPY CAD AUD NZD CHF
USD 0.09% 0.02% -0.14% 0.07% -0.02% -0.37% 0.00%
EUR -0.09% -0.02% -0.16% -0.01% -0.09% -0.42% -0.06%
GBP -0.02% 0.02% -0.14% 0.06% -0.05% -0.07% -0.00%
JPY 0.14% 0.16% 0.14% 0.20% 0.11% -0.21% 0.22%
CAD -0.07% 0.01% -0.06% -0.20% -0.08% -0.40% -0.06%
AUD 0.02% 0.09% 0.05% -0.11% 0.08% -0.00% 0.05%
NZD 0.37% 0.42% 0.07% 0.21% 0.40% 0.00% 0.05%
CHF -0.01% 0.06% 0.00% -0.22% 0.06% -0.05% -0.05%

The heat map shows percentage changes of major currencies against each other. The base currency is picked from the left column, while the quote currency is picked from the top row. For example, if you pick the British Pound from the left column and move along the horizontal line to the US Dollar, the percentage change displayed in the box will represent GBP (base)/USD (quote).

However, the outlook of the Pound Sterling remains firm as traders pare bets supporting the Bank of England (BoE) to reduce interest rates again in the June policy meeting. A hotter-than-projected United Kingdom (UK) Consumer Price Index (CPI) and robust growth in Retail Sales data for April have forced traders to reassess BoE dovish bets.

The data released last week showed that the UK headline CPI accelerated at a faster pace to 3.5% year-over-year, and retail sales expanded strongly by 1.2% month-over-month.

Meanwhile, the Japanese Yen (JPY) performs strongly due to a sharp spike in Japan bond yields in expectations of significant changes in the bond program for the current fiscal year. A report from Reuters on Tuesday showed that Japan’s Ministry of Finance will consider tweaking the composition of its bond program, which could involve cuts to its issuance of super-long bonds.

GBP/JPY strengthens after a breakout of the horizontal resistance plotted from the May 19 high of 194.00 on an hourly timeframe. The 50-hour Exponential Moving Average (EMA) is expected to be a key support for the pair around 194.35.

The 14-period Relative Strength Index (RSI) falls into the 40.00-60.00 range after turning overbought above 80.00. A fresh bullish momentum would come into action when the RSI returns above 60.00.

The pair could extend its upside towards the January 7 high of 198.26 and the psychological level of 200.00 after breaking above the four-month high of 196.40.

On the flip side, a downside move by the pair below the May 6 low of 190.33 will expose it to the March 11 low of 188.80, followed by the February 7 low of 187.00.

GBP/JPY hourly chart

Japanese Yen FAQs

The Japanese Yen (JPY) is one of the world’s most traded currencies. Its value is broadly determined by the performance of the Japanese economy, but more specifically by the Bank of Japan’s policy, the differential between Japanese and US bond yields, or risk sentiment among traders, among other factors.

One of the Bank of Japan’s mandates is currency control, so its moves are key for the Yen. The BoJ has directly intervened in currency markets sometimes, generally to lower the value of the Yen, although it refrains from doing it often due to political concerns of its main trading partners. The BoJ ultra-loose monetary policy between 2013 and 2024 caused the Yen to depreciate against its main currency peers due to an increasing policy divergence between the Bank of Japan and other main central banks. More recently, the gradually unwinding of this ultra-loose policy has given some support to the Yen.

Over the last decade, the BoJ’s stance of sticking to ultra-loose monetary policy has led to a widening policy divergence with other central banks, particularly with the US Federal Reserve. This supported a widening of the differential between the 10-year US and Japanese bonds, which favored the US Dollar against the Japanese Yen. The BoJ decision in 2024 to gradually abandon the ultra-loose policy, coupled with interest-rate cuts in other major central banks, is narrowing this differential.

The Japanese Yen is often seen as a safe-haven investment. This means that in times of market stress, investors are more likely to put their money in the Japanese currency due to its supposed reliability and stability. Turbulent times are likely to strengthen the Yen’s value against other currencies seen as more risky to invest in.


Source link

29 05, 2025

Defying Photoaging and Senescence with Catechin-optimized Upcycled Tea Elixir

By |2025-05-29T00:17:08+03:00May 29, 2025|Dietary Supplements News, News|0 Comments


Discarded crop materials that are proven safe are worth considering for beauty applications. Here, a catechin-rich elixir optimized and upcycled from tea leaves is tested for antioxidant, anti-photoaging and anti-senescence benefits in vitro and ex vivo.

Fast-moving consumer goods (FMCGs) that contain natural-derived, sustainable and bio-based ingredients have emerged as some of the highest-demanded beauty products, especially in the post-COVID-2019 period. Among these, special attention has been paid to products or ingredients that abide by agricultural sustainability and circular bioeconomy themes;1 tea is presented here as such.

Tea is a universal and well-known medicinal herb that has been consumed in a variety of FMCGs for its tremendous health benefits. While the tender leaves and buds are processed into green, black and oolong teas, the mature leaves are generally not consumed – affording an opportunity for upcycling in support of a circular bioeconomy.

Tea polyphenols are important therapeutic actives for health and aesthetic benefits2 – particularly catechins. These compounds have potent antioxidant effects, DNA-protective properties, and anti-inflammatory and sebum-reducing benefits, among others.3, 4, 13, 14 

As such, a catechin-rich extract, dominated by epigallocatechin-3-gallate (EGCG), was derived via a proprietary process5 from non-consumable leaves from Assam bitter tea cultivar – Camellia sinensis var. assamica, which is less costly than C. sinensis var. sinensis – to create a phenolic-, flavonoid- and tannin-enriched skin care elixir. The effectiveness of the elixir against photoaging and senescent cells was then tested as described here.

Materials and Methods 

Elixir preparation and characterization: Leaves from Assam bitter tea cultivar, Camellia sinensis var. assamica, organically cultivated in Chiang Rai in the northeast province of Thailand, were harvested, from which the catechin-rich tea elixir was prepared using a proprietary method5 to standardize total phenolic, flavonoid and tannins content (TPC, TFC and TTC, respectively). 

Briefly, the extract was prepared by maceration in ethanolic water for a certain period, processed and the solvent was removed under vacuum. The resulting TPC, TFC and TTC were profiled and the catechins were quantified by means of standardized HPLC.6 

In vitro antioxidant activities:7 Antioxidant activity was measured by ABTS (2, 2’–azino-bis(3-ethylbenzothiazoline)-6-sulfonic acid), DPPH (1,1-diphenyl-2-picrylhydrazyl) and FRAP (ferric reducing ability of plasma) assays, in a comparison with the standards.

Anti-aging effects in cell culture models:7 The elixir was applied to co-cultured HaCaT and human dermal fibroblasts (HDF) to determine its safety and effects against photoaging, as determined by UV-induced cellular secretions of IL-6, IL-8, MMP-1 and MMP-9.

Anti-aging/anti-senescence effects ex vivo:7 Senescent cells can have deleterious effects in the skin via different mechanisms, including high secretions of IL-6, IL-8, MMP-1 and MMP-9. Referred to as the senescence-associated secretory phenotype (SASP),12 these entities can be measured ex vivo as indicators of senescent and anti-senescent activities. Dermal fibroblasts are most commonly used. 

As such, in an ex vivo human skin model, wherein skin tissues were ethically obtained from female Thai donors 35 years or older, the activities of the catechin-rich elixir against IL-6 and MMP-1 were examined, as were its effects on hyaluronic acid and collagen production.

Results

Elixir characterization: The resulting elixir comprised optimized levels of TPC, TFC and TTC content (see Figure 1), wherein EGCG was identified as the dominant catechin. Notably, the extraction process provided greater TPC than ultra-high pressure, microwave, ultrasonic, Soxhlet and reflux extraction (390.68-576.02 mg gallic acid/g extract) carried out using same solvent and extraction time (not shown).8 Similarly, TFC (14.3-38.18 mg quercetin/g extract)9 and TTC (6.0-7.45 mg tannic acid/g extract)10 were notably higher than with standard extraction (also not shown). 

Antioxidant effects: The various in vitro assays confirmed the elixir’s antioxidant activities (see Figure 1), where its anti-DPPH ability was higher than that of a Brazilian Assam tea extract prepared by ultrasound-assisted extraction (IC50 = 8.33-16.10 µg/mL),11 as well as Iranian and Ethiopian preparations (IC50 = 167.11-505.5 and 7.3-64.0 µg/mL; not shown).9, 10 

Anti-aging effects in vitro: Cocultured HaCaT and HDF, a cellular model that closely mimics skin’s physiology, was treated with the elixir, which was determined to be noncytotoxic to the model (see Figure 2) and protected the coculture against photo-damage. More specifically, UV-induced cellular secretions of IL-6, IL-8, MMP-1 and MMP-9 were clearly suppressed with the catechin-rich elixir, whereby its biologically active marker, EGCG, was indicated. 

Anti-aging effects ex vivo: As stated, the elixir’s potential to mitigate senescence was tested in a human ex vivo skin model. Results indicated the elixir suppressed IL-6 and MMP-1, as well as increased the production of hyaluronic acid and procollagen type I (PIP) (see Figure 3).

Conclusion

With consumers’ increased awareness of – and demand for – sustainable, circular products, plants and their byproducts are promising sources for both human consumption and other FMCGs. Industrial crops, especially medicinal herbs whose discarded components are highly available and whose safety is proven, warrant consideration. Tea affords this opportunity.

The catechin-rich, standardized tea extract elixir described here demonstrated significant antioxidant, anti-photoaging and anti-senescence benefits in vitro and ex vivo. Thus, it is proposed as an effective and circular anti-aging active for innovative skin care products.


References

1. Kanlayavattanakul, M., Mersni, D. and Lourith, N. (2024). Plant-derived saponins and their perspective for cosmetic and personal care products. Bot Stud (65)32.

2. Lourith, N., Kanlayavattanakul, M., Chaikul, P., Abe, A. and Takahashi, K. (2023). Tea-derived neuroprotectant demonstrates holistic anti-aging potential. Cosm & Toil 138 32-37.

3. Nualsri, C., Lourith, N. and Kanlayavattanakul, M. (2016). Development and clinical evaluation of green tea hair tonic for greasy scalp treatment. J Cosmet Sci. (67) 161-166.

4. Meetham, P., Kanlayavattanakul, M. and Lourith, N. (2018). Development and clinical efficacy evaluation of anti-greasy green tea toner on facial skin. Rev Bras Farmacogn (28) 214-217.

5. Lourith, N., Kanlayavattanakul, M., Chaikul, P. and Chueamchaitrakun, P. (2005). Thailand Patent Filling No. 2301005294. Assigned to Mae Fah Luang University. 

6. ISO. (2025). ISO. 14502-2. Determination of substances characteristic of green and black tea – Part 2: Content of catechins in green tea – Method using high-performance liquid chromatography. ANSI. Available at https://webstore.ansi.org/standards/iso/iso145022005-1121970?srsltid=AfmBOopwVF9cc3_iI6Ocktrsrc-_o_zoe0YwylGf7bv-LRNCF2-Rggb8

7. Kanlayavattanakul, M., Khongkow, M., Klinngam, W., Chaikul, P., Lourith, N. and Chueamchaitrakun, P. (2024). Recent insights into catechins-rich Assam tea extract for photoaging and senescent aging. Sci Rep (14) 2253.

8. Jun, X., Deji, S., Ye, L. and Rui, Z. (2011). Comparison of in vitro antioxidant activities and bioactive components of green tea extracts by different extraction methods. Int J Pharm (408) 97-101.

9. Roshanak, S., Rahimmalek, M. and Goli., S.A.H. (2016). Evaluation of seven different drying treatments in respect to total flavonoid, phenolic, vitamin C content, chlorophyll, antioxidant activity and color of green tea (Camellia sinensis or C. assamica) leaves. J Food Sci Technol (53) 721-729.

10. Bizuayehu, D., Atlabachew, M. and Ali, M.T. (2016). Determination of some selected secondary metabolites and their in vitro antioxidant activity in commercially available Ethiopian tea (Camellia sinensis). SpringerPlus (5)412.

11. ST Saito, G Gosmann, J Saffi, M Presser, MF Richter, AM Bergold. Characterization of the constituents and antioxidant activity of Brazilian green tea (Camellia sinensis var. assamica IAC-259 cultivar) extracts. J Agric Food Chem (55) 9409-9414 (2007).

12. Fitsiou, E., Pulido, T., Campisi, J., Alimirah, F. and Demaria, M. (2021). Cellular senescence and the senescence-associated secretory phenotype as drivers of skin photoaging. J Invest Dermatol. (141) 1119-1126.

13. Bernatoniene, J. and Kopustinskiene, D.M. (2008, Apr 20). The role of catechins in cellular responses to oxidative stress. Molecules. Available at https://tinyurl.com/56fnjt8h

14. Farrar, M.D., Nicolaou, A., … Rhodes, L.E., et al. (2015, Jul). A randomized controlled trial of green tea catechins in protection against ultraviolet radiation–induced cutaneous inflammation. The Amer J Clin Nutrition. Available at https://tinyurl.com/3a6bhetp.


Source link

29 05, 2025

Cardano (ADA) Price Prediction for May 28

By |2025-05-29T00:16:02+03:00May 29, 2025|Crypto News, News|0 Comments

Bears are back to the game as the rates of most of the coins are in the red zone, according to CoinStats.

ADA chart by CoinStats

ADA/USD

The price of Cardano (ADA) has fallen by 2% since yesterday.

Article image
Image by TradingView

On the hourly chart, the rate of ADA has once again bounced off the support of $0.7460. 

You Might Also Like

Title news

If bulls cannot seize the initiative, traders may witness a level breakout, followed by an ongoing decline to the $0.74 range.

Article image
Image by TradingView

On the bigger time frame, the price of ADA is far from key levels. In this case, one should focus on the interim level of $0.74. If it breaks out, there is a possibility to see a test of the support of $0.7171 by the end of the week.

Article image
Image by TradingView

From the midterm point of view, bears keep controlling the situation on the market. If the rate fixes below the $0.7171 level, there is a possibility to witness a drop to $0.65.

ADA is trading at $0.7429 at press time.

Source link

28 05, 2025

Type 2 Inflammation and Nasal Polyps

By |2025-05-28T23:29:59+03:00May 28, 2025|Fitness News, News|0 Comments

What is type 2 inflammation?

Not to be confused with type 2 diabetes, type 2 inflammation involves the immune system.

We all have a type 2 immune response, which is when your immune system sends out type 2 immune cells to fight certain infections or allergens.

Type 2 immune cells fight “intruders” by causing inflammation.

Type 2 inflammation can play a role in certain chronic conditions and health issues

In the nose, type 2 inflammation may lead to:

About 25–30% of people with CRS also have nasal polyps.

Symptoms of nasal polyps 

Nasal polyps are often painless and may not cause any symptoms, especially if they’re small. 

Large nasal polyps may block the nose, making breathing difficult. 

People with CRSwNP may experience:

Treating type 2 inflammation and nasal polyps 

For more information 

Wondering if you might be dealing with a type 2 inflammatory condition and/or nasal polyps? Talk to your healthcare provider. 

Resources

Allergy and Asthma Network

Asthma and Allergy Foundation of America

This educational resource was created with support fro m Sanofi and Regeneron.


Source link

28 05, 2025

Gold remains in a tight range between $3,290 and $3,320

By |2025-05-28T22:32:14+03:00May 28, 2025|Forex News, News|0 Comments


  • Gold prices bounce off moving average support, reclaiming the $3,300 level.
  • XAU/USD technical levels remain firm within a bull flag pattern.
  • Momentum remains neutral with a narrow range hinting at the potential for a breakout.

Gold prices are threatening key technical layers of support on Wednesday, with Bullion searching for a fresh catalyst to drive prices out of the confines of the bull flag pattern.

After erasing 1.25% on Tuesday, the momentum of the downtrend has temporarily paused. At the time of writing, Gold prices are trading above the $3,300 psychological level with the 20-day Simple Moving Average (SMA) providing additional support at $3,289.

The current zone of price action remains technically significant, as it aligns with the upper bound of the bull flag and the 23.60% Fibonacci Retracement level of the January-April move at $3,290.

Gold prices bounce off support as pressure builds within the confines of a bull flag

With the descending trendline from the bull flag providing an additional barrier of resistance for bulls near $3,320, bears have struggled to gain momentum below the Fibonacci support. 

With the Relative Strength Index (RSI) flattening around 52, the next big move for the yellow metal hinges on whether bulls or bears can break free from their relative zones of restriction.  

Gold daily chart

A breakdown below $3,200 could open the door toward the 38.2% retracement level at $3,161, followed by deeper support near the 50% and 61.8% Fibonacci levels at $3,057 and $2,952, respectively.

On the upside, a decisive breakout above the descending wedge, particularly a close above $3,350-$3,360, would likely attract bullish momentum. Such a breakout would target a retest of April’s all-time high just below $3,500.

Gold FAQs

Gold has played a key role in human’s history as it has been widely used as a store of value and medium of exchange. Currently, apart from its shine and usage for jewelry, the precious metal is widely seen as a safe-haven asset, meaning that it is considered a good investment during turbulent times. Gold is also widely seen as a hedge against inflation and against depreciating currencies as it doesn’t rely on any specific issuer or government.

Central banks are the biggest Gold holders. In their aim to support their currencies in turbulent times, central banks tend to diversify their reserves and buy Gold to improve the perceived strength of the economy and the currency. High Gold reserves can be a source of trust for a country’s solvency. Central banks added 1,136 tonnes of Gold worth around $70 billion to their reserves in 2022, according to data from the World Gold Council. This is the highest yearly purchase since records began. Central banks from emerging economies such as China, India and Turkey are quickly increasing their Gold reserves.

Gold has an inverse correlation with the US Dollar and US Treasuries, which are both major reserve and safe-haven assets. When the Dollar depreciates, Gold tends to rise, enabling investors and central banks to diversify their assets in turbulent times. Gold is also inversely correlated with risk assets. A rally in the stock market tends to weaken Gold price, while sell-offs in riskier markets tend to favor the precious metal.

The price can move due to a wide range of factors. Geopolitical instability or fears of a deep recession can quickly make Gold price escalate due to its safe-haven status. As a yield-less asset, Gold tends to rise with lower interest rates, while higher cost of money usually weighs down on the yellow metal. Still, most moves depend on how the US Dollar (USD) behaves as the asset is priced in dollars (XAU/USD). A strong Dollar tends to keep the price of Gold controlled, whereas a weaker Dollar is likely to push Gold prices up.


Source link

28 05, 2025

GBP/USD initial supports hold pullback for now

By |2025-05-28T22:30:59+03:00May 28, 2025|Forex News, News|0 Comments

GBP/USD outlook: Initial supports hold pullback for now

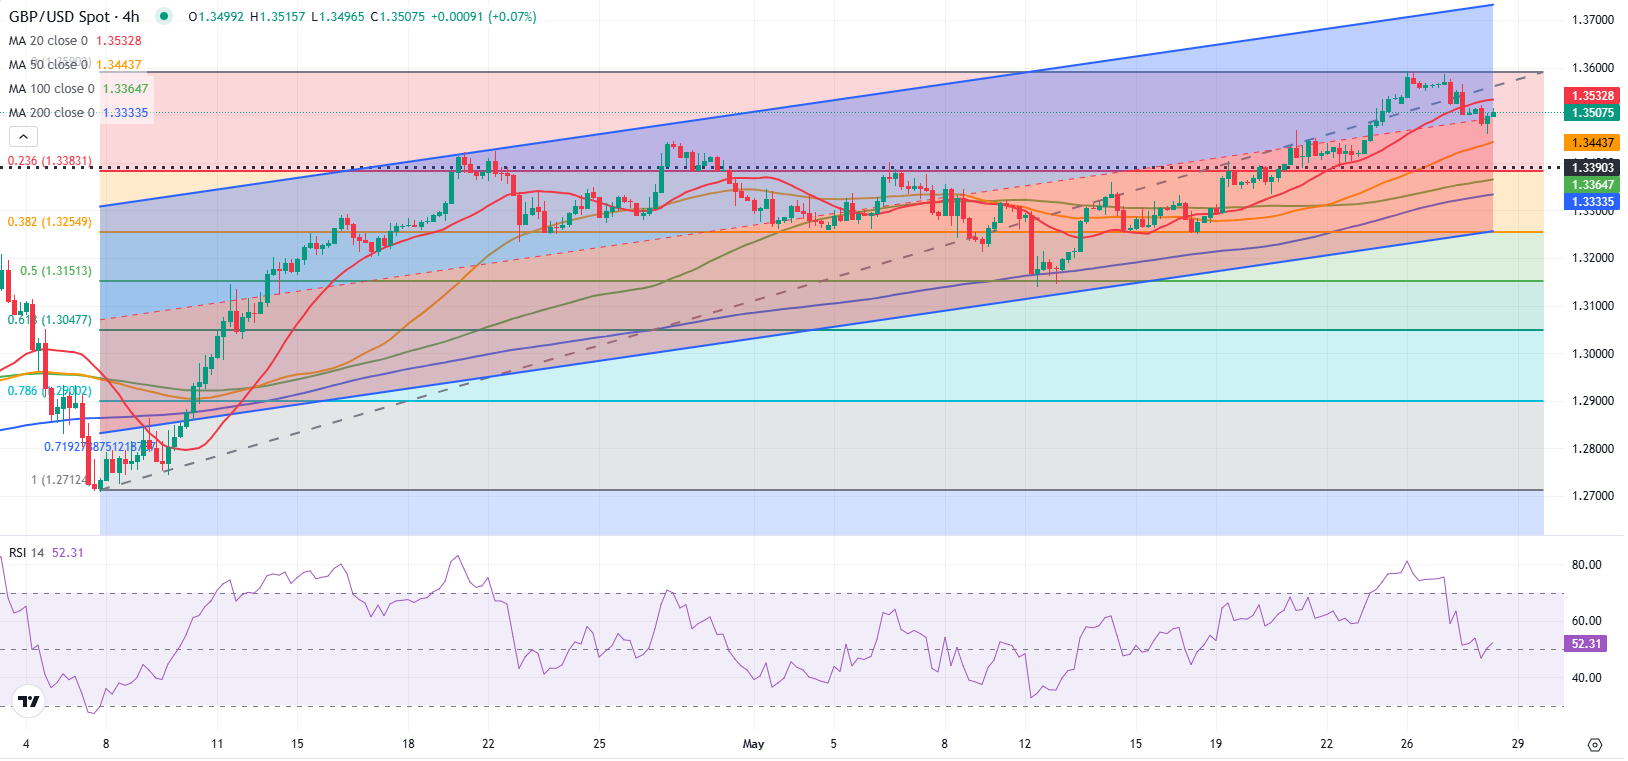
Cable remains at the back foot on Wednesday after Tuesday’s pullback from new multi-month high (1.3593) cracked psychological 1.3500 support. Price dipped to 1.3561 this morning, but quick bounce to 1.3500 zone points to headwinds that fresh bears face.

Today’s action was so far shaped in Doji candle (indecision) with short-lived probe below initial Fibo support at 1.3486 (23.6% of 1.3195/1.3593 upleg) adding to potential bear-trap formation, in scenario of very shallow pullback preceding fresh attempts to extend larger uptrend. Read more…

GBP/USD Forecast: Pound Sterling sellers could show interest with break below 1.3500

GBP/USD trades in a narrow channel slightly above 1.3500 on Wednesday after closing in negative territory and snapping a six-day winning streak on Tuesday. The pair’s technical outlook is yet to point to a bearish reversal but sellers could take action if the pair flips 1.3500 into resistance.

The US Dollar (USD) outperformed its rivals on Tuesday and weighed on GBP/USD, supported by an improving sentiment around the US economy on the back of upbeat data releases. Read more…

The power of Elliott Wave blue boxes: GBP/USD’s perfect bounce

In this technical blog, we will look at the past performance of the 1-hour Elliott Wave Charts of GBPUSD. In which, the rally from 13 January 2025 low is unfolding as an impulse sequence & showed a higher high sequence therefore, called for an extension higher to take place. We knew that the structure in GBPUSD should remain supported & extend higher. So, we advised members not to sell the pair & buy the dips in 3, 7, or 11 swings at the blue box areas.

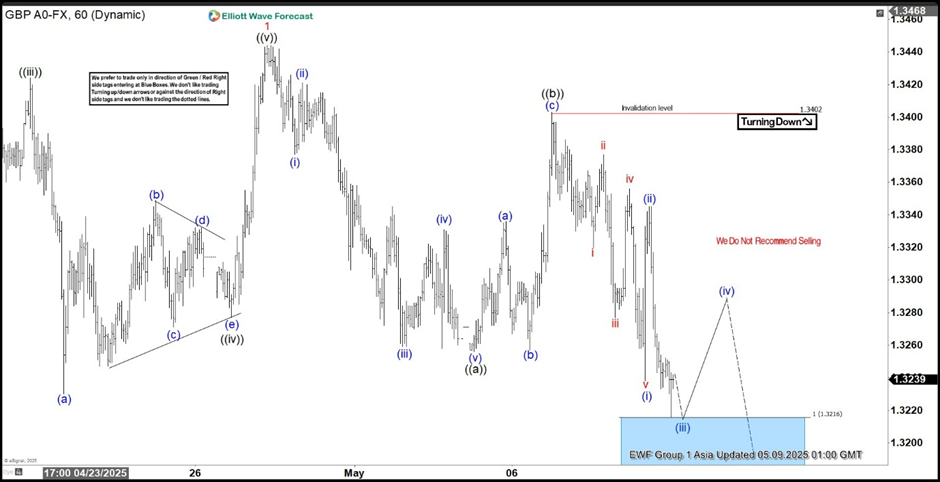
Here’s the 1-hour Elliott wave Chart from the 5.09.2025 Asia update. In which, the rally to $1.3443 high completed wave 1 & made a pullback in wave 2. The internals of that pullback unfolded as Elliott wave zigzag correction where wave ((a)) ended at $1.3257 low. Then a bounce to $1.3403 high-ended wave ((b)) & started the next leg lower in wave ((c)) towards $1.3216- $1.3100 blue box area. From there, buyers were expected to appear looking for new highs ideally or for a 3-wave bounce minimum. Read more…

Source link

28 05, 2025

As supplement use increases, so do cases of liver failure linked to them

By |2025-05-28T22:16:35+03:00May 28, 2025|Dietary Supplements News, News|0 Comments


WE ALL KNOW THE BASIC TENETS OF LIVING A HEALTHY LIFESTYLE: EXERCISING, EATING HEALTHY AND FOR MANY, TAKING VITAMINS AND SUPPLEMENTS.

BUT IT TURNS OUT, SOME SUPPLEMENTS BILLED TO HELP YOU LIVE COULD ACTUALLY BE PUTTING YOUR LIFE AT RISK.

IT ALL COMES DOWN TO YOUR LIVER —- THE ORGAN RESPONSIBLE FOR FILTERING HARMFUL SUBSTANCES FROM THE BLOOD.

AND WHILE YOUR LIVER WORKS HARD TO DO THAT, IT CAN BE OVERWHELMED BY CERTAIN DRUGS OR SUPPLEMENTS, LEADING TO SOMETHING CALLED “DRUG-INDUCED LIVER INJURY,” ALSO KNOWN AS TOXIC HEPATITIS.

ACETAMINOPHIN, MORE COMMONLY KNOWN UNDER THE BRAND NAME TYLENOL, IS A GOOD EXAMPLE.

IT’S ONE OF THE MOST COMMON CAUSES OF TOXIC HEPATITIS.

BUT AS MORE PEOPLE USE SUPPLEMENTS, MORE CASES ARE POPPING UP.

ACCORDING TO A 2024 SURVEY BY THE COUNCIL FOR RESPONSIBLE NUTRITION, AS MANY AS THREE OUT OF FOUR – OR 75% OF U.S. ADULTS TAKE SOME FORM OF SUPPLEMENT, WHETHER IT BE HERBAL OR DIETARY.

NEARLY 4 IN 5 SAID THEY’D RATHER TAKE SUPPLEMENTS THAN PRESCRIPTION OR OVER-THE-COUNTER MEDICATIONS.

COMPARATIVELY, THE CDC’S MOST RECENT STUDY DONE ON THE SUBJECT SHOWS THAT BETWEEN 2017 AND 2018, JUST A LITTLE OVER HALF OF ADULTS 20 AND OLDER HAD USED A SUPPLEMENT IN THE LAST 30 DAYS.

A STUDY PUBLISHED IN THE MEDICAL JOURNAL “LIVER TRANSPLANTATION” IN 2022 FOUND THE NUMBER OF PATIENTS ADDED TO THE WAIT LIST FOR A TRANSPLANT **BECAUSE** OF SUPPLEMENT-RELATED LIVER FAILURE INCREASED EIGHTFOLD FROM 2.9% IN 1995 TO 24.1% IN 2020.

EXPERTS SAID IT’S HARD TO FIGURE OUT WHAT THE EXACT CULPRIT IS.

A 2017 STUDY BY THE AMERICAN ASSOCIATION FOR THE STUDY OF LIVER DISEASES FOUND 20% OF LIVER TOXICITY CASES IN THE U.S. COULD BE LINKED TO DIETARY OR HERBAL SUPPLEMENTS.
SINCE THE SUPPLEMENTS CONTAIN MULTIPLE INGREDIENTS, THEY’RE NOT SURE WHICH ONE –- OR ONES –- ARE TO BLAME.

HOWEVER, THERE ARE SOME YOU CAN MAKE SURE TO LOOK OUT FOR.

A STUDY PUBLISHED LAST YEAR OUT OF THE UNIVERSITY OF MICHIGAN FOUND SIX COMMON INGREDIENTS **CAN** DEFINITIVELY BE TIED TO TOXIC HEPATITIS:

THESE ARE TURMERIC, GREEN TEA EXTRACT, ASHWAGANDHA, GARCINIA CAMBOGIA, RED YEAST RICE AND BLACK COHOSH.

THE STUDY’S AUTHORS SAID ABOUT 15 MILLION AMERICANS TAKE AT LEAST ONE OF THOSE SUPPLEMENTS.

AND SINCE SUPPLEMENTS ARE NOT REGULATED IN THE SAME WAY MEDICATIONS ARE, YOU CAN’T ALWAYS BE SURE WHAT YOU’RE GETTING OR IF THE DOSAGE IS CORRECT.

TO STAY ON TOP OF ALL THE LATEST, UNBIASED FACTS YOU NEED TO LIVE YOUR HEALTHIEST LIFE – MAKE SURE YOU DOWNLOAD THE STRAIGHT ARROW NEWS APP TODAY.


Source link

28 05, 2025

XRP uptrend at risk as SEC prepares to hold conference on digital assets 

By |2025-05-28T22:15:27+03:00May 28, 2025|Crypto News, News|0 Comments

  • XRP downside risks persist as the price extends the pullback and tests the $2.27 support level.
  • The SEC’s third conference on digital assets and tokenization will bring together asset managers, regulators and academics on June 5.
  • SEC Commissioner Hester Peirce is expected to participate in the conference along with other panelists.
  • Ripple submitted a letter to the SEC’s Crypto Task Force, stressing the importance of a new and clear regulatory framework for digital assets.

Ripple (XRP) has been trading in a narrow range between $2.65 and $2.27 for nearly three weeks, with a bias toward the support level. The short-term technical outlook suggests that the current market value of $2.28 on Wednesday could pave the way for extended losses. The doldrums may continue into the weekend, ahead of the release of the Federal Reserve’s (Fed) May meeting minutes later on Wednesday and the Personal Consumption Expenditure (PCE) Price Index inflation data on Friday.

Beyond the range support, trader interest could shift to the demand zone at $2.07 as bulls seek liquidity to make make another attempt at recovery.

SEC to host third conference on emerging trends 

The United States Securities and Exchange Commission (SEC) has announced that the next conference on digital assets and tokenization will be held on June 5. According to a press release, the conference, hosted by the Commission’s Division of Investment Management, will bring together various asset managers in the industry, regulators and academics.

Key topics likely to take center stage include digital assets and tokenization, product proliferation and innovation, as well as access to private markets. SEC Commissioner Hester Peirce and Investment Management Division Director Natasha Vij Greiner will be among the panelists present. 

Meanwhile, Ripple’s Chief Legal Officer, Stuart Alderoty, said on X that the company has submitted a letter to the SEC’s Crypto Task Force, addressing a pivotal question from “Commissioner Peirce’s ‘New Paradigm’ speech: When does a digital asset separate from an investment contract?”

According to Ripple, which reiterated an analysis by Lewis Cohen, “there is no current basis in the law relating to ‘investment contracts’ to classify most fungible crypto assets as ‘securities’ when transferred in secondary transactions because an investment contract transaction is generally not present and these assets neither create nor represent the necessary cognizable legal relationship between an identifiable legal entity on the one hand and the owner of the crypto asset on the other that is the hallmark of a security.”

Still, Ripple insists in the letter that there is a gap in existing laws corresponding to securities offerings, urging guidance from the SEC by establishing a clear regulatory framework. Such a step could reduce enforcement risk and provide clear compliance guidelines, especially during the early stages of network development.

Ripple’s letter adds that the framework should seek to offer clarity where uncertainty exists rather than “blur boundaries that are already settled.”

Technical outlook: What’s next as XRP hangs at the edge of a cliff 

XRP’s price is attempting to establish support at the 100-day Exponential Moving Average (EMA), currently positioned at around $2.27, after slipping slightly below the 50-day EMA at approximately $2.29.

Based on the daily chart below, the path with the least resistance is downward. A sell signal from the Moving Average Convergence Divergence (MACD) indicator could encourage traders to reduce exposure to XRP, especially with sell-side pressure rising. 

The signal occurred when the blue MACD line crossed beneath the red signal line on May 20. Green histogram bars expanding below the mean line (0.00) signal bearish momentum.

The Relative Strength Index (RSI) downtrend, which is now below the 50 midline, reflects XRP’s intensifying bearish momentum. Should the RSI slide further down into the oversold region, XRP could fall under the 100-day EMA at $2.27, consequently validating a bear flag pattern currently projecting a 55% move to $1.00. This target is determined by measuring the flagpole and extrapolating half the distance below the breakout point.

XRP/USDT daily chart

Beyond the 100-day EMA at $2.27, key areas of interest, especially for traders watching for dips, include the 200-day EMA support at $2.07, the April 7 low at $1.61, and the bear flag breakout target at $1.00.

However, traders should consider the dynamic support offered by the SuperTrend indicator at $2.17. This is a trend-following tool that combines price and volume data to gauge volatility. 

A buy signal is triggered when the XRP price crosses above the SuperTrend line, with the indicator’s color changing from red to green. Targets on the upside lie at $2.65, where the XRP price was rejected on May 12, and at $3.00, a psychological resistance level.

Cryptocurrency prices FAQs


Source link

28 05, 2025

Chile’s Cochilco raises copper price forecast

By |2025-05-28T20:30:58+03:00May 28, 2025|Forex News, News|0 Comments


BHP’s Escondida copper mine in Chile. (Image: Wikimedia Commons)

Chile’s state copper commission Cochilco raised its average copper price forecast for 2025 to $4.30 per pound, citing an improved global outlook following a tariff agreement between the US and China, mining minister Aurora Williams said on Wednesday.

The commission also increased its average price projection for 2026 to $4.30 per pound. Both estimates were previously $4.25 in its February report.

Separately, the agency projected that Chilean copper production will increase by 3% this year and again in 2026, when it is expected to reach 5.84 million metric tons.

The production guidance reflects a downgrade from Cochilco’s February estimate of 4.6% growth in 2025 and 3.6% growth in 2026.

(By Fabian Cambero and Brendan O’Boyle; Editing by Natalia Siniawski)


Source link

Go to Top