About Editorial team of BIPNs

Main team of content of bipns.com. Any type of content should be approved by us.
23 05, 2025

Ethereum ($ETH) Price Prediction for May 24

By |2025-05-23T13:07:59+03:00May 23, 2025|Crypto News, News|0 Comments

Ethereum bulls are attempting to stretch their winning streak into May 24, with the Ethereum price pushing past short-term consolidation and nearing critical resistance. After consolidating for much of the past week, ETH has surged more than 7% over the last 48 hours and is now trading just below a key psychological level that may decide the next leg of its trend.

Highlights:

  • Ethereum price today is trading around $2,724 after testing intraday highs near $2,733
  • MACD crossover and Ichimoku breakout suggest bullish continuation, but RSI nears overbought zone
  • Key support lies at $2,685; resistance overhead at $2,745 and $2,800 remains unbroken

What’s Happening With Ethereum’s Price?

The Ethereum price today is trading near $2,724, up roughly 0.5% intraday, and attempting to solidify its breakout from the $2,680–$2,690 resistance band. On the 4-hour chart, ETH has made a decisive move above the Bollinger mid-band and the 20/50 EMA clusters, indicating rising trend strength. However, the price is now sitting just under the Fibonacci 0.0 level at $2,745.52—retraced from the $4,105 high to $1,385 low—marking a crucial resistance.

The Ethereum price action since the May 22 breakout has been supported by strong bullish momentum, and today’s structure reflects a textbook continuation pattern as long as price holds above the $2,685–$2,700 support zone. That said, multiple indicators now suggest ETH is entering a “watch zone” where overextension could trigger short-term volatility.

RSI, MACD Signal Strength—But Exhaustion May Be Near

Looking at oscillators, the 30-minute RSI currently reads 68.71—just below the overbought 70 threshold—indicating the rally still has room to run but may face slowing momentum above $2,740. More importantly, the MACD has flipped positive with a bullish crossover, and histogram bars are accelerating to the upside, confirming upside momentum.

However, Stoch RSI on the 30-minute chart is cooling from its previous peak, hinting at a brief pause or pullback if immediate resistances reject price. Similarly, the Chande Momentum Oscillator sits at 58.93, indicating strength but not without risk of reversal if sentiment cools.

Why Ethereum Price Going Up Today

The question on traders minds is: Why is the Ethereum price going up today despite broader crypto market indecision? The answer lies in the breakout above the long-standing descending trendline that capped ETH since March. The recent surge above $2,685 coincided with a spike in trading volume and a clean break above the Ichimoku cloud, a sign of trend reversal on higher timeframes. This bullish structure is supported by the 4-hour Ichimoku span twist and a thick Kumo cloud providing future support—both of which signal that ETH’s bullish path may have legs toward the $2,800–$2,900 zone.

On the daily chart, Ethereum has now printed a clean breakout above the red resistance block between $2,600 and $2,730. This zone previously acted as a cap in March and April, and the breakout suggests buyers are eyeing a move toward the next resistance near $2,980 and possibly the 0.618 weekly Fib level at $3,159.

Key Levels to Watch and Price Forecast

From a chart perspective, the current structure remains bullish, but traders should be aware of potential overhead supply zones. Immediate resistance is now at $2,745 (Fib 0.0 level), followed by $2,800 and $2,980. If bulls maintain momentum and break these levels with volume, a fast move to $3,100 is not off the table.

On the downside, the first line of defense lies at $2,685 (Ichimoku Tenkan-sen), followed by $2,654 and $2,592 (20-EMA). A break below these levels could expose Ethereum to a retest of the $2,530–$2,444 demand band.

Short-Term Ethereum Price Forecast

Indicator Level / Signal
Ethereum price today ~$2,724
Immediate resistance $2,745 – $2,800
Key support zone $2,685 – $2,654
RSI (30-min) 68.71 (near overbought)
MACD (30-min) Bullish crossover, positive histogram
Bollinger Bands Price above mid-band and upper band expanding
Ichimoku Cloud (4H) Bullish breakout, strong cloud support
Fib Resistance 0.0 level at $2,745.52

The Ethereum price update shows that ETH remains bullish above $2,700 as momentum indicators point to a potential test of $2,800 or higher. However, traders should watch for overbought signals near resistance zones. If bulls can clear $2,745 with volume, Ethereum could enter a steeper climb. Otherwise, a short-term cool-off may precede the next leg higher.

Disclaimer: The information presented in this article is for informational and educational purposes only. The article does not constitute financial advice or advice of any kind. Coin Edition is not responsible for any losses incurred as a result of the utilization of content, products, or services mentioned. Readers are advised to exercise caution before taking any action related to the company.


Source link

23 05, 2025

Gold (XAUUSD) Price Forecast: Price Stalls – Breakout or Breakdown Ahead?

By |2025-05-23T11:19:58+03:00May 23, 2025|Forex News, News|0 Comments


20-Day MA Holds as Support

If the 20-Day line can continue to show as support, then gold may have a chance to go a little higher towards the next target around the 78.6% Fibonacci retracement at $3,371. Since that price level is currently aligned with the convergence of two trendlines, there remains a possibility that it is touched before the current advance from trendline support reached last week is complete. Moreover, the convergence suggests a key pivot level where an upside-breakout could be followed by a move as demand kicks in.

Advance Stalls

A decline below today’s low shows short-term weakness and could lead to a test of support around $3,252. Further down is the 50-Day MA, now at $3,191. Along with the lower trendline the 50-Day MA marks potential dynamic support for the uptrend. The current upswing began following the November 2024 lows following a failed upside breakout of a rising trend channel (blue) on April 11. It reestablishes the integrity of the trend and therefore the possibility of a continuation higher. Subsequently, as long as gold trades above the 50-Day MA, the market is indicating it is prepared to go higher. Also, since the 20-Day MA is being recognized, it provides a shorter-term indicator for strength or weakness.

Weekly Closing Will Provide Clue

It is interesting to note that the two previous weekly upside breakouts failed, and each week ended with the price of gold below the prior week’s high. In other words, the weekly breakouts were not confirmed. A third weekly breakout occurred this week. The breakout will be confirmed by a weekly closing price above last week’s high of $3,292. One way to think about it is if the breakout confirms the chance of at least reaching the $3,371 price area improves. If this week ends below last week’s high, consolidation within the declining channel may prevail.

For a look at all of today’s economic events, check out our economic calendar.


Source link

23 05, 2025

GBP/USD Forecast: Pound Sterling “Mid Performer” Following US, UK PMIs

By |2025-05-23T11:18:39+03:00May 23, 2025|Forex News, News|0 Comments

May 23, 2025 – Written by Ben Hughes

The Pound-to-Dollar exchange rate (GBP/USD) was rangebound on Thursday following the release of the US’s and UK’s preliminary S&P Global PMIs.

At the time of writing, GBPUSD was trading at approximately $1.3425, virtually unchanged from the start of Thursday’s session.

The US Dollar (USD) advanced against most major peers on Thursday, supported by stronger-than-expected PMI data for May.

Fresh figures from S&P Global revealed an uptick in both the manufacturing and services sectors, surprising markets who had projected a slowdown.

Manufacturing activity jumped to 52.3, defying expectations of a decline to 50.1, while the services PMI also rose to 52.3, indicating a broad-based expansion.

Commenting on the data, S&P’s Chris Williamson noted an encouraging rebound in business sentiment, crediting the easing of tariff pressures for lifting outlooks.

The upbeat economic data boosted confidence in the US economy and helped lift the ‘Greenback’ against a range of currencies, although gains against the Pound were more limited.


Sterling traded steadily on Thursday, and even rose against several of its counterparts, following the release of the UK’s latest PMI readings for May.

Although manufacturing activity remained in contraction, with the index edging down to 45.1, the services sector surprised to the upside.

The services PMI climbed back above the 50 threshold, exceeded economists’ expectations by hitting 50.2, and signalled a return to modest growth.

This glimpse of resilience in the UK’s dominant services industry offered some reassurance to markets, helping the Pound maintain its footing during Thursday’s European session.

“GBP is down 0.2% vs. the USD and a mid-performer among the G10, trading relatively well despite a generally disappointing preliminary PMI release. The manufacturing print disappointed with a relatively deep contractionary print of 45.1 while services climbed just above the expansion threshold, printing 50.2.” – Scotiabank

The Pound US Dollar (GBP/USD) exchange rate could come under pressure on Friday, with investors eyeing the UK’s latest retail sales data for direction.

April’s figures are expected to indicate a slowdown in consumer activity, with sales growth forecast to ease from 0.4% to 0.2%.


Any downside surprise could sour sentiment towards Sterling by fuelling concerns about the UK economy.

Meanwhile, with a quiet end to the week for US economic releases, the spotlight may shift to a scheduled speech from a Federal Reserve policymaker.

If the remarks lean dovish, the US Dollar could extend its recent losses, adding another layer of volatility to the currency pair heading into the weekend.

Like this piece? Please share with your friends and colleagues:


International Money Transfer? Ask our resident FX expert a money transfer question or try John’s new, free, no-obligation personal service! ,where he helps every step of the way,
ensuring you get the best exchange rates on your currency requirements.

TAGS: Pound Dollar Forecasts

Source link

23 05, 2025

Global Arabinogalactan Market to Reach USD 200.7 Million

By |2025-05-23T11:07:56+03:00May 23, 2025|Dietary Supplements News, News|0 Comments


Arabinogalactan Market

The global Arabinogalactan Market is projected to reach USD 200.7 million by 2025, bolstered by rising health consciousness and demand for plant-based additives. From 2025 to 2035, international trade of arabinogalactan is expected to grow at a CAGR of 3.7%, reaching USD 288.6 million by 2035. As consumers increasingly favor preventive healthcare and wellness products, arabinogalactan-a natural polysaccharide derived from larch trees-is gaining attention as a multifunctional ingredient in dietary supplements, pharmaceuticals, and food products.

Heightened interest in clean-label and vegan formulations has placed arabinogalactan in the spotlight as a desirable alternative to starch-based additives. The market is also benefiting from a shift in consumer behavior, where individuals prefer spending on nutritional support rather than curative healthcare. This changing mindset is opening doors for plant-derived, immune-boosting ingredients like arabinogalactan across multiple industries.

Your Guide to Market Intelligence – Download a Sample Copy: https://www.futuremarketinsights.com/reports/sample/rep-gb-4381

Mergers and Acquisitions:

Recent strategic partnerships and acquisitions have bolstered the global reach and product capabilities of arabinogalactan suppliers. For instance, Lonza Group expanded its functional ingredient portfolio through acquisitions in plant-based supplement firms, enhancing its arabinogalactan-based product offerings. Similarly, key players such as Ametis JSC and Finland’s Larex Inc. are exploring cross-border collaborations to streamline production and meet increasing international demand.

Key Takeaways:

• The market is anticipated to reach USD 288.6 million by 2035.

• CAGR of 3.7% during the forecast period highlights a stable growth trajectory.

• Demand is driven by the surge in health supplement consumption and clean-label preferences.

• Emerging vegan trends and starch-free diets are fueling product innovation.

Emerging Trends in Global Market:

The rising popularity of functional foods and nutraceuticals is a prominent trend boosting arabinogalactan adoption. Additionally, increased R&D investments are leading to new product launches combining arabinogalactan with probiotics and prebiotics. The growing vegan population worldwide is propelling demand for plant-based, hypoallergenic, and starch-free food ingredients, with arabinogalactan fitting perfectly into these criteria.

Significant Developments in Global Sector:

Several companies have announced launches of new arabinogalactan-infused formulations tailored for immunity support and gut health. Biopharmaceutical companies are also exploring its prebiotic benefits in clinical trials. Regulatory bodies in North America and Europe have recently updated guidelines to simplify the use of arabinogalactan in food and dietary products, further encouraging innovation and market expansion.

Trends and Opportunities in the Market:

The inclination toward natural ingredients and dietary supplementation has unlocked multiple opportunities for manufacturers and startups in this space. Arabinogalactan is finding traction as a dietary fiber, stabilizer, and immune-enhancing component. It presents lucrative potential for applications in infant nutrition, sports supplements, and elderly care products. Market players are also exploring its use in cosmetics and personal care due to its moisturizing properties.

Recent Developments in the Market:

• Ametis JSC launched a new range of arabinogalactan-based dietary supplements in Eastern Europe.

• New product testing in the U.S. is exploring arabinogalactan for use in athletic performance nutrition.

• European nutraceutical companies are piloting formulations combining arabinogalactan with gut-health probiotics.

• Key firms are investing in advanced extraction technologies to improve product purity and scalability.

Access All the Insights You Need – Download Full Report Now: https://www.futuremarketinsights.com/reports/arabinogalactan-market

Region-wise Insights:

• USA: With a CAGR of 3.5%, the U.S. continues to lead in innovation and adoption of arabinogalactan in dietary supplements and wellness products.

• Germany: Projected to grow at 3.9%, Germany is a hub for natural and plant-based ingredient research, driving robust demand for arabinogalactan.

• China: Growing awareness of digestive health and preventive care will push China’s market to expand at 3.6% CAGR.

• Japan: At a CAGR of 3.4%, Japan’s aging population is fueling the market for immunity-boosting and gut-friendly ingredients.

• India: With the highest projected CAGR of 4.0%, India is emerging as a promising market due to the rapid growth of the nutraceutical sector and increasing health awareness.

Competition Outlook:

The Arabinogalactan Market remains moderately consolidated, with a few players commanding significant market share. Leading companies include Lonza Group, Ametis JSC, Larex Inc., and Chemos GmbH. These firms are focusing on strategic expansions, R&D investments, and partnerships to strengthen their competitive positioning. The entry of new regional players and startups is expected to intensify competition, especially in emerging markets like India and Southeast Asia.

Leading Brands

• BASF SE

• DuPont de Nemours Inc.

• Archer Daniels Midland Company

• Cargill Incorporated; Lonza

• Pure Encapsulations

• Ametis JSC

• VetriScience Laboratories

• FoodScience of Vermont

• Thorne Research Inc

• Other Prominent Market Player

Explore Functional Food Ingredients Industry Analysis: https://www.futuremarketinsights.com/industry-analysis/functional-food-ingredients

Key Segmentation

By Type:

Market segmented into Capsule and Powder.

By Application:

Market segmented into Food and Beverage, Animal Feed, Pharmaceuticals, Cosmetic, and Others.

By Region:

Market segmented into North America, Latin America, Europe, Asia Pacific, and the Middle East & Africa (MEA).

Explore FMI’s related ongoing Coverage in Food and Beverage Domain:

Dead Sea Mineral Market: https://www.futuremarketinsights.com/reports/dead-sea-mineral-market

Food Fortification Market: https://www.futuremarketinsights.com/reports/food-fortification-market

Chitosan Market Share Analysis: https://www.futuremarketinsights.com/reports/chitosan-market-share-analysis

Food-grade Glycerin Market: https://www.futuremarketinsights.com/reports/food-grade-glycerin-market

Contact Us:

Future Market Insights Inc.

Christiana Corporate, 200 Continental Drive,

Suite 401, Newark, Delaware – 19713, USA

T: +1-347-918-3531

Website: https://www.futuremarketinsights.com

About Future Market Insights (FMI)

Future Market Insights, Inc. (ESOMAR certified, recipient of the Stevie Award, and a member of the Greater New York Chamber of Commerce) offers profound insights into the driving factors that are boosting demand in the market. FMI stands as the leading global provider of market intelligence, advisory services, consulting, and events for the Packaging, Food and Beverage, Consumer Technology, Healthcare, Industrial, and Chemicals markets. With a vast team of over 400 analysts worldwide, FMI provides global, regional, and local expertise on diverse domains and industry trends across more than 110 countries.

This release was published on openPR.


Source link

23 05, 2025

Moo Deng (MOODENG) Price Prediction: Moo Deng Overtakes Dogecoin in Trading Volume as Analysts Forecast Major Comeback Rally

By |2025-05-23T11:06:06+03:00May 23, 2025|Crypto News, News|0 Comments

Despite a recent 11.9% pullback, Moo Deng crypto is drawing attention for all the right reasons.

Analysts are calling the dip a “healthy correction,” noting that the Moo Deng token continues to trade within a bullish structure, supported by strong fundamentals and growing community hype.

Currently priced around $0.25, Moo Deng coin saw a steep rise in recent weeks, briefly touching $0.27 before the cooldown. Technical analysts say the Moo Deng coin chart is now testing a confluence of bullish indicators—including the 0.618 Fibonacci retracement, 200-day moving average, and a long-standing horizontal support level.

“This is exactly where bulls want to see price action stabilize,” one market watcher explained. “If Moo Deng forms a higher low here, we could see a retest of $0.31 and even $0.35.”

Moo Deng vs Dogecoin: Trading Volume Flip Signals Meme Coin Shift

One of the biggest surprises in the Moo Deng meme coin news cycle came on May 22, when Moo Deng briefly overtook Dogecoin in 24-hour trading volume on Coinbase. According to data from CoinGecko, Moo Deng notched $12.3 million in trading volume, surpassing Dogecoin’s $10.8 million.

Moo Deng temporarily surpassed Dogecoin in 24-hour trading volume on Coinbase. Source: ALTucard via X

This spike sparked a wave of social media hype, with Twitter account @KookCapitalLLC joking that Moo Deng “addressed the media” after the milestone. While the post was tongue-in-cheek, the numbers are real and highlight shifting trader sentiment.

“Moo Deng trading volume on Coinbase is a major signal,” said one analyst. “It shows retail momentum moving away from legacy meme coins like Dogecoin and Shiba Inu, and toward new cultural tokens with viral backstories.”

Celebrity Support and Charity Fuel the Moo Deng Narrative

Part of Moo Deng’s appeal lies in its backstory. Named after a real-life baby pygmy hippo in Thailand, the Moo Deng token gained international attention after Ethereum co-founder Vitalik Buterin donated 88 ETH—worth roughly $10 million Thai baht—to Khao Kheow Zoo in Moo Deng’s honor.

Moo Deng (MOODENG) Price Prediction: Moo Deng Overtakes Dogecoin in Trading Volume as Analysts Forecast Major Comeback Rally

Moo Deng (MOODENG) was trading at around $0.25, up 8.12% in the last 24 hours at press time. Source:Brave New Coin

The donation, made in December 2024, sparked a wave of goodwill and interest in the token. As a result, Moo Deng crypto saw a 125% surge in price, accompanied by record trading volumes.

This blend of blockchain culture, charity, and animal-themed storytelling has helped Moo Deng meme coin stand out in a crowded market.

Moo Deng Tokenomics and Support Levels Key to Next Move

With Moo Deng testing the 0.618 Fibonacci support level, analysts are eyeing this zone for a potential price breakout. If support holds, a bullish reversal could send the Moo Deng coin price toward previous resistance areas.

 Aminazarmi

Moo Deng’s overall uptrend remains intact, backed by key technical signals and rising institutional interest. Source: Aminazarmi on TradingView

Meanwhile, Moo Deng whales activity is showing signs of accumulation rather than distribution—another bullish signal. The Moo Deng coin supply and demand dynamic remains tight, with exchange liquidity increasing post-listing on Korea’s Coinone exchange.

This listing not only boosted Moo Deng’s visibility in Asia but also triggered a spike in institutional and retail inflows. The Moo Deng coin Binance listing rumors, though unconfirmed, are now adding to market speculation.

Moo Deng Community Growth and Market Sentiment

The Moo Deng community has expanded rapidly across social platforms, further feeding the meme coin’s momentum. From Reddit threads to Twitter spaces, retail traders are actively discussing Moo Deng coin price target projections and potential use cases.

Coinone

MOODENG Secures Listing on Coinone Exchange. Source: Coinone via X

While some question, “Is Moo Deng coin a good investment?”, others view it as a cultural asset rather than a traditional crypto play. Its viral narrative, charity angle, and fast-growing community give Moo Deng staying power that’s uncommon among meme coins.

Final Thoughts: Future of Moo Deng Crypto

Despite its recent correction, Moo Deng continues to dominate the meme coin conversation. Its breakout above Dogecoin in trading volume is a symbolic moment, suggesting a new contender in the meme coin wars.

If the current support level holds and bullish momentum returns, Moo Deng price prediction models suggest a potential move toward the $0.31–$0.35 range in the near term. However, traders should remain cautious, as meme coins are inherently volatile and can reverse sharply.

Still, with strong fundamentals, active community engagement, and cultural relevance, the future of Moo Deng crypto looks increasingly promising—at least for now.

Source link

23 05, 2025

ICICI Bank Slashes 2025 Brent Crude Forecast to $60–$70 Amid Weak Demand

By |2025-05-23T09:19:16+03:00May 23, 2025|Forex News, News|0 Comments


Crude oil prices are expected to trade with a downward bias throughout 2025, according to a new report by ICICI Bank. The bank has significantly lowered its Brent crude oil price forecast for the year, citing a combination of rising global supply and subdued demand. Brent prices are now projected to remain in the range of $60 to $70 per barrel, with a potential dip to as low as $55 per barrel if bearish trends persist.

This marks a substantial downward revision from ICICI Bank’s previous forecast of $65 to $80 per barrel. The bank now estimates that the average price of Brent crude in 2025 will be around $65, compared to an earlier projection of $72 per barrel.
The primary driver behind this revised outlook is an anticipated net supply surplus of 1 million barrels per day (mbpd) over the course of the year. This surplus stems from a combination of sluggish global demand growth and increased oil production from both OPEC and non-OPEC countries. The report notes that this marks a clear transition from the conditions seen in 2024, when the market was grappling with a supply deficit during the same period.

ICICI Bank highlights that historically, a surplus in global oil supply tends to exert downward pressure on prices, and early data from March and April 2025 already points to this trend taking shape. The bank warns that unless there is a significant geopolitical disruption—such as tensions escalating in the Middle East, particularly involving Iran—or a strong demand recovery driven by Chinese economic stimulus, oil prices are unlikely to rebound meaningfully.
“In the absence of major supply shocks or demand accelerators, crude prices are expected to remain subdued for the rest of the year,” the report stated.

With global oil markets shifting into a phase of oversupply and demand staying weak, ICICI Bank believes the crude oil market is entering a transitional phase, and 2025 could witness persistently low oil prices unless the balance shifts significantly. The bank’s assessment underscores growing concerns among analysts about a prolonged period of pressure in the energy sector.

Read This Also: UBS Ups BEL Share Price Target To Rs 450 – Buy, Sell Or Hold This Defence Stock?


Source link

23 05, 2025

Want to Make Your Own Matcha Latte? According to the Internet, These

By |2025-05-23T09:07:03+03:00May 23, 2025|Dietary Supplements News, News|0 Comments


Let’s be real: matcha has completely taken over the internet.

Image Credit: Cao from Pexels

These days, everyone’s obsessed with the earthy green drink — and honestly, I get it. The craze has gotten so real that people (myself included) are ditching $8 coffee runs and making their own matcha at home.

But with so many options flooding your Amazon search, it’s hard to know which powders are actually worth the hype. As someone who’s been making matcha for the past four years, I’ve tried my fair share — and done a deep dive into the best-reviewed, most-recommended picks out there.

Free A vibrant matcha latte with latte art held against a green leafy backdrop. Stock Photo

Image Credit: Petrik from Pexels

I did the digging, scrolling, and review-sifting so you don’t have to. According to the internet (and by that, I mean thousands of reviews), these are the best matcha powders you can get on Amazon right now.

1. Encha Latte Grade Matcha

Rating: ★★★★☆ (4.4/5 from 8,400+ reviews)

Diet Type: USDA Organic, Vegan

Designed specifically for lattes and smoothies, Encha’s latte-grade matcha is made from the first harvest of organic tea leaves grown in Uji, Japan, a region renowned for producing top-tier matcha. It’s unsweetened, rich in L-Theanine and caffeine, and blends beautifully with milk.

Perfect for:

  • Daily homemade matcha lattes
  • Smoothies or wellness shots
  • Anyone who wants high-quality matcha without the ceremonial price tag

2. Jade Leaf Organic Matcha

Rating: ★★★★☆ (4.5/5 from 98,000+ reviews)

Diet Type: USDA Organic, Gluten-Free

This culinary-grade powder is made from second-harvest leaves grown in Japan, which means it’s perfect for smoothies, lattes, baking, and everyday use. It’s not as vibrant or smooth as ceremonial matcha, but it’s flavorful, versatile, and super accessible.

Perfect for:

  • Matcha beginners
  • Baking matcha cookies, pancakes, or energy balls
  • Affordable daily matcha lattes

3. 365 by Whole Foods Market Organic Matcha Powder

Rating: ★★★★☆ (4.2/5 from 900+ reviews)

Diet Type: USDA Organic, Vegan, Kosher, Gluten-Free

If you’re going through matcha fast, this is your best-value bulk buy. The 365 by Whole Foods Market matcha is finely ground from whole green tea leaves and comes in a generous 5-ounce pouch. It’s not as bright or frothy as ceremonial options, but it’s earthy, subtle, and super versatile for cooking and baking.

Perfect for:

  • Bulk matcha fans
  • Vegan and gluten-free diets
  • Budget matcha lattes, smoothies, energy bites

4. MATCHABAR Ceremonial Grade Matcha

Rating: ★★★☆☆ (3.6/5 from 50+ reviews)

Diet Type: Vegan, Zero Sugar

Their ceremonial grade powder is sourced from Japan and comes in a sleek 30g tin, ideal for whisk-and-sip moments. It’s pricier per ounce than bulk options, but you’re paying for ceremonial grade.

While it’s marketed as ceremonial, the average reviews suggest that taste or quality may vary between batches. If you’re a matcha purist, this may not be your favorite, but it’s a giftable intro tin or travel-friendly pick.

Perfect for:

  • Trendy latte lovers
  • Supporting small businesses
  • Trying ceremonial-style matcha without a huge commitment

TL;DR: My Top Picks

  • Best Overall: Encha Ceremonial Matcha
  • Best Budget: Jade Leaf Organic
  • Best for Lattes: MATCHABAR or Jade Leaf Latte Mix


Source link

23 05, 2025

First Ledger Says Not Worried about XRP Price As XRP is The Standard

By |2025-05-23T09:04:57+03:00May 23, 2025|Crypto News, News|0 Comments

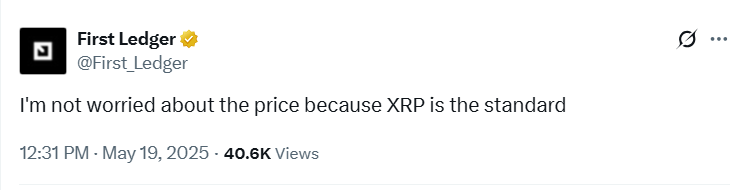
The price of XRP remains in a range-bound phase, but the team behind First Ledger is unbothered, claiming that XRP is the standard.

Notably, following its meteoric surge from late-2024 to early-2025, XRP has faced massive consolidation. Specifically, the asset rallied nearly 600% from November 2024 to a peak of $3.4 in January 2025. However, this peak introduced resistance, leading to a pullback and subsequent consolidation.

As a result, XRP has continued to trade in a range around the lower end of the $2 price level. This consolidation was initially a product of a broader market turbulence. However, despite a recent breakout that has seen Bitcoin (BTC) retest its all-time high figures, XRP maintains a low value.

Unbothered by Current Price Action

Amid this bearish connotation, the team behind First Ledger, an XRPL-based decentralized exchange platform, has indicated that they remain unbothered about XRP’s current price movements.

First Ledger Says Not Worried about XRP Price As XRP is The Standard
First Ledger on X

This recent commentary resonates with previous disclosures from community figures like Versan Aljarrah, host of The Black Swan Capitalist. Last August, while XRP languished at $0.5, Aljarrah insisted that price fluctuations are in fact distractions. According to him, they distract investors from XRP’s real value proposition.

Interestingly, other industry experts have also maintained a similar stance, but for assets such as Bitcoin. Earlier this year, specifically in January, Binance co-founder Changpeng “CZ” Zhao claimed Bitcoin price was a distraction despite earlier suggesting that 2025 could be a “send it year.”

“XRP is the Standard”

Experts like Aljarrah and CZ believe asset prices could be a distraction, as the real value lies in the technology behind the asset. Notably, the First Ledger team holds a similar sentiment. In their recent statement, they stressed that they are not concerned about current prices because XRP is the standard.

While they failed to highlight further details, previous commentaries within the XRP community suggest several proponents see XRP as the potential standard for cross-border payments. Crypto author Panos Mekras discussed this in a November 2023 comment, highlighting XRP’s ability to deliver low-cost and extremely fast transactions.

Meanwhile, within the same month, Versan Aljarrah boldly claimed that XRP’s prevalent price at the time is a price glitch, suggesting that its true value was much higher. Aljarrah also indicated that he believes this because he expects XRP to be the “global standard” for universal money.

Notably, these commentaries point to the sentiment within the community that the XRP price has the potential to reach greater levels. Pundits like BarriC have predicted that even a $100 price could mark a cheap entry point for XRP in the future. Meanwhile, CryptoGuard COO Matthew Brienen suggested XRP could reach $1,000 in ten years.

DisClamier: This content is informational and should not be considered financial advice. The views expressed in this article may include the author’s personal opinions and do not reflect The Crypto Basic opinion. Readers are encouraged to do thorough research before making any investment decisions. The Crypto Basic is not responsible for any financial losses.

Source link

23 05, 2025

XAG/USD posts monthly highs above $32.50 due to safe-haven demand

By |2025-05-23T07:16:58+03:00May 23, 2025|Forex News, News|0 Comments


  • Silver price advances due to rising safe-haven demand amid growing US fiscal concerns.
  • The safe-haven demand increases amid rising geopolitical tensions in the Middle East.
  • Ukraine will ask the European Union to seize Russian assets after President Trump pulled back from tightening sanctions.

Silver price (XAG/USD) rises to near $32.60 per troy ounce during the Asian trading hours on Thursday, gaining ground for the third successive session. Precious metals, including Silver, attract buyers amid rising safe-haven demand over growing fiscal concerns in the United States (US).

Moody’s downgraded the US credit rating from Aaa to Aa1, following similar downgrades by Fitch Ratings in 2023 and Standard & Poor’s in 2011. Moody’s also predicted that US federal debt is expected to climb to around 134% of GDP by 2035, up from 98% in 2023, with the budget deficit expected to widen to nearly 9% of GDP. This deterioration is attributed to rising debt-servicing costs, expanding entitlement programs, and falling tax revenues.

Additionally, the ongoing geopolitical unrest in the Middle East dampens the risk sentiment and drives investors toward safe-haven assets like Silver. However, Prime Minister Benjamin Netanyahu said that Israel would charge ahead with a military campaign to gain total control of Gaza, in the event of, failure of the return of hostages. Reuters cited the Israeli military as saying to let 100 aid trucks into the Gaza Strip on Wednesday, as UN officials reported that distribution issues had meant that no aid had so far reached people in need.

Next week, Ukraine is set to ask the European Union (EU) to seize Russian assets and put sanctions on some buyers of Russian Oil. As President Trump backed off from tightening sanctions, Ukraine will present an unreported white paper to the EU, asking 27-member countries to take an independent position on sanctions.

Silver FAQs

Silver is a precious metal highly traded among investors. It has been historically used as a store of value and a medium of exchange. Although less popular than Gold, traders may turn to Silver to diversify their investment portfolio, for its intrinsic value or as a potential hedge during high-inflation periods. Investors can buy physical Silver, in coins or in bars, or trade it through vehicles such as Exchange Traded Funds, which track its price on international markets.

Silver prices can move due to a wide range of factors. Geopolitical instability or fears of a deep recession can make Silver price escalate due to its safe-haven status, although to a lesser extent than Gold’s. As a yieldless asset, Silver tends to rise with lower interest rates. Its moves also depend on how the US Dollar (USD) behaves as the asset is priced in dollars (XAG/USD). A strong Dollar tends to keep the price of Silver at bay, whereas a weaker Dollar is likely to propel prices up. Other factors such as investment demand, mining supply – Silver is much more abundant than Gold – and recycling rates can also affect prices.

Silver is widely used in industry, particularly in sectors such as electronics or solar energy, as it has one of the highest electric conductivity of all metals – more than Copper and Gold. A surge in demand can increase prices, while a decline tends to lower them. Dynamics in the US, Chinese and Indian economies can also contribute to price swings: for the US and particularly China, their big industrial sectors use Silver in various processes; in India, consumers’ demand for the precious metal for jewellery also plays a key role in setting prices.

Silver prices tend to follow Gold’s moves. When Gold prices rise, Silver typically follows suit, as their status as safe-haven assets is similar. The Gold/Silver ratio, which shows the number of ounces of Silver needed to equal the value of one ounce of Gold, may help to determine the relative valuation between both metals. Some investors may consider a high ratio as an indicator that Silver is undervalued, or Gold is overvalued. On the contrary, a low ratio might suggest that Gold is undervalued relative to Silver.


Source link

23 05, 2025

USD/JPY Forecast: Dollar-Yen Remains Bearish as Price Slides Below 144.00

By |2025-05-23T07:15:42+03:00May 23, 2025|Forex News, News|0 Comments

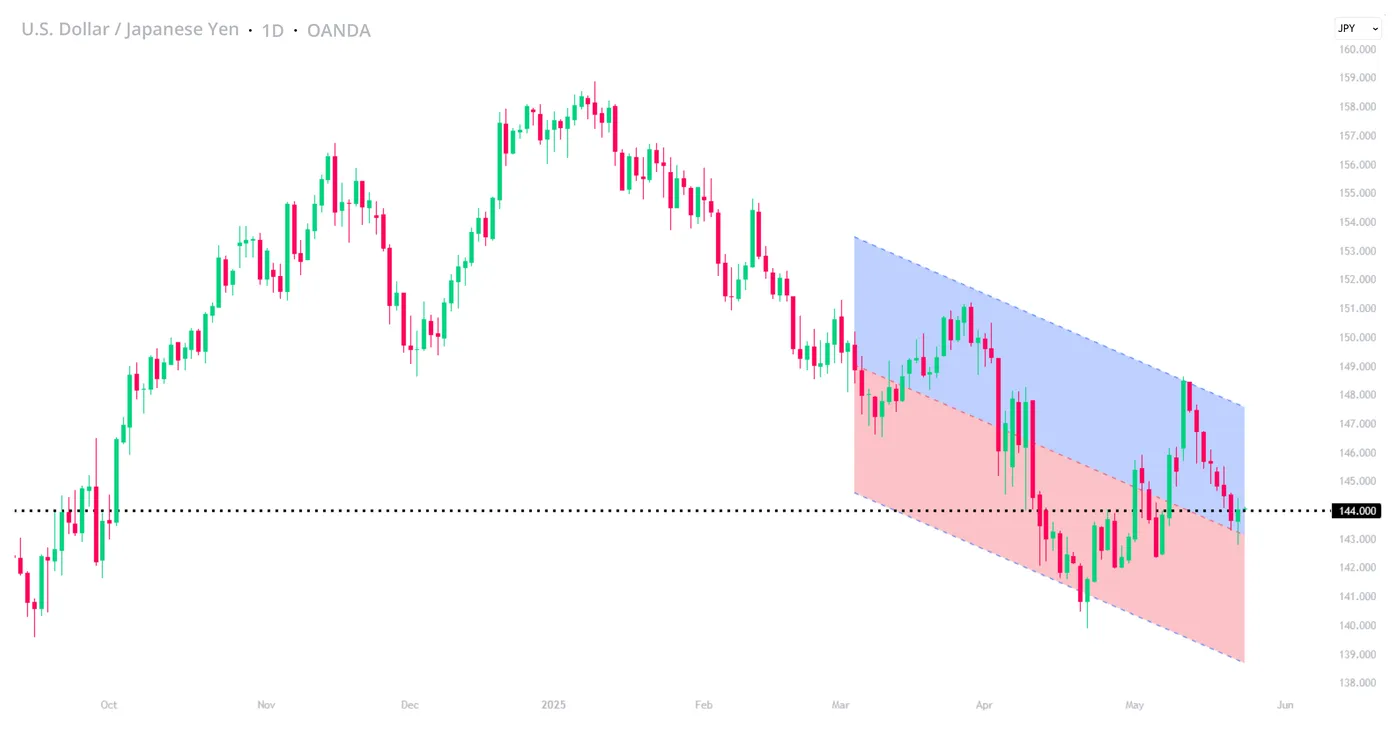
In today’s session, USD/JPY trades 0.03% higher, having fallen below the key level of 144.000 courtesy of a weaker dollar, increased safe-haven demand, and a narrowing interest rate differential.

USD/JPY Key Takeaways

  • Primarily due to a fall in dollar value, USD/JPY currently trades at around ~144.058, representing two-week lows for the currency pair
  • Renewed tariff fears, geopolitical tensions, and general uncertainty on the US economy are allowing the Japanese yen to strengthen against the U.S. dollar

USD/JPY: Yen benefits from renewed safe-haven flows

With global equities somewhat wobbly this week, markets have made a notable shift towards yen strength, renewing demand for typical safe-haven assets.

Compounded by a credit rating downgrade on U.S. sovereign debt last week, nervousness surrounding US trade policy and the latest developments on Trump’s ‘big, beautiful’ tax bill have done little to calm market nerves, with questions rising on how the current administration will address a ballooning US deficit and rising interest costs.

At least in part, the outcome has been a weaker dollar, with USD/JPY trading around ~1.09% lower in this week’s trading.

USD/JPY: Tide turning on Japanese bond yields

Snoynmous with ultra-low interest rates for the best part of 20 years, the Bank of Japan’s change in monetary policy, bookmarked by the appointment of Kazuo Ueda, represents a profound shift in perception for the Japanese economy, and by extension, the yen.

At least one outcome has been rising Japanese bond yields, with longer-dated treasuries gaining value massively under the new monetary policy outlook. Recently, the 30-year yield hit a 25-year high of ~3.2%, while the 40-year yield reached over ~3.5%, its highest point since inception in 2007.

With the differential between US and Japanese treasuries becoming increasingly narrow, the dollar is becoming less attractive to hold, especially when considering the stark difference in current predictions on future monetary policy of the Fed and the Bank of Japan, respectively.

Worsened by a continuing unwinding of the infamous yen carry trade, any further reduction in the yield differential between US and Japanese treasuries will likely encourage further USD/JPY downside.

USD/JPY: Increased US rate cut bets weaken dollar-yen exchange rate

With markets currently pricing in two Fed rate cuts and one Bank of Japan rate hike before year-end, the attractiveness of holding the dollar over the yen, at least by some metrics, is set to be reduced.

While the latest US data shows inflation cooling faster than first predicted, Japanese inflation remains stubborn, further cementing current monetary policy predictions.

Further commitment to this narrowing interest rate differential trajectory, whether in policy decisions or general commentary, will likely lead to further USD/JPY downside.

A chart showing the recent price action of USD/JPY. OANDA,TradingView, 22/05/2024

USD/JPY technical analysis

  • Breaking a 6-day losing streak in today’s session, USD/JPY remains bearish at a technical level. Decisively breaking the key level of 145.000 earlier this week, bears will likely target previous lows at ~142.384 in price breaks down further

Source link

Go to Top