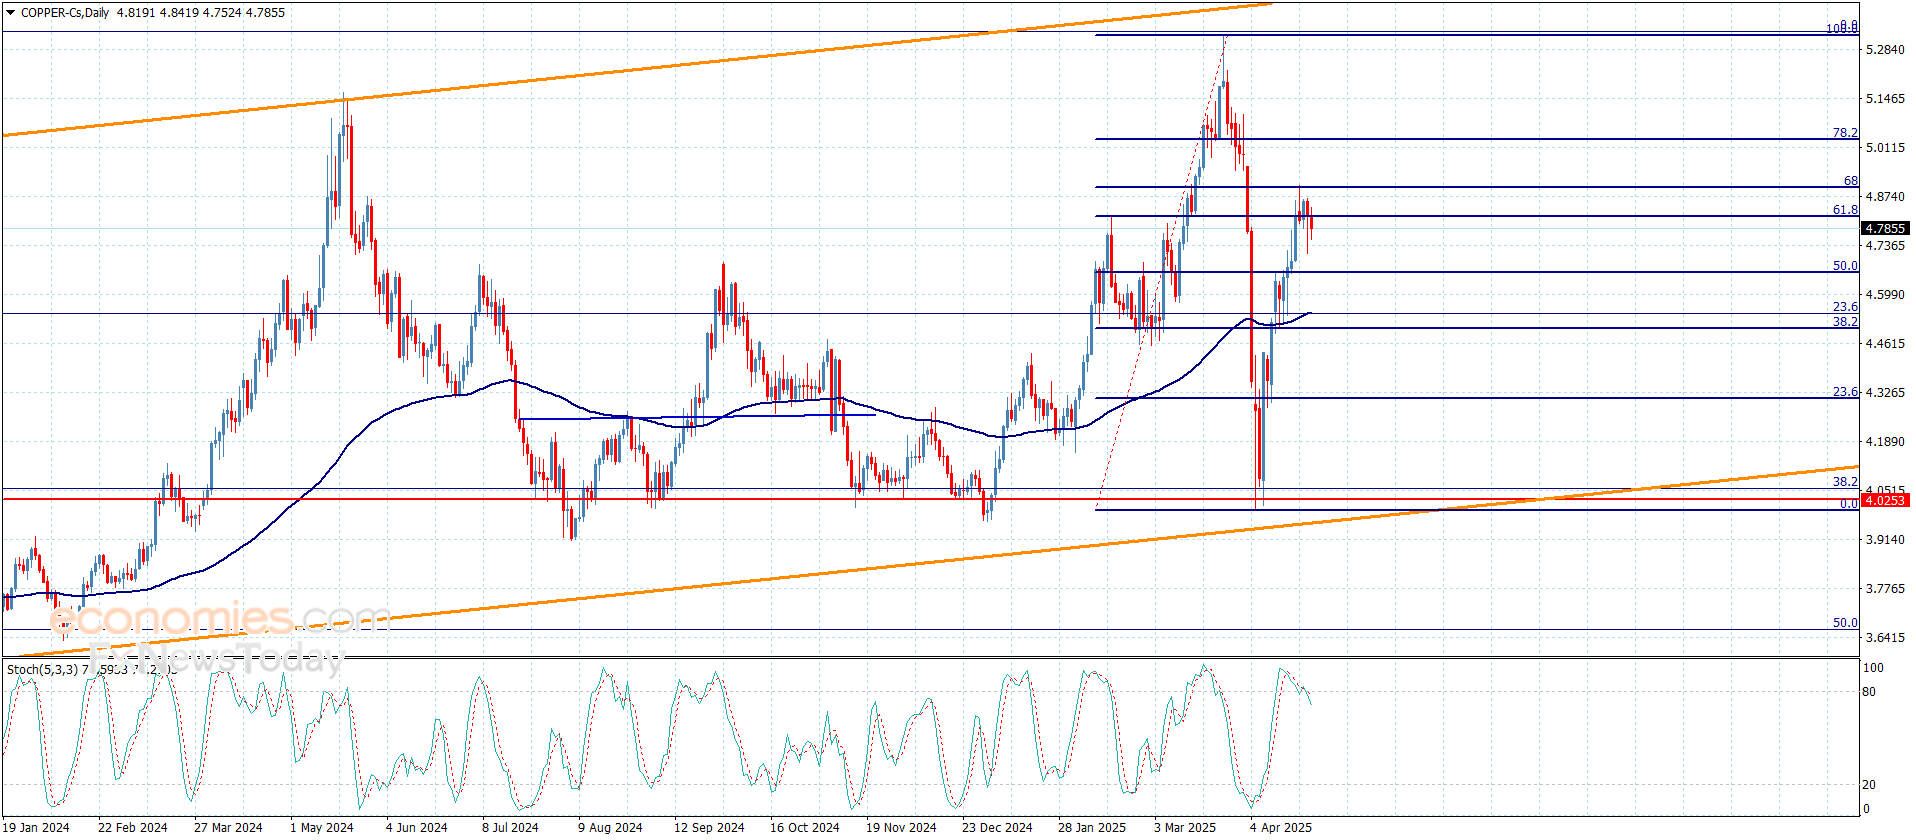
Copper price provided slow trading recently, due to the contradiction between the main indicators, to delay the negative attack and settles near $4.7500 level, reminding you that the bearish scenario will remain valid by the continuation of forming main barrier at $4.9100 against the current trading, which increases the chances for forming bearish waves to press on 50%Fibonacci correction level at $4.6600, and breaking it will extend the losses towards $4.5600, to face the moving average55.
The price rally above the mentioned barrier and holding above it, will confirming delaying the negative attack, and provide chances for recording some extra gains before reaching the previously waited negative targets.
The expected trading range for today is between $4.6600 and $4.8400
Trend forecast: Bearish
Do you need help in trading decisions? Do you want to learn how to start trading?
Join Economies.com VIP Club and benefit from over 15 years of market analysis expertise and get:
Full coverage of commodities such as gold, oil, silver, and more
Full coverage of all major forex currency pairs
Full coverage of key global indices and stocks
Full coverage of major cryptocurrencies and meme coins
Accurate analysis and daily updated price forecasts
Exclusive and breaking news
Reliable trading ranges for effective risk management
Comprehensive educational materials, competitions and prizes!
Innovative tools to enhance your trading performance
Special Offer: Subscribe to the Economies.com VIP channel and get also a free subscription to a trusted trading signals channel provided by Best Trading Signal.
Copper price provided slow trading recently, due to the contradiction between the main indicators, to delay the negative attack and settles near $4.7500 level, reminding you that the bearish scenario will remain valid by the continuation of forming main barrier at $4.9100 against the current trading, which increases the chances for forming bearish waves to press on 50%Fibonacci correction level at $4.6600, and breaking it will extend the losses towards $4.5600, to face the moving average55.
The price rally above the mentioned barrier and holding above it, will confirming delaying the negative attack, and provide chances for recording some extra gains before reaching the previously waited negative targets.
The expected trading range for today is between $4.6600 and $4.8400
Trend forecast: Bearish
Do you need help in trading decisions? Do you want to learn how to start trading?
Join Economies.com VIP Club and benefit from over 15 years of market analysis expertise and get:
Full coverage of commodities such as gold, oil, silver, and more
Full coverage of all major forex currency pairs
Full coverage of key global indices and stocks
Full coverage of major cryptocurrencies and meme coins
Accurate analysis and daily updated price forecasts
Exclusive and breaking news
Reliable trading ranges for effective risk management
Comprehensive educational materials, competitions and prizes!
Innovative tools to enhance your trading performance
Special Offer: Subscribe to the Economies.com VIP channel and get also a free subscription to a trusted trading signals channel provided by Best Trading Signal.
New York, NY – April 28, 2025 – Global Women’s Health and Beauty Supplements Market size is expected to be worth around USD 91.1 Billion by 2033 from USD 55.4 Billion in 2023, growing at a CAGR of 5.1% during the forecast period from 2024 to 2033.
Key factors contributing to this growth include rising disposable incomes, heightened awareness of nutritional deficiencies among women, and the proliferation of online retail channels. Vitamins remain the dominant product category, accounting for a significant share of the market.
Regionally, North America led the market with a substantial share in 2023, while the Asia-Pacific region is anticipated to exhibit the fastest growth due to increasing urbanization and health awareness. The 31–50 age group represents the largest consumer segment, emphasizing the demand for supplements that support hormonal balance, skin health, and overall well-being.
Prominent industry players include Herbalife International, Nestlé, Pfizer Inc., GNC Holdings Inc., Bayer AG, Nature’s Bounty Co., and Blackmores. These companies are focusing on innovation and expanding their product portfolios to meet the evolving needs of health-conscious women worldwide. The market’s trajectory underscores a sustained demand for health and beauty supplements tailored to women’s unique physiological needs, indicating promising opportunities for stakeholders in the coming years.
Key Takeaways
Market Size: The Women’s Health and Beauty Supplements Market is projected to reach approximately USD 91.1 billion by 2033, increasing from USD 55.4 billion in 2023.
Market Growth: The market is anticipated to grow at a compound annual growth rate (CAGR) of 5.1% during the forecast period from 2024 to 2033.
Product Analysis: Vitamins continue to dominate the product segment, contributing 32.8% of the overall market share.
Application Analysis: The Women’s Health application segment leads the market, accounting for 64.2% of the total market share.
Age-Group Analysis: Consumers aged between 31 and 50 years represent the largest demographic, holding the majority share in the market.
Consumer Group Analysis: The postmenopause consumer group remains the leading segment, capturing 26.6% of the total market share.
Sales Channel Analysis: Online sales channels dominated the distribution landscape in 2023, accounting for approximately 38% of the overall market share.
Regional Analysis: North America maintained the largest regional share in 2023, contributing 38.7% to the global Women’s Health and Beauty Supplements Market.
Women’s Health and Beauty Supplements Statistics
General Usage: Approximately 76% of women in the United States use dietary supplements, illustrating a significant reliance on these products for daily health management.
Most Popular Supplement: Multivitamins stand as the most frequently consumed supplement among women, indicating a broad focus on general health maintenance.
Vitamin D and Omega-3s: Over 58% of women incorporate Vitamin D and omega-3 fatty acids into their regimen, supporting bone health and cardiovascular wellness.
Calcium for Bone Health: Calcium is utilized by 39% of women, reflecting its importance in bone density and health.
Vitamin C Consumption: Around 31% of women take Vitamin C, primarily for its immune-boosting properties.
Energy and Metabolism: B vitamins are used by 29% of women to aid energy production and metabolic processes.
Iron Supplements: 22% of women use iron supplements to prevent anemia, especially crucial for women of reproductive age.
Digestive Health: Probiotics are taken by 18% of women, indicating a focus on digestive health and gut function.
Muscle and Nerve Support: Magnesium is used by 12% of women to assist with muscle and nerve functions.
Herbal Supplements: Herbal supplements like echinacea and garlic are utilized by 9% of women, often for their immune-supportive properties.
Antioxidant Intake: Green tea supplements, used by 7% of women, are chosen for their antioxidant benefits.
Plant-based Omega-3s: About 5% of women opt for flaxseed and similar plant-based sources of omega-3s, aligning with vegetarian or vegan dietary choices.
Amino Acids: Amino acid supplements are included in the diets of 4% of women, supporting various aspects of physiological health.
Joint Health: Glucosamine is taken by 3% of women, primarily for its benefits to joint health and mobility.
Heart Health and Energy: Coenzyme Q10 is used by 2% of women, known for its heart health benefits and energy enhancement capabilities.
US Tariff Impact on Women Health and Beauty Supplements Market
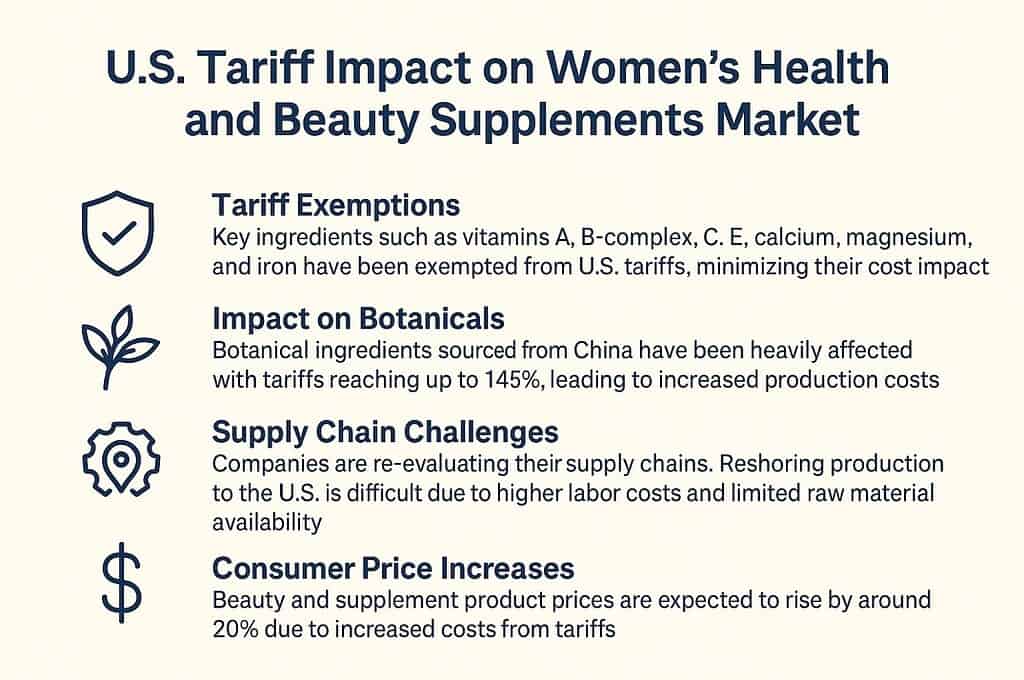
Exemptions for Key Ingredients: The U.S. administration has exempted several essential dietary supplement ingredients from the newly imposed tariffs. These exemptions include vitamins A, B-complex, C, E, Coenzyme Q10, choline, and various minerals such as calcium, magnesium, and iron. This decision aims to mitigate potential cost increases for products relying on these components, which are fundamental to many women’s health and beauty supplements.
Impact on Botanical Ingredients: In contrast, botanical ingredients, particularly those sourced from China, have been subjected to substantial tariff increases, with rates reaching up to 145%. Given that China is a primary supplier of many botanical extracts used in supplements, this escalation has led to increased production costs and supply chain disruptions. The reliance on Chinese botanicals poses a significant challenge, as alternative sources may not be readily available or may come at higher costs.
Supply Chain and Manufacturing Challenges: The tariffs have prompted companies to reassess their supply chains and manufacturing strategies. While some consider reshoring production to the U.S., this approach faces obstacles such as higher labor costs and limited availability of certain raw materials domestically. Additionally, the need to comply with regulatory standards adds complexity to shifting production locations.
Consumer Price Implications: The increased costs associated with tariffs on certain ingredients and packaging materials are likely to be passed on to consumers. Estimates suggest that beauty and skincare products may experience price hikes of approximately 20%, affecting affordability and potentially altering consumer purchasing behaviors.
Strategic Responses by Industry Players: In response to the evolving trade landscape, companies are exploring strategies such as diversifying supplier bases, investing in domestic production capabilities, and reformulating products to utilize tariff-exempt ingredients. These measures aim to maintain product availability and manage costs in the face of ongoing trade uncertainties.
Women’s Health and Beauty Supplements Product Analysis
Vitamins: Essential for overall health, vitamins like Vitamin C are pivotal for skin health and the prevention of oxidative stress. Regular intake can support immune function and, in the case of Vitamin C, potentially reduce the risk of cataract formation.
Minerals: Calcium supplements are integral for bone health, particularly important in women prone to osteoporosis. It’s essential to choose the right type of calcium (e.g., calcium carbonate vs. calcium citrate) to enhance absorption and effectiveness.
Enzymes: Enzymes in supplements can aid digestion and metabolism, helping to break down foods into absorbable nutrients, thus supporting overall digestive health and nutrient utilization.
Botanicals: Botanical supplements include a variety of herbs and natural extracts, which can provide tailored benefits such as hormonal balance, improved skin health, and stress reduction. However, it’s important to approach these with caution due to the variability in research support for long-term safety and efficacy.
Proteins: Protein supplements, particularly those based on collagen, support skin elasticity and joint health. They play a critical role in maintaining muscle mass, which is crucial for metabolic health and aging.
Omega-3: Omega-3 fatty acids are crucial for cardiovascular health, brain function, and reducing inflammation. These supplements are particularly beneficial for heart health and cognitive maintenance as women age.
Probiotics: These supplements are beneficial for gastrointestinal health, supporting the gut microbiome, which in turn impacts overall health, immunity, and even mental well-being.
Others: This category can include specialized supplements like antioxidants, which protect against cellular damage and support overall health maintenance. They can range from coenzyme Q10 to selenium, each with specific roles in protecting cells and supporting body functions.
Segmentation Analysis
Product Analysis: In 2023, the Women’s Health and Beauty Supplements Market is segmented into vitamins, minerals, enzymes, botanicals, proteins, omega-3, probiotics, and others. Vitamins lead the market, accounting for 32.8% share, due to their critical role in overall health maintenance and deficiency management. Minerals, essential for bone strength and immunity, follow. Botanicals are increasingly popular for natural therapies. Enzymes, proteins, omega-3, and probiotics are steadily growing, supported by their benefits for digestion, muscle strength, heart health, and gut balance.
Application Analysis: The market is categorized into Women’s Health and Beauty applications. Women’s Health dominates with 64.2% share, driven by demand for supplements that promote hormonal balance, reproductive health, and general wellness. Preventive healthcare awareness further strengthens this segment’s leadership. Meanwhile, the Beauty segment, covering skincare, hair, and nail health supplements, is growing steadily. Rising self-care trends and natural beauty solutions fuel its expansion, although Women’s Health continues to command a broader, more comprehensive appeal across global consumer groups.
Age-Group Analysis: The Women’s Health and Beauty Supplements Market is segmented into four age groups: 15–30 years, 31–50 years, 51–70 years, and above 70 years. The 31–50 years group holds the largest market share. Women in this demographic prioritize supplements addressing aging signs, hormonal changes, and energy levels. The 15–30 years group follows, fueled by beauty-focused consumption influenced by social media. Demand among women aged 51–70 years focuses on bone health and menopause care, while 70+ consumers represent a niche longevity-focused segment.
Consumer Group Analysis: The market is segmented by consumer groups: prenatal, PMS, perimenopause, and postmenopause. The postmenopause group leads, holding 26.6% of the total share. This is driven by the rising need to manage bone density, hormonal balance, and cardiovascular health. The prenatal segment is expanding, with increasing supplement use for healthy pregnancies. PMS and perimenopause segments capture growing attention, addressing hormonal imbalances and related symptoms. Postmenopausal women continue to drive major demand due to an emphasis on aging wellness and preventive care.
Sales Channel Analysis: Sales channels in the Women’s Health and Beauty Supplements Market include Online, Direct Sales, Pharmacies/Drug Stores, and Other Offline Channels. Online sales dominate, accounting for approximately 38% share in 2023, supported by high internet access, product variety, and convenience. Pharmacies/Drug Stores follow with 30%, valued for trust and expert guidance. Direct Sales hold 20%, driven by loyalty programs and personalized services. Other Offline Channels, including supermarkets and specialty stores, represent 12%, maintaining traditional buying habits among specific consumer groups.
Regional Analysis
In 2023, North America accounted for 38.7% of the global Women’s Health and Beauty Supplements Market. This dominant position can be attributed to high levels of consumer awareness and a strong demand for health and beauty supplements. A well-developed supplement industry infrastructure has further supported the region’s leadership within the market.
Preventive healthcare has remained a key focus, with an increasing number of women adopting supplements to support hormonal balance, bone health, and skin health. The rising preference for natural and organic products has contributed significantly to market expansion. Additionally, the widespread availability of supplements through e-commerce and online retail channels has enhanced product accessibility, driving continuous demand across the region.
The presence of leading industry players, coupled with ongoing innovations in supplement formulations, has further strengthened North America’s market position. As women increasingly prioritize proactive health and beauty management, it is expected that North America will continue to maintain its dominant role, driven by both consumer demand and advancements within the supplement industry.
Emerging Trends
Inclusive Beauty Products: The beauty industry is increasingly embracing global diversity. Expect to see more companies incorporating globally-sourced, natural ingredients that cater to a variety of skin tones and types. This includes products with ingredients like fermented rice water, bamboo extract, and African black soap, which address specific skin concerns across different demographics.
Clean Label Supplements: There is a growing trend towards supplements that offer transparency regarding their ingredients. Women are seeking products with fewer synthetic ingredients and more natural, easily recognizable substances, reflecting a broader demand for transparency in labeling and sourcing.
Targeted Supplements for Menopause: The focus on women’s specific health stages, such as menopause, is increasing. Supplements aimed at alleviating menopausal symptoms are becoming more prevalent, backed by scientific research that addresses women’s health needs during this phase.
Adaptogens in Nutrition: Adaptogens, which are herbs and roots that help the body resist stressors, are gaining popularity. Women’s health supplements are incorporating adaptogens like ashwagandha and turmeric due to their benefits in reducing stress and improving overall well-being.
Personalized Nutrition: There is an uptick in personalized nutritional supplements tailored to individual health needs and genetic profiles. This approach ensures that supplements specifically address the unique dietary needs and health conditions of women at different life stages
Increased Focus on Bone and Joint Health: Supplements that support bone density and joint health are in higher demand, especially among aging populations. Ingredients like vitamin D and calcium are staples, with innovations focusing on enhanced absorption and efficacy.
Expanded Use of Probiotics: Probiotics are becoming more common in women’s health supplements, with a focus on supporting digestive and immune health. These are particularly marketed towards women looking to improve gut health and overall wellness.
Sustainability in Supplement Packaging: There is a significant move towards sustainable practices in the production and packaging of health supplements. Women consumers are increasingly drawn to brands that demonstrate environmental responsibility in their packaging and sourcing.
Use Cases
Improving Skin Health and Elasticity: Collagen peptides are widely used in beauty supplements to improve skin elasticity and hydration. They help reduce wrinkles and promote a youthful appearance.
Supporting Bone Health: Supplements containing calcium and vitamin D are essential for maintaining bone health, particularly for women at risk of osteoporosis. These supplements help enhance bone density and reduce the risk of fractures.
Enhancing Joint Health: Collagen supplements are also beneficial for joint health by maintaining the integrity of cartilage, which is crucial as women age and joint wear increases.
Hair and Nail Growth: Biotin, a common component in beauty supplements, supports the health and growth of hair and nails, making them stronger and less prone to splitting or breakage.
Boosting Immune Health: Vitamin C supplements are popular for their immune-boosting properties. Regular intake can help enhance the immune system’s response against pathogens.
Pregnancy and Reproductive Health: Folic acid is crucial for women of childbearing age, reducing the risk of fetal development issues and supporting overall reproductive health.
Weight Management: Some supplements can aid in weight management by providing essential nutrients that support a healthy metabolism and help maintain normal body weight.
Menopausal Support: Supplements geared towards menopausal women often contain ingredients like black cohosh and soy isoflavones, which can help manage symptoms such as hot flashes and night sweats.
Conclusion
The Women’s Health and Beauty Supplements Market is poised for sustained growth, driven by rising disposable incomes, greater health awareness, and the expansion of online sales channels. Vitamins dominate the product segment, while women aged 31–50 years represent the largest consumer group. North America holds the leading regional share, with the Asia-Pacific region emerging rapidly.
Innovation, clean-label demand, and personalized nutrition are shaping future trends. The increasing focus on hormonal balance, skin health, and preventive care highlights strong opportunities for industry stakeholders. The market’s trajectory indicates a promising future, supported by evolving consumer needs and scientific advancements.
Discuss your needs with our analyst
Please share your requirements with more details so our analyst can check if they can solve your problem(s)
Solana builds momentum with rising social buzz, DEX volumes, and open interest, setting sights on the $170 target.
Solana’s momentum is picking up pace, fueled by a rise in social activity, surging DEX volumes, and stronger technical signals. As excitement builds, the focus is shifting toward the $170 Solana price prediction, with recent breakouts adding real weight to the outlook.
Solana Heads to 2nd in Crypto Social Rankings
Solana has quietly moved up to the second spot in crypto social discussions. According to LunarCrush data, $SOL has climbed to the 2nd spot in crypto social dominance, sitting right behind Bitcoin. That is a major milestone for a project that has been battling both market volatility and competition.
Solana rises to 2nd in crypto social dominance, matching Ethereum’s buzz with a 7.55% share. Source: LunarCrush via X.
A spike in social buzz often hints at growing attention, which often has a positive impact on the price activity. With Solana sharing the same 7.55% social dominance as Ethereum, it’s clear the community and institutions around SOL are heating up.
SOL Extends Its DEX Activity Momentum
Following its surge in social conversations, Solana’s strength is now showing up in the numbers, too.
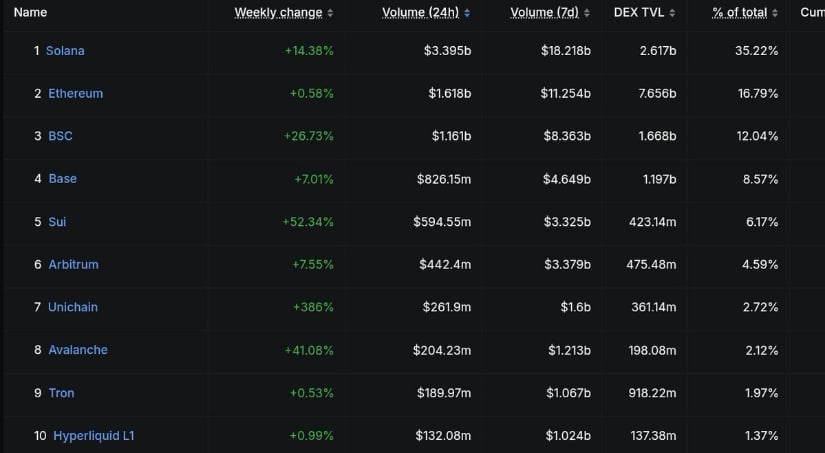
Solana Dominates DEX Volume with $3.39B in Daily Activity. Source: The Solana Post via X.
Over the last 24 hours, Solana has taken a commanding lead in decentralized exchange (DEX) volume, pulling in more than double the activity of Ethereum. With over $3.39 billion in daily volume and a strong 14% weekly growth, Solana is not just trending, it’s clearly moving liquidity. While markets remain dynamic, this steady pickup in usage could be an encouraging sign for SOL Solana price.
Solana Price Pridiction: Eyes on the $170+ Target
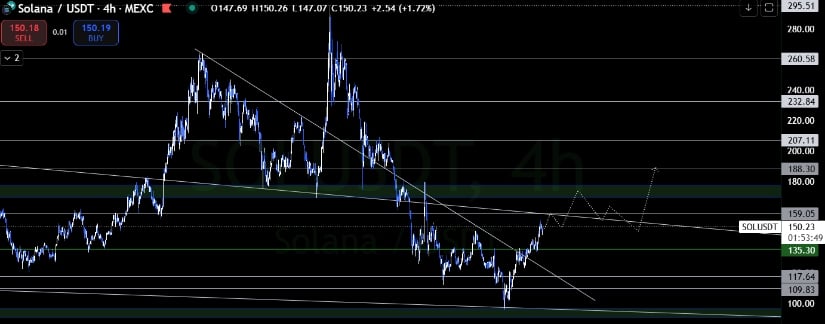
After a strong showing in social buzz and DEX volumes, Solana’s price action is starting to reflect the shift in sentiment, too. As highlighted by analyst Christiaan, on the 4-hour chart, SOL has cleanly broken out of a long-standing descending trendline, reclaiming key support levels around $147 to $150. Momentum indicators are tilting bullish, and with volume stepping in, the path towards the $170+ zone looks increasingly reasonable if current conditions hold.
Solana Targets $170+ as Technicals Align for Continued Upside. Source: Christiaan via X.
That being said, it’s not just a straight line up. Christiaan also notes that some resistance could still come in around the $155 to $160 range, where the previous structure sits. But if SOL can flip that area into support, then the $170+ Solana price prediction looks well within reach. With technicals aligning alongside rising ecosystem strength, the likelihood of a sustainable breakout remains high.
On-Chain Activity Soars Amid Breakouts
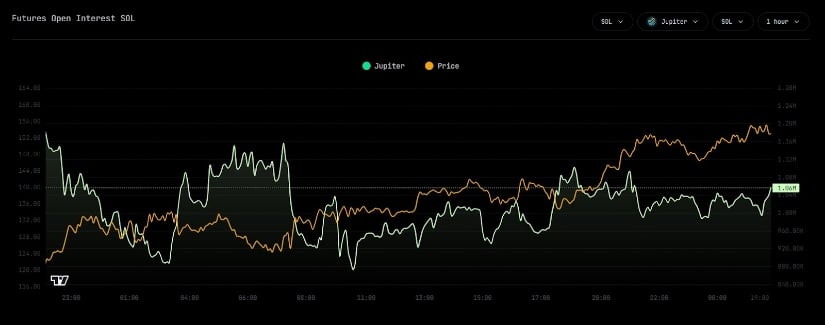
Solana’s growing strength isn’t just playing out in spot markets. Fresh data from Ranger Finance shows that open interest (OI) for $SOL on Jupiter Exchange has been steadily climbing, even as price action remains choppy. A consistent rise in open interest, particularly during sideways or volatile conditions, suggests that traders are gearing up for a bigger move ahead. It reflects increasing conviction, even if the market hasn’t yet decided its next clear direction.
Solana futures open interest climbs. Source: Ranger Finance via X.
What makes this development even more compelling is how it lines up with Solana’s broader momentum. After climbing to the second spot in crypto social discussions and taking the lead in DEX volumes, this steady rise in open interest now adds another layer of confirmation. If SOL maintains this momentum, it could further support the ongoing Solana Price Prediction toward the $170 zone, matching the bullish setup already emerging across higher timeframes.
Solana Technical Analysis
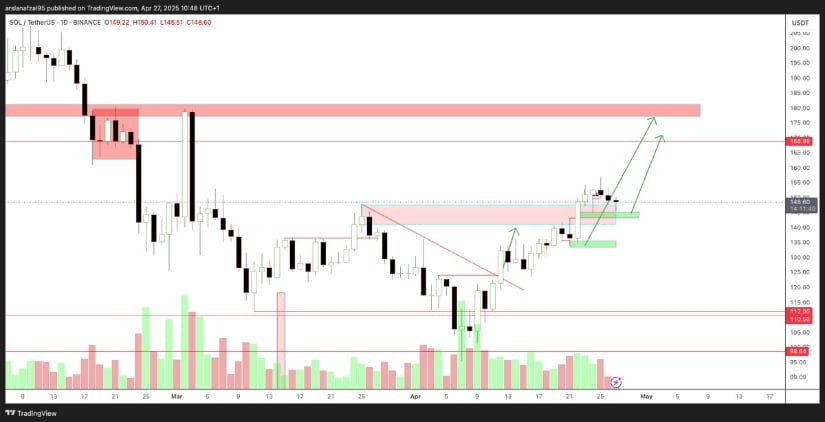
Solana continues to show constructive price action, with its daily chart printing a clear series of higher highs and higher lows. After breaking through key resistance around $138, SOL is now retesting the breakout area, holding firmly above it with healthy volume backing the move. This kind of orderly retest often strengthens the bullish case, suggesting buyers are still active even after the initial surge.
Solana holds above key breakout zone with bullish structure intact, aiming for $155–$170 target. Source: SCryptoTrader via X
According to analysis by crypto analyst SCryptoTrader, the current structure points toward a continuation move if support around $145 holds. Immediate targets lie around the $155 to $160 zone, but the broader Solana Price Prediction still leans towards a push into the $168 to $170 range, where previous supply pressure exists. As long as SOL maintains this bullish market structure, the path of least resistance appears to be higher.
Final Thought
Solana’s recent performance shows it is building momentum across multiple fronts. From social buzz to rising DEX volumes and open interest growth, SOL is ticking many of the right boxes that typically precede stronger moves.
As the broader Solana Price Prediction leans toward the $170 mark, the market still needs to see SOL firmly clear the $155 to $160 resistance before unlocking higher levels. For now, Solana is setting up a strong foundation, and if the current trend holds, it could set the stage for a more sustainable breakout ahead.
Copper price provided slow trading recently, due to the contradiction between the main indicators, to delay the negative attack and settles near $4.7500 level, reminding you that the bearish scenario will remain valid by the continuation of forming main barrier at $4.9100 against the current trading, which increases the chances for forming bearish waves to press on 50%Fibonacci correction level at $4.6600, and breaking it will extend the losses towards $4.5600, to face the moving average55.
The price rally above the mentioned barrier and holding above it, will confirming delaying the negative attack, and provide chances for recording some extra gains before reaching the previously waited negative targets.
The expected trading range for today is between $4.6600 and $4.8400
Trend forecast: Bearish
Do you need help in trading decisions? Do you want to learn how to start trading?
Join Economies.com VIP Club and benefit from over 15 years of market analysis expertise and get:
Full coverage of commodities such as gold, oil, silver, and more
Full coverage of all major forex currency pairs
Full coverage of key global indices and stocks
Full coverage of major cryptocurrencies and meme coins
Accurate analysis and daily updated price forecasts
Exclusive and breaking news
Reliable trading ranges for effective risk management
Comprehensive educational materials, competitions and prizes!
Innovative tools to enhance your trading performance
Special Offer: Subscribe to the Economies.com VIP channel and get also a free subscription to a trusted trading signals channel provided by Best Trading Signal.
Copper price provided slow trading recently, due to the contradiction between the main indicators, to delay the negative attack and settles near $4.7500 level, reminding you that the bearish scenario will remain valid by the continuation of forming main barrier at $4.9100 against the current trading, which increases the chances for forming bearish waves to press on 50%Fibonacci correction level at $4.6600, and breaking it will extend the losses towards $4.5600, to face the moving average55.
The price rally above the mentioned barrier and holding above it, will confirming delaying the negative attack, and provide chances for recording some extra gains before reaching the previously waited negative targets.
The expected trading range for today is between $4.6600 and $4.8400
Trend forecast: Bearish
Do you need help in trading decisions? Do you want to learn how to start trading?
Join Economies.com VIP Club and benefit from over 15 years of market analysis expertise and get:
Full coverage of commodities such as gold, oil, silver, and more
Full coverage of all major forex currency pairs
Full coverage of key global indices and stocks
Full coverage of major cryptocurrencies and meme coins
Accurate analysis and daily updated price forecasts
Exclusive and breaking news
Reliable trading ranges for effective risk management
Comprehensive educational materials, competitions and prizes!
Innovative tools to enhance your trading performance
Special Offer: Subscribe to the Economies.com VIP channel and get also a free subscription to a trusted trading signals channel provided by Best Trading Signal.
HTF MI recently introduced Global Matcha Market study with 143+ pages in-depth overview, describing about the Product / Industry Scope and elaborates market outlook and status (2025-2032). The market Study is segmented by key regions which is accelerating the marketization. At present, the market is developing its presence.
Major companies in Matcha Market are:
Matcha Maiden, Encha, Aiya, The Matcha Maiden, DoMatcha, Ippodo Tea, Enzo Matcha, Kiss Me Organics, Jade Leaf Matcha, Teavana, Stash Tea, Harney & Sons, Matcha Konomi, Sachi Matcha, Pure Matcha
Request PDF Sample Copy of Report: (Including Full TOC, List of Tables & Figures, Chart) @
According to HTF Market Intelligence, the Global Matcha market is projected to grow from 4.5 billion USD in 2024 to 7.5 billion USD by 2032, at a CAGR of 9.2%. from 2025 to 2032.
The following Key Segments Are Covered in Our Report
By Type
Green tea powder
By Application
Beverage, Snacks
Definition:
Matcha is a finely milled green tea powder made from high-quality shade-grown tea leaves of the Camellia sinensis plant. The process of making matcha begins several weeks before harvest when the tea plants are shaded to enhance their chlorophyll content and amino acid profiles, resulting in vibrant green leaves. After harvesting, the leaves are steamed, dried, and stone-ground into a fine powder. Unlike traditional green tea, where the leaves are steeped and discarded, matcha involves consuming the entire leaf, which maximizes its health benefits. Matcha is rich in antioxidants, particularly catechins, which are believed to support metabolism and reduce the risk of chronic diseases. Additionally, matcha contains L-theanine, an amino acid that promotes relaxation and mental clarity, making it popular among health enthusiasts and in the wellness community.
Dominating Region:
North America, Asia
Fastest-Growing Region:
Europe
Have a query? Market an enquiry before purchase 👉 👉 https://www.htfmarketreport.com/enquiry-before-buy/3620757-global-matcha-market-report-production-and-consumption-professional-analysis?utm_source=Sweety_OpenPR&utm_id=Sweety
The titled segments and sub-section of the market are illuminated below:
In-depth analysis of Matcha market segments by Types: Green tea powder
Detailed analysis of Matcha market segments by Applications: Beverage, Snacks
Global Matcha Market -Regional Analysis
• North America: United States of America (US), Canada, and Mexico.
• South & Central America: Argentina, Chile, Colombia, and Brazil.
• Middle East & Africa: Kingdom of Saudi Arabia, United Arab Emirates, Turkey, Israel, Egypt, and South Africa.
• Europe: the UK, France, Italy, Germany, Spain, Nordics, BALTIC Countries, Russia, Austria, and the Rest of Europe.
• Asia: India, China, Japan, South Korea, Taiwan, Southeast Asia (Singapore, Thailand, Malaysia, Indonesia, Philippines & Vietnam, etc) & Rest
• Oceania: Australia & New Zealand
Read Detailed Index of full Research Study at 👉 👉 https://www.htfmarketreport.com/buy-now?format=1&report=3620757-global-matcha-market-report-production-and-consumption-professional-analysis
Matcha Market Research Objectives:
– Focuses on the key manufacturers, to define, pronounce and examine the value, sales volume, market share, market competition landscape, SWOT analysis, and development plans in the next few years.
– To share comprehensive information about the key factors influencing the growth of the market (opportunities, drivers, growth potential, industry-specific challenges and risks).
– To analyze the with respect to individual future prospects, growth trends and their involvement to the total market.
– To analyze reasonable developments such as agreements, expansions new product launches, and acquisitions in the market.
– To deliberately profile the key players and systematically examine their growth strategies.
FIVE FORCES & PESTLE ANALYSIS:
In order to better understand market conditions five forces analysis is conducted that includes the Bargaining power of buyers, Bargaining power of suppliers, Threat of new entrants, Threat of substitutes, and Threat of rivalry.
• Political (Political policy and stability as well as trade, fiscal, and taxation policies)
• Economical (Interest rates, employment or unemployment rates, raw material costs, and foreign exchange rates)
• Social (Changing family demographics, education levels, cultural trends, attitude changes, and changes in lifestyles)
• Technological (Changes in digital or mobile technology, automation, research, and development)
• Legal (Employment legislation, consumer law, health, and safety, international as well as trade regulation and restrictions)
Get 10-25% Discount on Immediate purchase 👉 https://www.htfmarketreport.com/request-discount/3620757-global-matcha-market-report-production-and-consumption-professional-analysis?utm_source=Sweety_OpenPR&utm_id=Sweety
Points Covered in Table of Content of Global Matcha Market:
Chapter 01 – Matcha Executive Summary
Chapter 02 – Market Overview
Chapter 03 – Key Success Factors
Chapter 04 – Global Matcha Market – Pricing Analysis
Chapter 05 – Global Matcha Market Background or History
Chapter 06 – Global Matcha Market Segmentation (e.g. Type, Application)
Chapter 07 – Key and Emerging Countries Analysis Worldwide Matcha Market
Chapter 08 – Global Matcha Market Structure & worth Analysis
Chapter 09 – Global Matcha Market Competitive Analysis & Challenges
Chapter 10 – Assumptions and Acronyms
Chapter 11 – Matcha Market Research Method Matcha
Thanks for reading this article; you can also get individual chapter-wise sections or region-wise report versions like North America, LATAM, Europe, Japan, Australia or Southeast Asia.
HTF Market Intelligence Consulting is uniquely positioned to empower and inspire with research and consulting services to empower businesses with growth strategies, by offering services with extraordinary depth and breadth of thought leadership, research, tools, events, and experience that assist in decision-making.
Trader Tardigrade predicts Dogecoin could soon outperform Bitcoin based on repeating OBV and price patterns.
DOGECAPITAL’s cycle top indicator suggests a major peak for Dogecoin might occur by late October 2025.
Rising volume pressure and broken resistance lines hint at a bullish Dogecoin momentum against Bitcoin.
Dogecoin’s trading behavior against Bitcoin is drawing increasing attention as prominent trader Trader Tardigrade points to an emerging pattern reminiscent of its 2024 breakout.
Referring to the $DOGE/$BTC chart, Tardigrade draws attention to the parallels between current and historical On-Balance Volume (OBV) trends. Previously, when this configuration was present, DOGE far surpassed Bitcoin between October and December of 2024.
The breakdown of the chart indicates two key components. In the top part, the $DOGE/$BTC candlestick chart displays pivotal price actions.
Past rallies are colored and annotated, marking times when DOGE appreciated against Bitcoin. The characteristics of the chart include a series of higher lows and a breakout above a declining trendline, indicating strength.
Simultaneously, the lower half concentrates on the OBV indicator that monitors volume dynamics in the direction of the price trend. Tardigrade highlights the OBV rising again from 2118 to 2148, replicating the spike prior to Dogecoin’s most recent rally.
This price/volume correlation means another break could be near at hand, enough reason for traders to be on the lookout.
OBV Surge and Price Breakout Signal Possible Rally
The technical structures under discussion by Tardigrade highlight two key aspects: the violation of a longstanding declining resistance level and rising OBV.
These have traditionally led to powerful advances, especially when they’re followed by accumulation phases of sideways price movements within zones of consolidation.
The $DOGE/$BTC ratio broke sharply higher during the 2024 rally after a corresponding breakthrough, getting as high as 0.0000035 BTC before reversing. The present setup appears to mimic this scenario, and DOGE finds itself again around the crucial resistance zones. Positive OBV supports the extension of the bullish momentum, indicating that the buyers are consistently taking back the reins.
But as Tardigrade points out, the sole use of OBV sometimes gives a hasty conclusion. Cross-validation using the likes of a moving average or RSI would make the projection more credible. Yet the chart picture thus far remains decidedly bullish for Dogecoin’s short-term outlook vs. Bitcoin.
Custom Indicator Tracks Dogecoin’s Cycle Tops
Adding another angle to the bull story, analyst DOGECAPITAL offers a quite different but equally interesting take.
Using a bespoke indicator monitoring Dogecoin’s past cycle peaks, DOGECAPITAL determines recurring patterns correlated with Bitcoin’s larger market cycles. Dogecoin generally makes earlier or later cycle peaks, according to his calculations based on certain chart movements.
Within the present cycle, DOGECAPITAL indicates another top may be possible towards the later cycle stages, where the key window tightens around the period of October 27th, 2025.
History indicates this model’s consistent ability to foresee notable Dogecoin highs. Dogecoin might find itself on the cusp of another tremendous valuation boom in the coming months if history holds any significance.
Creatine is popularly taken as a supplement to improve strength, power, and the number of sets completed during exercise. It may improve physical performance, lower inflammation, and give you more energy, making your workout more efficient.
With benefits like these, you might be inclined to take creatine frequently, especially if you’re an athlete. But is it safe to do so?
Creatine is safe for short-term use. The majority of creatine-related studies only report on participants taking the supplement for five to seven days. Researchers have also found that taking creatine daily for 12 weeks can help with long-term muscle strength and growth.
Experts recommend high doses (25 grams) of creatine daily are safe for up to 14 days, while others say lower doses (4 to 5 grams) for up to 18 months are safe.
The International Society of Sports Nutrition says that it’s safe to take up to 30 grams of creatine daily for up to five years, though more long-term studies are needed to support this.
Taking creatine regularly can provide the following benefits:
Give your muscles more energy, which helps to make them larger and stronger with proper exercise and training
Improve your overall exercise performance, especially in activities that need quick bursts of energy like bodybuilding, rowing, soccer, and cycling
Help your muscles recover quicker after a workout and help you feel less sore
Bring more water into your muscle cells, helping your muscles grow and stay hydrated
Creatine isn’t just for athletes. Improving muscle strength may also be useful in older adults hoping to increase their overall well-being. Numerous studies have also shown that creatine may be useful in heart, nervous system, and mental health.
It likely doesn’t matter whether you take creatine before or after a workout. Studies have evaluated the different timings, but neither time stands out as the best option. This is most likely because your body stores creatine. As long as you consistently provide your body with the amino acid, your muscles will use it when needed.
By taking creatine often, you ensure that you constantly have enough available for use. If you are recovering from a workout, having creatine in your system may help lower soreness and heal your muscles more quickly.
Most studies found no major difference in strength and muscle size in people who only took creatine on workout days versus those who took it every day. Taking creatine only on workout days may lower costs and prevent you from consuming unnecessary amounts.
Creatine does not have many side effects. The most commonly reported creatine side effect is weight gain. However, this increase in weight only happens because creatine brings water into your muscles.
When you first start taking creatine, this increase in water (also called water retention) makes it seem like you have gained weight. This weight gain should only be temporary, and will likely go away after the first week or two of starting creatine.
Other less common side effects include the following:
If you decide a creatine supplement is right for you, it’s important to be consistent. Having creatine in your body always helps with muscle growth, energy, and recovery, whether you are working out or not. Staying well hydrated may also lower your risk of side effects.
Creatine does not interact with many medications or supplements. However, there is evidence that caffeine may lower the effectiveness of creatine.
If you begin taking creatine, talk with your healthcare provider to ensure that the supplement is safe for you, your health conditions, and any other products you may be taking.
Creatine is a popular supplement used to improve strength, power, and the number of sets completed during exercise. It can improve physical performance, lower inflammation, and give you more energy, making your workout more efficient.
There is also evidence that creatine may be useful in brain, nervous system, and heart health.
Creatine is safe to take every day and may be ideal depending on your health concerns and physical goals. It is considered safe, with a low risk of serious side effects.
It looks like Ripple’s decline is nearing its end, opening the door for a potential breakout in the XRP ETF propelled by confidence.
Skerdian Meta•Sunday, April 27, 2025•2 min read
Add an article to your Reading List
Register now to be able to add articles to your reading list.
” aria-hidden=”true”>
Quick overview
Ripple’s recent consolidation phase may be ending, with signs of a potential breakout driven by XRP ETF optimism.
After a significant rally in late 2024, XRP experienced a pullback but has recently bounced back above $2.20, indicating bullish momentum.
The launch of the world’s first XRP spot ETF in Brazil could further enhance market sentiment, with predictions of a U.S. ETF approval adding to the optimism.
Traders should monitor the $2.20–$2.50 range, as a breakout could lead to new all-time highs and possibly a target of $5.
It looks like Ripple’s decline is nearing its end, opening the door for a potential breakout in the XRP ETF propelled by confidence.
Ripple Recovery: End of the Correction Phase?
After a massive surge at the end of 2024, Ripple (XRP) has spent the early months of 2025 in a consolidation and correction phase. However, signs are emerging that the pullback might be over, with broader bullish momentum ready to resume.
Ripple’s historic rally began before Donald Trump’s return to the White House, as XRP skyrocketed from around $0.50 in November 2024 to an intraday high near $3.39 by mid-January — a gain of over 300%. This breakout was primarily driven by renewed optimism after a critical win for Ripple in its ongoing legal battle with the U.S. Securities and Exchange Commission (SEC).
Early 2025: Volatility and Market Risk-Off Sentiment
Following that peak, XRP mirrored the broader risk-off sentiment seen in global stock markets during Q1 2025. By early February, XRP/USD had slipped back below the important $2.00 level as crypto markets, along with Bitcoin (BTC), shed much of their recent gains.
Further pressure in early April saw XRP dip under $2.00 during a sharp wave of market panic. However, the 200-day Simple Moving Average (SMA) on the daily chart provided key support, stabilizing prices. As risk appetite returned, Ripple bounced back above $2.00, and yesterday buyers pushed it decisively above $2.20. This technical move now opens the pathway toward higher targets: $2.50, $3.00, and possibly a new all-time high around $3.50.
Still, buyers faced initial resistance at the 50-day SMA (yellow), which temporarily slowed momentum.
ETF Developments: Brazil Leads, Is the U.S. Next?
Adding fuel to the bullish fire is a major development: the launch of the world’s first XRP spot ETF. Hashdex and Genial Investimentos introduced the XRPH11 ETF on Brazil’s B3 exchange. Designed for experienced investors, the fund will allocate at least 95% of its assets directly into XRP, using the Nasdaq XRP Reference Price Index.
This marks Hashdex’s ninth cryptocurrency-focused ETF in Brazil, following similar products for Bitcoin (BTC), Ethereum (ETH), and Solana (SOL). With Genial Bank SA serving as custodian, XRPH11 aligns with Brazil’s increasingly crypto-friendly regulatory framework.
Meanwhile, in the United States, several firms including Bitwise and Grayscale have filed applications for XRP spot ETFs. According to the Polymarket prediction platform, there is currently a 74% probability that a U.S.-based XRP ETF will be approved sometime in 2025. Should this materialize, it would likely send another wave of buying into Ripple, possibly paving the way for XRP to rally toward the $5 mark.
Conclusion: A Bullish Setup is Forming
Ripple is at a critical technical and fundamental juncture. A resurgence in bullish sentiment, combined with ETF developments in Brazil and potential U.S. approval later this year, could provide the necessary catalysts for another major rally. Traders should closely watch the $2.20–$2.50 zone, as a break higher could ignite a fresh bullish leg targeting record highs — and possibly, the much-anticipated $5 milestone.
Ripple XRP Live Chart
XRP
Skerdian Meta
Lead Analyst
Skerdian Meta Lead Analyst.
Skerdian is a professional Forex trader and a market analyst. He has been actively engaged in market analysis for the past 11 years. Before becoming our head analyst, Skerdian served as a trader and market analyst in Saxo Bank’s local branch, Aksioner. Skerdian specialized in experimenting with developing models and hands-on trading. Skerdian has a masters degree in finance and investment.






:max_bytes(150000):strip_icc()/Health-GettyImages-ShouldYouTakeCreatineEveryday-ccca2200468144e6919793f234cfec0a.jpg "Should You Take Creatine Every Day? Here’s What to Know")