About Editorial team of BIPNs

Main team of content of bipns.com. Any type of content should be approved by us.
25 04, 2025

The Matcha Moment | 34th Street Magazine

By |2025-04-25T11:02:10+03:00April 25, 2025|Dietary Supplements News, News|0 Comments


Whether you obsess or abhor the grassy, sweet, and bitter flavor, chances are you’ve had matcha. In just a few years, matcha went from a niche import to a ubiquitous flavor in the United States, found in drinks, desserts, and more (check out this matcha rotisserie chicken). As we grew more health–conscious during the pandemic, matcha surged in popularity. Offering a healthier, caffeinated boost, it quickly emerged as the go–to wellness alternative to coffee. And unlike coffee, which has long been coded as jittery and utilitarian, matcha arrived soft, pastel, and ritualistic; packaged as a slower, more mindful kind of energy.

As a veteran café–hopper since middle school, I watched matcha—the drink I ignorantly thought was underground (my TikTok username was proudly @icedmatchalattes)—start appearing on the menus of all cafés. Now, without fail, almost every café I walk into serves matcha. Blank Street even claims it sells a matcha every four seconds. From the craze, matcha–specific chains emerged, like Cha Cha Matcha, Matcha Bar, and Matchaful. 

Matcha isn’t just a drink anymore—it’s a mood board. It lives on social media as a lifestyle statement. People don’t just love the taste, they love the aesthetic–pilates, morning matcha and green juice, journaling. It’s a wellness ritual that makes people feel like they’re taking care of their health (though delicious, I guarantee the Pret strawberry matcha latte isn’t packing many health benefits). 

Consequently, the global market for matcha reached a record high in 2024 and is expected to almost double in the next few years, from $2.8 billion in 2023 to $5 billion by 2028. 

While matcha only recently appeared in the U.S., it dates back generations ago to elite Chinese Tang Dynasty’s seventh century tea rooms, in which “brick tea” and “compressed tea” first emerged. Over time, matcha was phased out by loose–leaf green teas, which replaced powdered tea in China. However, centuries later, after studying in China, a Buddhist monk introduced matcha as an “elixir for a healthy life” in Japan, planting the seeds (literally) for what would become a cherished cultural tradition and staple.

Now, Japan is the primary grower of matcha and lead exporter for the U.S. However, with limited resources for tea farming and the sudden upshot in matcha demand, matcha trends are outpacing supply. Japanese matcha producers Marukyu Koyamaen, Ippodo Tea, and Ocha no Kanbayashi have declared purchase limits. Others have temporarily halted sales of certain matcha products. With few young people willing to take over, the tea fields are growing quiet. For many aging farmers, matcha isn’t just a crop—it’s a legacy. But in an era of rising costs and uncertain returns, that legacy is increasingly being left behind.

With that, making matcha is a timely and involved process: first, growing tencha leaves, and then, harvesting and grounding them into matcha. Tencha leaves take up to five years to mature and can only be harvested for matcha once a year. Along with this timely process, there’s a tea farmer shortage. In just the last two decades, the number of tea farmers has declined from 53,000 to 12,353 in Japan. The few that are left are aging, with no one to continue to their legacy, leaving many tea farms abandoned. Other tea farmers who don’t currently harvest matcha are not willing to make the switch; cultivating matcha is a huge investment of time and money. And, if matcha ends up being a fad, they face a huge loss. 

International markets have already felt the effect of the matcha shortage. Australian cafés claimed to have waited up to three months for new shipments from Japan. The impacts of the matcha shortage are already being felt in international markets. The Matcha Bar in Dublin experiences supplier quotas on order quantities, Australian cafés are waiting up to three months for new Japanese shipments, and Singaporean supermarkets have raised matcha product prices by up to 15%. And now, with 24% tariffs on products imported from Japan in the U.S., matcha is only going to get rarer and more expensive. 

Anticipating future withdrawals, matcha–lovers are doing “Japan Hauls,” with suitcases full of matcha products from Japan. Others are offended by the hauls, attributing the matcha shortage to creators’ overconsumption. 

But as demand skyrockets and tradition gets aestheticized, authenticity is often the first casualty. Some processes and products erupted in controversy. 

A month ago, Poda, a matcha paste, was officially launched on Kickstarter. In the founder Mujtaba Waseem’s minute–long pitch video, he mocked ceremonial Japanese matcha–making techniques, “Let’s make matcha, but we don’t need any of this crap.” The “crap,” according to him, was the chasen (bamboo whisk) and chawan (ceremonial bowl)—tools that have been used for generations. Waseem then knocks the items from the table, letting them fall onto the floor. Waseem proclaimed, “Most matcha is stale, clumpy and made in China. What if I told you there’s a better way?” His proposal is squeezable matcha paste promising an efficient and easier way to make matcha than traditional methods. 

Neither amused by the product nor his cultural commentaries, people responded angrily commenting on the paste’s untraditional “murky brown green” and how the “marketing was heinous.”

Then, Matcha Girl, a viral Houston matcha pop–up, was under scrutiny for branding their $11 matcha as “ceremonial grade” and preparing batches in advance—compromising the very quality it claimed to champion. The criticism went beyond just matcha too. The founder, Lauren Galindo, personally received non–stop hate comments and even death threats for her matcha. What began as a trendy, aesthetic brand became a place of debate on authenticity and appropriation. 

Matcha is everywhere, but its future feels uncertain. Once a centuries–old ritual, matcha has become a modern–day trend fueled by aesthetics, wellness culture, and viral moments. But as its popularity surges, so do controversies: overly–gratuitous matcha drinking,  $11 “ceremonial” lattes made in bulk, to squeezable pastes mocking tradition. Meanwhile, the global supply is under pressure—aging farmers, slow production cycles, and trade tariffs are making high–quality matcha harder to source. The more matcha becomes a lifestyle, the more it risks losing its roots. And as trends move faster than tea leaves can grow, it’s worth asking: Are we sipping on something sustainable, or just another fleeting obsession?

P.S. Three matcha lattes were drunk in the process of writing this (apologies for the shortage).



Source link

25 04, 2025

Solana Price Prediction: SOL Surges 15% as $500M Investment Sparks Institutional FOMO

By |2025-04-25T10:57:12+03:00April 25, 2025|Crypto News, News|0 Comments

Solana is back in focus after a 15% price surge, breaking past resistance at $145 after a $500M institutional investment from Sol Strategies and renewed on-chain momentum.

The Layer 1 giant has climbed nearly 15% in the past two trading sessions, sparking fresh interest across both retail and institutional circles. With technicals firming up and momentum shifting, some are beginning to wonder if a larger breakout could be forming.

Solana’s MicroStrategy Moment

Solana just got a major vote of confidence. Sol Strategies has announced a $500 million convertible note to buy into SOL. This isn’t a minor headline; it’s a clear signal of conviction in Solana’s long-term potential. As institutions start treating Solana like a core asset rather than a speculative play, this kind of move helps shift the narrative from hype to serious capital deployment.

Sol Strategies’ $500M bet on Solana signals growing institutional confidence. Source: MisterCrypto via X

MisterCrypto highlights that Sol Strategies is now the MicroStrategy of Solana. The parallels are hard to ignore. Much like how MicroStrategy reshaped institutional sentiment around Bitcoin, Sol Strategies might be doing the same for Solana.

Solana’s Price Breaks Its Downtrend

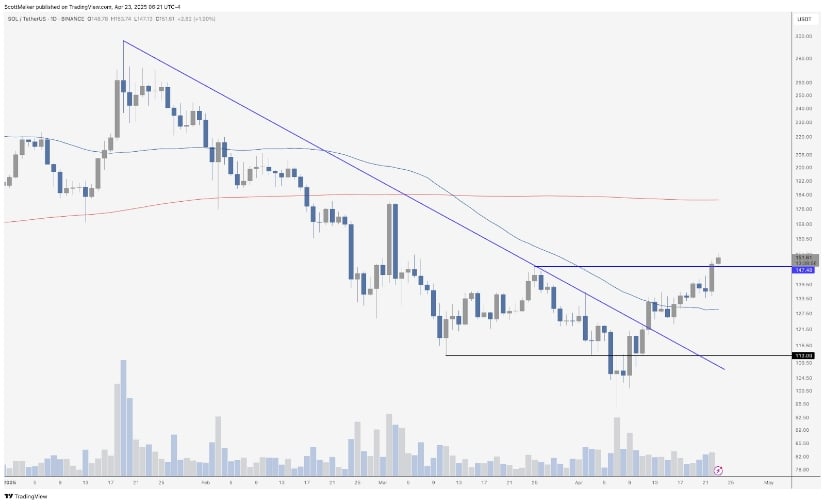
After Sol Strategies’ bold move on Solana, the technical charts also started to reflect that optimism. Scott Melker, a famous analyst, points out that Solana price has printed its first higher high since the downtrend began in January. More importantly, the falling resistance line that capped price action for months has now been decisively broken.

Solana Price Prediction: SOL Surges 15% as 0M Investment Sparks Institutional FOMO

Solana’s price breaks its downtrend as Scott Melker highlights the shift to higher highs. Source: Scott Melker via X.

According to Scott Melker, this move stands out not just because Solana printed a higher high, but because it did so with increasing volume. The previous level at $112 acted as a firm base, and now, with the breakout above $145, the market has shifted from lower lows to higher highs. As long as SOL Solana price holds above this reclaimed level, the structure favors continuation to the upside with $180 potentially back in play.

Solana’s On-Chain Strength Builds as Breakouts Align

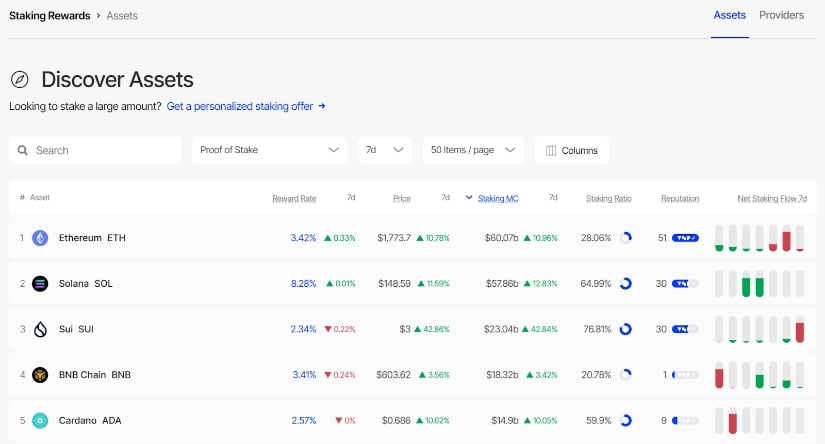
While price action and institutional interest are heating up for Solana, the on-chain activity is starting to uptick as well. Crypto analyst Jesse Peralta points out, Solana is holding its ground in the staking race with a massive $57.9 billion in staking market cap. That places it right behind Ethereum, but well ahead of most of its competitors. For a network that continues to be in the headlines for both price and progress, this staking strength adds a key layer of confidence for long-term holders.

 Jesse Peralta

Solana’s $57.9B staking strength boosts long-term outlook. Source: Jesse Peralta via X

Building on the recent breakout confirmed by Scott Melker and the $500M conviction play by Sol Strategies, Solana’s high staking market cap reflects more than just speculation. A large segment moving into token locks is reducing the circulating supply and shows confidence in the network’s future. Solana is heading in the right direction with its long-term plays.

Solana Price Prediction: Bullish Breakout Targets $320

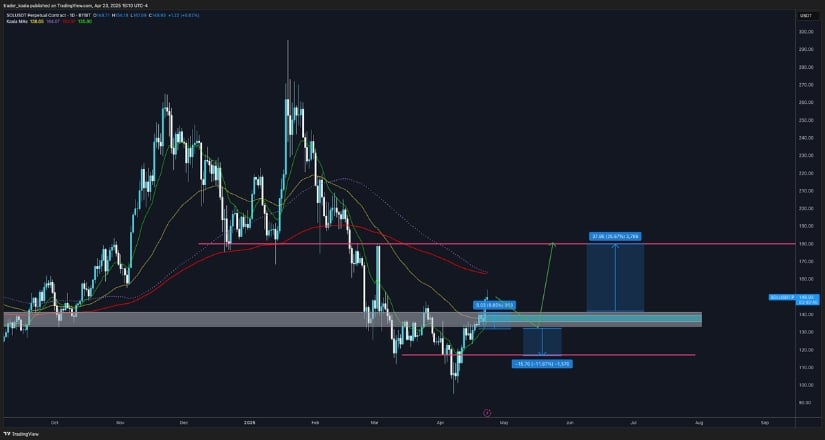
Following a breakout and strong institutional backing, Solana’s technical setup is starting to catch attention. Trader Koala outlines a strong bullish momentum on charts, with $130 and $140 as the first area of interest, with room for more towards $180, and a higher target all the way up at $320. The structure shows higher lows holding firm, and momentum building above key moving averages.

Koala

Solana’s bullish breakout shows strong momentum, with a $320 target in sight. Source: Koala via X.

This fits neatly into the broader narrative building around Solana. From Sol Strategies’ $500M investment to the breakout confirmed by Scott Melker, Solana is stacking up signals of strength. The current Solana price prediction reflects that shift in sentiment, with upside targets suggesting a potential move of 30% from recent levels.

Diverse Views: Kevin Calls For a Temporary Short-Term Dip

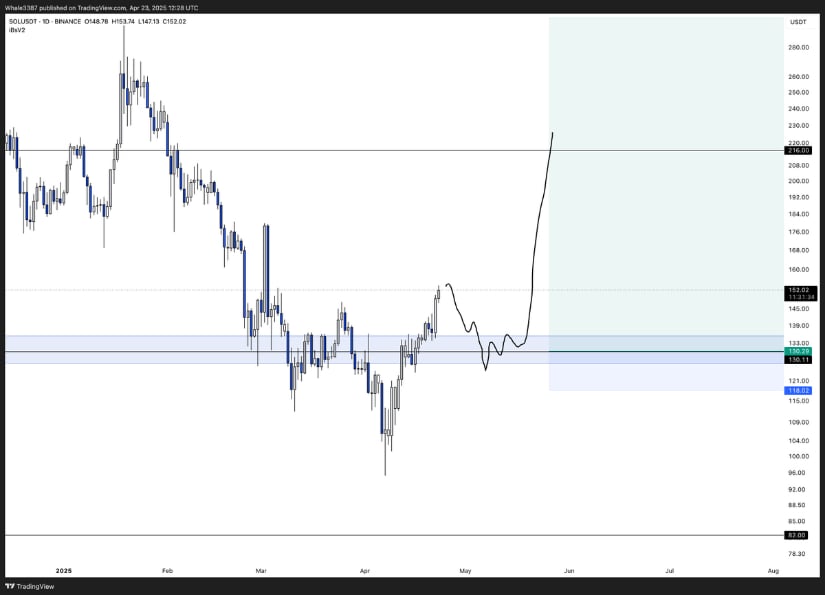
While recent sentiment around Solana has been largely bullish, not every analyst is calling for a straight shot upward. Crypto analyst Kevin offers a more cautious view, highlighting the possibility of a short-term market pullback before any major rally unfolds. His chart points to a liquidity zone just below the $130 mark, where the price could briefly dip before regaining strength.

 Kevin

Kevin warns of a short-term pullback for Solana, before a bullish run towards $230 in the longer term. Source: Kevin via X

The longer-term outlook, however, remains constructive. After the potential retracement, Kevin expects Solana to rebuild momentum toward the $200 region, with a possible move as high as $230. This projection aligns with the broader views of analysts like Koala and Scott Melker. Solana’s price prediction might show short-term divergence, but the longer-term uptrend still appears to be intact.

Final Thoughts

SOL Solana price is starting to find its footing again. This time, not just through price action, but through a broader shift in sentiment. The major bet from Sol Strategies, the break in long-standing downtrend, and the strength in staking are all pointing to growing confidence in Solana’s long-term place in the market.

That said, while analysts like Koala and Scott Melker highlight strong upside potential, others like Kevin have shown the possibility for short-term pullbacks along the way. Solana price now seems to be entering a phase where dips are becoming opportunities rather than warning signs.

Source link

25 04, 2025

XAU/USD eyes US-China trade talks and third straight weekly gain

By |2025-04-25T09:04:24+03:00April 25, 2025|Forex News, News|0 Comments


  • Gold price defends weekly gains early Friday, finding stiff resistance near $3,370.  
  • The US Dollar picks up bids on the US trade deal optimism with its Asian allies.
  • The daily technical setup remains in favor of Gold buyers, with $3,400 a key topside barrier.

Gold price holds Thursday’s rebound, defending weekly gains near $3,350 early Friday. Gold buyers catch a breather, taking stock of the trade developments globally after US President Donald Trump’s tariffs whiplash.

Gold price pauses its rebound as US Dollar rebounds

This Friday, the US Dollar (USD) sees fresh signs of life as risk sentiment remains upbeat on optimism for trade deals. Reuters reported that the Trump administration seems to be progressing in early trade talks with Asian allies South Korea and Japan.

On Thursday, Seoul’s delegation said that both sides aim to craft a trade package before the pause on reciprocal tariffs is lifted in July. Meanwhile, Japanese Finance Minister Kato Katsunobu held talks with US Treasury Secretary Scott Bessent in Washington on Thursday, noting that Bessent did not raise the Yen’s level in bilateral talks.

In evidence of further progress, Japan’s chief negotiator, Economy Minister Ryosei Akazawa, will hold a second round of trade talks with Bessent next week.

Receding recession fears, following encouraging earnings reports from American tech giants, offer some respite to the beleaguered US Dollar. Shares of Google parent Alphabet jumped over 3% in after-hours after its first-quarter earnings beat analysts’ expectations.

The resurgent US Dollar demand and trade deal hopes heading into the weekend limit the Gold price upswing. The US Federal Reserve (Fed) officials’ cautious stance on revising the policy, as they continue to assess the impact of Trump’s tariffs on the economy and inflation prospects, acts as a headwind for the recent upswing in Gold price.  

However, Gold buyers remain hopeful amid a lack of certainty on the US-China trade talks front.

Looking ahead, traders will pay close attention to any trade-related headlines from the White House or US President Trump for fresh cues on the Gold price action. The end-of-the-week flows will also emerge as one of the forces behind the Gold and the US Dollar movement later in the day.

Gold price technical analysis: Daily chart

The short-term technical outlook for the Gold price remains constructive as the 14-day Relative Strength Index (RSI) holds firm above the midline, currently near 65.

Gold price must find acceptance above the $3,400 threshold for resuming the uptrend toward the record highs of $3,500. Further up, the rising trendline resistance at $3,583 will come into play.

If the upside loses traction, a 21-day Simple Moving Average (SMA) test at $3,175 will be inevitable on a sustained move below Wednesday’s low of $3,260.

The line in the sand for Gold buyers is seen at the $3,200 barrier.

Gold FAQs

Gold has played a key role in human’s history as it has been widely used as a store of value and medium of exchange. Currently, apart from its shine and usage for jewelry, the precious metal is widely seen as a safe-haven asset, meaning that it is considered a good investment during turbulent times. Gold is also widely seen as a hedge against inflation and against depreciating currencies as it doesn’t rely on any specific issuer or government.

Central banks are the biggest Gold holders. In their aim to support their currencies in turbulent times, central banks tend to diversify their reserves and buy Gold to improve the perceived strength of the economy and the currency. High Gold reserves can be a source of trust for a country’s solvency. Central banks added 1,136 tonnes of Gold worth around $70 billion to their reserves in 2022, according to data from the World Gold Council. This is the highest yearly purchase since records began. Central banks from emerging economies such as China, India and Turkey are quickly increasing their Gold reserves.

Gold has an inverse correlation with the US Dollar and US Treasuries, which are both major reserve and safe-haven assets. When the Dollar depreciates, Gold tends to rise, enabling investors and central banks to diversify their assets in turbulent times. Gold is also inversely correlated with risk assets. A rally in the stock market tends to weaken Gold price, while sell-offs in riskier markets tend to favor the precious metal.

The price can move due to a wide range of factors. Geopolitical instability or fears of a deep recession can quickly make Gold price escalate due to its safe-haven status. As a yield-less asset, Gold tends to rise with lower interest rates, while higher cost of money usually weighs down on the yellow metal. Still, most moves depend on how the US Dollar (USD) behaves as the asset is priced in dollars (XAU/USD). A strong Dollar tends to keep the price of Gold controlled, whereas a weaker Dollar is likely to push Gold prices up.


Source link

25 04, 2025

Rises above 162.50, nine-day EMA

By |2025-04-25T09:03:05+03:00April 25, 2025|Forex News, News|0 Comments

  • EUR/JPY is likely to encounter initial resistance around the “pullback resistance” level near 164.50.
  • The 14-day RSI holding above 50 reinforces the bullish bias.
  • The initial support is seen at the nine-day EMA of 162.20, followed by the 50-day EMA at 161.34.

EUR/JPY extends its gains for the third successive session, trading around 162.80 during the Asian hours on Friday. Technical analysis of the daily chart shows the currency cross consolidating within an ascending channel, reinforcing a bullish outlook.

Moreover, the 14-day Relative Strength Index (RSI) holds above the 50 mark, reinforcing the bullish bias. The currency cross also trades above the nine-day Exponential Moving Average (EMA), indicating solid short-term momentum and the potential for continued upside.

On the upside, the EUR/JPY cross may face initial resistance at the “pullback resistance” near the 164.50 level. If this is surpassed, the next significant obstacle is at 166.69, which marks a nine-month high last seen in October 2024. A break above this level could open the doors for the currency cross to explore the region around the upper boundary of the ascending channel near the 169.00 level.

The EUR/JPY cross could encounter initial support at the nine-day EMA around 162.20, followed by the 50-day EMA at 161.34. A break below these levels might weaken the short- and medium-term price momentum, potentially applying downward pressure to test the lower boundary of the ascending channel at 160.50. A further decline could bring the currency cross to its two-month low of 155.59, recorded on March 4, followed by 154.41, its lowest level since December 2023.

EUR/JPY: Daily Chart

Euro PRICE Today

The table below shows the percentage change of Euro (EUR) against listed major currencies today. Euro was the strongest against the Japanese Yen.

USD EUR GBP JPY CAD AUD NZD CHF
USD 0.52% 0.41% 0.73% 0.14% 0.02% 0.22% 0.63%
EUR -0.52% -0.12% 0.23% -0.40% -0.50% -0.29% 0.10%
GBP -0.41% 0.12% 0.34% -0.27% -0.38% -0.19% 0.18%
JPY -0.73% -0.23% -0.34% -0.59% -0.73% -0.55% -0.16%
CAD -0.14% 0.40% 0.27% 0.59% -0.21% 0.07% 0.46%
AUD -0.02% 0.50% 0.38% 0.73% 0.21% 0.21% 0.58%
NZD -0.22% 0.29% 0.19% 0.55% -0.07% -0.21% 0.37%
CHF -0.63% -0.10% -0.18% 0.16% -0.46% -0.58% -0.37%

The heat map shows percentage changes of major currencies against each other. The base currency is picked from the left column, while the quote currency is picked from the top row. For example, if you pick the Euro from the left column and move along the horizontal line to the US Dollar, the percentage change displayed in the box will represent EUR (base)/USD (quote).

Source link

25 04, 2025

Dogecoin Price Prediction: Memecoin Likely Heading Toward A ‘Fresh Breakout,’ Above $0.185: Key Risks To Consider

By |2025-04-25T08:56:38+03:00April 25, 2025|Crypto News, News|0 Comments

A widely followed cryptocurrency trader predicted Thursday that Dogecoin’s DOGE/USD bullish momentum will sustain, forecasting a potential breakout above $0.1850.

What Happened: BitGuru, known for analyzing price patterns of cryptocurrencies, noted that the popular meme coin was stabilizing above a key support level after completing a “classic” cup-shaped recovery.

The cup-shaped recovery is a bullish continuation pattern in which the price recovers gradually after a downtrend, with the trajectory resembling a cup.

“If the price holds this level, we’re likely heading toward a fresh breakout above $0.1850 in the next leg up,” BitGuru said.

See Also: Cardinal Pietro Parolin-Themed Coin Skyrockets 770% As Crypto Bettors Think Vatican’s Secretary Of State Has Strong Chance Of Succeeding Pope Francis

The bullish projection was echoed by well-known chartist Trader Tartigrade, who spotted a bull flag, another pattern that signals a continuation of an upward trend.

“The breakout of the flag could send DOGE to $0.22,” Trader Tartigrade stated

On the contrary, the Commodity Channel Index, which measures the difference between the current price and the historical average price, indicated that DOGE was overbought and flashed a “Sell” signal, according to TradingView.

These forecasts coincided with a 17% spike in DOGE’s price over the week, following Bitcoin’s BTC/USD re-entry into the $90,000 region. The world’s largest meme coin was one of the highest mega-cap gainers during this period.

Price Action: At the time of writing, DOGE was exchanging hands at $0.1811, up 5.05% in the last 24 hours, according to data from Benzinga Pro. Year-to-date, the meme coin has plunged 42%.

Photo Courtesy: alfernec on Shutterstock.com

Read Next: 

Stock Score Locked: Want to See it?

Benzinga Rankings give you vital metrics on any stock – anytime.

Reveal Full Score

Market News and Data brought to you by Benzinga APIs

Source link

25 04, 2025

XAG/USD holds ground near weekly highs

By |2025-04-25T07:03:21+03:00April 25, 2025|Forex News, News|0 Comments


  • Silver steady on Thursday, supported by weaker US Dollar and lower bond yields.
  • Traders eye upside amid lingering uncertainty over full US-China tariff rollback.
  • Fed officials remain cautious, signal data-dependent path amid rising economic ambiguity.

Silver finished Thursday’s session virtually unchanged, yet it remains near weekly highs of $33.65, with traders poised to push the grey metal higher.

XAG/USD clings to $33.65 as Fed uncertainty and falling Treasury yields bolster precious metals despite tariff relief hopes

An improvement in risk appetite was sponsored by a de-escalation of US President Donald Trump’s tariffs on China, which weighed on silver prices. However, China’s Commerce Ministry Spokesman urged the US to lift all duties on Chinese imports “if it really wants to solve the problem.”

Precious metals remain underpinned by the fall of US Treasury yields. This consequently weakened the Greenback, which, according to the US Dollar Index (DXY), dropped 0.50% down to 99.28.

US economic data showed the labor market remains solid following the release of the latest Initial Jobless Claims figures, which came in aligned with estimates. US Durable Goods Orders smashed forecasts of 2% in March and grew 9.2% Month over Month due to a jump in transportation orders.

A myriad of Fed speakers led by Governor Waller grabbed the headlines. Waller said that it is unlikely to know the impact of tariffs in July, adding that the second half of 2025 will bring more clarity. Cleveland Fed Beth Hammack said that uncertainty is weighing on businesses, and if data warrants it, the Fed’s next move could be in June.

XAG/USD Price Forecast: Technical outlook

Amid this backdrop, Silver could remain trading near the week’s high but buyers need to clear key resistance levels. the first ceiling would be $34.00, followed by the current year-to-date (YTD) high of $34.58. Once those two levels are taken out, traders could target the $35.00 mark.

Conversely, if XAG/USD falls below $33.00, sellers will be tempted to test the 50-day Simple Moving Average (SMA) at $32.63. Once cleared, the next support would be $32.00.

Silver FAQs

Silver is a precious metal highly traded among investors. It has been historically used as a store of value and a medium of exchange. Although less popular than Gold, traders may turn to Silver to diversify their investment portfolio, for its intrinsic value or as a potential hedge during high-inflation periods. Investors can buy physical Silver, in coins or in bars, or trade it through vehicles such as Exchange Traded Funds, which track its price on international markets.

Silver prices can move due to a wide range of factors. Geopolitical instability or fears of a deep recession can make Silver price escalate due to its safe-haven status, although to a lesser extent than Gold’s. As a yieldless asset, Silver tends to rise with lower interest rates. Its moves also depend on how the US Dollar (USD) behaves as the asset is priced in dollars (XAG/USD). A strong Dollar tends to keep the price of Silver at bay, whereas a weaker Dollar is likely to propel prices up. Other factors such as investment demand, mining supply – Silver is much more abundant than Gold – and recycling rates can also affect prices.

Silver is widely used in industry, particularly in sectors such as electronics or solar energy, as it has one of the highest electric conductivity of all metals – more than Copper and Gold. A surge in demand can increase prices, while a decline tends to lower them. Dynamics in the US, Chinese and Indian economies can also contribute to price swings: for the US and particularly China, their big industrial sectors use Silver in various processes; in India, consumers’ demand for the precious metal for jewellery also plays a key role in setting prices.

Silver prices tend to follow Gold’s moves. When Gold prices rise, Silver typically follows suit, as their status as safe-haven assets is similar. The Gold/Silver ratio, which shows the number of ounces of Silver needed to equal the value of one ounce of Gold, may help to determine the relative valuation between both metals. Some investors may consider a high ratio as an indicator that Silver is undervalued, or Gold is overvalued. On the contrary, a low ratio might suggest that Gold is undervalued relative to Silver.


Source link

25 04, 2025

SOLANA PRICE ANALYSIS & PREDICTION (April 24) – Sol Pauses Buying After a 50% Recovery in Two Weeks, What Next?

By |2025-04-25T06:55:19+03:00April 25, 2025|Crypto News, News|0 Comments

Advancing recovery this week, Sol posted more gains and tapped a new monthly high. Unfortunately, the price is currently down due to a recent rejection. This may trigger a sell if the bulls fail to sustain momentum.

Following the early-month breakdown to a new yearly low of $94.2, Sol found support and climbed back above the crucial $100 level lost during the crash in the first week. Volatility increased, and the price surged to around $136 in the second week, halting buying due to a rejection. This rejection triggered a slight pullback, and the price retested $124.

Meanwhile, during the surge, the price broke through a falling trendline, acting as resistance for three months. Sol advanced buying and reached a high of $154 yesterday, but lost grip following a bearish interception.

Today, the price appears weak following a minor loss in the past hours. While this has brought a little setback in the market, the crypto may lose momentum again if the supply level increases on a daily basis.

However, the recent recovery marked a significant retracement phase for the asset since it started to drop in January. Retracing above the $300 level could set the stage for bigger growth in the long term. But from a technical standpoint, the bears are likely to resume pressure shortly.

SOL’s Key Level To Watch

Source: Tradingview

The close support for this drop is located at $136.7. A plunge below this level could roll the price to $122.7 and $112. The last defence line for the bulls would be $94.26 if the supply level increases.

If Sol continues to increase, there’s an immediate resistance at $161. The $180 level is the next resistance to watch with a potential surge to $209.

Key Resistance Levels: $161, $180, $209

Key Support Levels: $136.7, $122.7, $112

  • Spot Price: $147.4
  • Trend: Bullish
  • Volatility: High

Disclosure: This is not trading or investment advice. Always do your research before buying any cryptocurrency or investing in any services.

Follow us on Twitter @nulltxnews to stay updated with the latest Crypto, NFT, AI, Cybersecurity, Distributed Computing, and Metaverse news!


Source link

25 04, 2025

Crude Oil Price Forecast: Rally Meets Resistance, Downside Risks Emerge

By |2025-04-25T05:02:06+03:00April 25, 2025|Forex News, News|0 Comments


Bearish Inside Day Forms

Today, Thursday, crude oil consolidated forming an inside day with a high of $63.73 and low at $62.40. There are a couple indications of weakness provided from the day. Notice that the day’s range is in the lower half of Wednesday’s range, and at the time of this writing, crude oil is trading below the halfway point of the range and looks likely to close in a similar relatively bearish position. Moreover, the high for the day found resistance at a significant price level from May 2023 (dashed horizontal). That was the lowest traded price for crude oil until the recent sharp fall.

Below $61.94 Points Lower

A decline below today’s low provides the next sign of weakening, while a deeper bearish retracement is signaled on a drop below Wednesday’s low of $61.94. Notice that there is also a small rising trend line across the bottom of recent price action. That line will already be broken if Wednesday’s low is triggered. If the decline is triggered there are two key areas to watch for support. The first is at a recent interim swing low of $60.40 and the 50% retracement at $60.27. Then, further down is a range from $59.08 to $58.86, defined by the 61.8% Fibonacci retracement and prior daily support, respectively.

Weak Weekly Close Looks Likely

There is one more day to the week with crude oil set to establish a second consecutive higher weekly high and higher weekly low. It reflects short term strength. But bearish price action following this week’s high puts crude oil in a position to end lower for the period and likely below last week’s high of $64.72. Therefore, the upside weekly breakout would not be confirmed on that time frame.

For a look at all of today’s economic events, check out our economic calendar.


Source link

25 04, 2025

Protein deficiency? How to get 60 gm daily from natural food and not depend on supplements | Health and Wellness News

By |2025-04-25T04:59:02+03:00April 25, 2025|Dietary Supplements News, News|0 Comments


When a 32-year-old patient with protein deficiency came to meet Bhakti Samant, chief dietician at Kokilaben Dhirubhai Ambani Hospital, Mumbai, he had thought she would prescribe a protein supplement. But he was surprised when she told him he did not need any supplement at all and gave him a diet chart that had whole food sources of protein spread across meals and snacks. He is now fit and energetic.

“All he needed was to balance his diet with protein in every meal to meet his daily requirement. This is the myth that everybody falls for, that protein from natural foods is not enough to meet your nutritional requirement. The body needs 0.8 gm-1gm of protein per kg of body weight to avoid deficiencies. Unless one is an athlete or recovering from illness, any normal, healthy person can easily get between 60 gm to 65 gm of protein from natural food sources. Regular people do not need supplements, just practical meal plans,” says Samant.

WHY INDIA LAGS BEHIND PROTEIN TARGETS?

All nutritional guidelines suggest that 10-35% of our daily calories should come from protein-rich foods. “Estimates show that only 10 to 11 per cent of the Indian diet is protein, compared to 12 to 15 per cent in the US. We are stuck at a consumption level of 0.5 gm per kg of body weight. That’s because we are largely vegetarians, with plant proteins not quite matching up to animal ones. But the bigger problem is behavioural. Our diets are carbohydrate-heavy. By not having enough protein (a quarter of your plate in every meal), you are creating a protein vacuum which you fill up with more carbohydrates, the root cause of blood sugar, inflammation and other problems,” says Dr Seema Gulati of the National Diabetes, Obesity and Cholesterol Foundation (NDOC) Centre for Nutrition Research, Delhi.

Story continues below this ad

Myths around having protein-rich diets pose another challenge, according to Ritika Samaddar, regional head, Clinical Nutrition and Dietetics, Max Healthcare. “While animal protein is easier to incorporate, even plant proteins, in the right variety and combinations, can easily meet your daily protein requirement. Some plant-based sources like soy (tofu, soy milk), quinoa and chia seeds offer all nine essential amino acids. Plus they don’t have saturated fat,” she says.

WHAT ARE THE MYTHS AROUND DIETARY PROTEIN?

Most of Samaddar’s patients feel that a protein-rich diet is only for athletes and bodybuilders. “Apart from building muscle, repairing tissues and producing hormones, proteins lend satiety, prevent quick breakdown of sugar and keep hunger pangs at bay, managing both weight and calories,” she says.

Many believe high protein diets harm the kidneys. Yet a moderate protein intake with hydration is safe for most people. “What many don’t know is that even patients of Chronic Kidney Disease (CKD), not on dialysis, need 0.6 gm of protein per kg of body weight per day. Those on dialysis need 1.0-1.2 gm per kg of body weight per day, and that too from whole food sources. Yet such patients don’t have more than 0.2 per gm per kg of body weight,” says Samant.

The elderly, too, require 1 to 1.2 gm per kg body weight to avoid sarcopenia, a progressive wasting of muscle and skeletal mass.

Story continues below this ad

HOW EASY IS IT TO GET DAILY PROTEIN QUOTA FROM DIETARY SOURCES

Dr Gulati has a chart ready. “Let’s assume you need between 60 to 65 gm of protein per day. Let’s begin with pre-breakfast, where you can have 10 nuts, soaked or raw, all yielding between 3 gm to 26 gm, depending on the portion. You can even split them into two parts. For breakfast you can have moong dal chila, which yields 9 gm of protein per serving, so two would be 18 gm with chutney. Have a tofu salad which can give you 20 gm straight per 100 gram or a cup. Have a glass (200 ml) of buttermilk which amounts to 15 gm of protein,” she says.

For lunch, she recommends multigrain millet rotis (4 to 7 gm from two diskettes) a cup of dal (12 to 20 gm), sauteed vegetables (between 2 to 4 gm per 100 g), which should be half your plate, and a bowl of curd (15 gm). Round it off with a cup of warm milk (3 to 4 gm).

Snacks can be about roasted chickpeas (15 gm), a cup of grilled paneer (46 gm) cubes or sprouts (3 to 6 gm per 100 gm).

For dinner, Dr Gulati recommends besan roti (a 30 gm roti contains around 6.6 gm of protein) or soybean flour roti (4.6 gm per roti), paneer, vegetables and curd (as listed above). For beverages, one can have a sattu drink (7 to 8 gm). “There are enough high value plant proteins that can more than make up for your quota,” she says.

Story continues below this ad

For those used to animal protein, eggs (6 gm per egg), fish (a large piece or two small pieces contain 20 g protein) and chicken (24 to 32 gm per 100 gm, which is a biggish piece) are good sources. “These in combination with plant proteins provide a rich bioavailable source. Who needs supplements then?” asks Dr Gulati.

WHAT IS THE BIG MISTAKE THAT WE MAKE?

Samant says most of us load up on protein in one or two meals and think we are done for the day. “Remember the body can absorb only 20 to 25 gm of protein at a time. So if you have extra protein in a single meal, the surplus will go into storage as fat. That’s why you need to evenly distribute protein intake through the day for the best results,” she adds. That way you can keep your normal protein range between 6.0 and 8.3 g/dL.


Source link

25 04, 2025

Will It Reach $1,000 As Blockchain Adoption Soars?

By |2025-04-25T04:54:06+03:00April 25, 2025|Crypto News, News|0 Comments

  • Ripple (XRP) is forecast to rise from $3 to $100 by 2025, driven by adoption and increasing market demand.
  • Once XRP hits $1,000, analysts expect it to stabilize, marking its place as a mainstream financial tool.
  • As banks adopt XRP for cross-border transactions, its demand will surge, potentially reaching $1,000.

Ripple (XRP) is anticipated to bounce higher in the next few years, with price forecasts ranging from $3 up to $1,000. The market dynamics of Ripple could lead to XRP peaking from $3 to $5 in the future. XRP could possibly rise to between $10 and $20 given the progressing altcoin season. This surge would have a positive impact on the cryptocurrency as it would mark its significant achievement.

After reaching this high, XRP may drop back into bear territory once it moves below the $1 digit again. Nevertheless, BarriX predicts that the loss is going to be temporary. The cryptocurrency is seen rising to $100 by the end of 2025 as more banks and financial institutions adopt blockchain and XRP.

XRP’s Adoption by Banks

Factors that will contribute to this price increase include noticeable buy signals from large banks, which will facilitate the growth of Ripple’s XRP. Once a bank adopts the XRP in its processes, the demand for XRP in the market is likely to increase. The market demand could even drive the price to a thousand dollars per XRP. The opportunity to engage in cross-border transactions using XRP will make it expand its importance in the global financial market even more.

Once XRP achieves $1,000 per coin, it is believed to achieve long-term price stability at that level. It is forecasted that the currency will stay significantly high without going back to the previously noted low levels. This will give a great indication that XRP is standardized as a financial tool and no longer a financial asset that is volatile in the market.

Ripple (XRP’s) Rise as Financial Keystone

The use of blockchain technology by banks will fully come into force, given the key driver for increasing usage for XRP. Due to this reason, more financial institutions are adopting the use of XRP amidst its growing value. This ability will create the necessary architecture needed to make XRP the powerhouse of the financial world.

The future of Ripple’s cryptocurrency XRP appears to be promising, as experts predict its price to rise considerably in the future years. With more organizations embracing blockchain technology, XRP may emerge to be a keystone of the financial system. If more banks adopt XRP to facilitate transfers, the cryptocurrency’s price may rise to $1,000 and facilitate a shift in global transactions.


Source link

Go to Top