About Editorial team of BIPNs

Main team of content of bipns.com. Any type of content should be approved by us.
11 04, 2025

XAG/USD retreats from weekly top, back below $31.00 ahead of US CPI

By |2025-04-11T15:14:40+02:00April 11, 2025|Forex News, News|0 Comments


  • Silver attracts some intraday sellers following an intraday uptick to a fresh weekly high.
  • The technical setup favors bearish traders and supports prospects for additional losses.
  • A move beyond the 50% Fibo. hurdle is needed to negate the near-term negative bias.

Silver (XAG/USD) struggles to capitalize on its modest intraday uptick and retreats slightly after touching a fresh weekly high, around the $31.30 region during the early European session on Thursday. The intraday selling picks up pace in the last hour and drags the white metal back below the $31.00 mark as traders now look forward to the US consumer inflation figures before placing fresh directional bets.

From a technical perspective, the XAG/USD now seems to have found acceptance above the 38.2% Fibonacci retracement level of the recent slump from the March swing high to a fresh year-to-date low touched earlier this week. The subsequent move up, however, stalls ahead of the 50% Fibo. level. Moreover, oscillators on the daily chart – though they have been recovering from lower levels – are holding in negative territory. This, in turn, warrants some caution before positioning for an extension of the weekly uptrend from the $28.25 region, or the lowest level since September 2024.

In the meantime, any further slide below the 38.2% Fibo. level is likely to find some support near the $30.55 region. Some follow-through selling, however, could make the XAG/USD vulnerable to accelerate the fall towards the $30.00 psychological mark en route to the 23.6% Fibo. level, around the $29.80-$29.75 zone. Failure to defend the said support levels would shift the near-term bias back in favor of bearish traders. The white metal might then decline to the $29.35-$29.30 zone en route to the $29.00 mark and eventually aim towards retesting the multi-month low, around the $28.25 region.

On the flip side, bulls might now wait for a sustained strength beyond the daily swing high, around the $31.30 region, which nears the 50% Fibo. level, before placing fresh bets. The subsequent move-up should allow the XAG/USD to reclaim the $32.00 mark and climb further towards the 61.8% Fibo. level, around the $32.15-$32.20 zone. The latter should act as a key pivotal point, which if cleared decisively will be seen as a fresh trigger for bullish traders and lift the white metal beyond the $32.65 intermediate barrier, towards the $33.00 round figure.

Silver 4-hour chart

Silver FAQs

Silver is a precious metal highly traded among investors. It has been historically used as a store of value and a medium of exchange. Although less popular than Gold, traders may turn to Silver to diversify their investment portfolio, for its intrinsic value or as a potential hedge during high-inflation periods. Investors can buy physical Silver, in coins or in bars, or trade it through vehicles such as Exchange Traded Funds, which track its price on international markets.

Silver prices can move due to a wide range of factors. Geopolitical instability or fears of a deep recession can make Silver price escalate due to its safe-haven status, although to a lesser extent than Gold’s. As a yieldless asset, Silver tends to rise with lower interest rates. Its moves also depend on how the US Dollar (USD) behaves as the asset is priced in dollars (XAG/USD). A strong Dollar tends to keep the price of Silver at bay, whereas a weaker Dollar is likely to propel prices up. Other factors such as investment demand, mining supply – Silver is much more abundant than Gold – and recycling rates can also affect prices.

Silver is widely used in industry, particularly in sectors such as electronics or solar energy, as it has one of the highest electric conductivity of all metals – more than Copper and Gold. A surge in demand can increase prices, while a decline tends to lower them. Dynamics in the US, Chinese and Indian economies can also contribute to price swings: for the US and particularly China, their big industrial sectors use Silver in various processes; in India, consumers’ demand for the precious metal for jewellery also plays a key role in setting prices.

Silver prices tend to follow Gold’s moves. When Gold prices rise, Silver typically follows suit, as their status as safe-haven assets is similar. The Gold/Silver ratio, which shows the number of ounces of Silver needed to equal the value of one ounce of Gold, may help to determine the relative valuation between both metals. Some investors may consider a high ratio as an indicator that Silver is undervalued, or Gold is overvalued. On the contrary, a low ratio might suggest that Gold is undervalued relative to Silver.


Source link

11 04, 2025

Euro rallies to multi-year high with no recovery in sight for USD

By |2025-04-11T15:11:34+02:00April 11, 2025|Forex News, News|0 Comments

EUR/USD trades at its highest level since February 2022 above 1.1400.

The USD selloff intensifies after China raises tariffs on US goods in retaliation.

The near-term technical outlook points to overbought conditions.

EUR/USD gained more than 2% on Thursday and extended its upsurge on Friday to a new multi-year high above 1.1400. Although the pair’s near-term technical outlook points to overbought conditions, investors are like to stay away from the US Dollar (USD) amid a deepening US-China trade conflict.

Euro PRICE This week

The table below shows the percentage change of Euro (EUR) against listed major currencies this week. Euro was the weakest against the Swiss Franc.

USD EUR GBP JPY CAD AUD NZD CHF
USD -4.18% -1.76% -2.23% -2.62% -2.82% -3.87% -4.95%
EUR 4.18% 2.81% 2.70% 2.26% 1.34% 0.94% -0.19%
GBP 1.76% -2.81% -1.42% -0.54% -1.43% -1.82% -2.92%
JPY 2.23% -2.70% 1.42% -0.36% 0.35% -0.46% -2.44%
CAD 2.62% -2.26% 0.54% 0.36% -0.55% -1.29% -2.66%
AUD 2.82% -1.34% 1.43% -0.35% 0.55% -0.40% -1.52%
NZD 3.87% -0.94% 1.82% 0.46% 1.29% 0.40% -1.13%
CHF 4.95% 0.19% 2.92% 2.44% 2.66% 1.52% 1.13%

The heat map shows percentage changes of major currencies against each other. The base currency is picked from the left column, while the quote currency is picked from the top row. For example, if you pick the Euro from the left column and move along the horizontal line to the US Dollar, the percentage change displayed in the box will represent EUR (base)/USD (quote).

Growing fears over the US economy tipping into recession caused the US Treasury bonds and the USD to remain under heavy selling pressure on Thursday.

On Friday, China’s Finance Ministry announced that they will raise additional tariffs on US imports from 84% to 125% from April 12, in retaliation to the US’ tariffs on Chinese goods.

This development caused the USD selloff to intensify and triggered another leg higher in EUR/USD in the European session.

The US economic calendar will feature Producer Price Index data for March and the University of Michigan will publish the Consumer Sentiment Index data for April. Investors could ignore these data releases and remain focused on fresh developments surrounding the US -China trade war.

In case US President Donald Trump responds by increasing tariffs on Chinese goods even further, the USD selloff could continue heading into the weekend. On the other hand, the USD could stage a rebound if one of the sides takes a step back to ease tensions.

EUR/USD Technical Analysis

The Relative Strength Index (RSI) indicator on the 4-hour chart climbed above 80, highlighting overbought conditions for the pair.

On the upside, 1.1500 (round level) could be seen as the next resistance level before 1.1535 (static level from November 2021) and 1.1600 (static level, round level). Looking south, supports could be spotted at 1.1300 (static level, round level) and 1.1200 (static level, round level).

US-China Trade War FAQs

Generally speaking, a trade war is an economic conflict between two or more countries due to extreme protectionism on one end. It implies the creation of trade barriers, such as tariffs, which result in counter-barriers, escalating import costs, and hence the cost of living.

An economic conflict between the United States (US) and China began early in 2018, when President Donald Trump set trade barriers on China, claiming unfair commercial practices and intellectual property theft from the Asian giant. China took retaliatory action, imposing tariffs on multiple US goods, such as automobiles and soybeans. Tensions escalated until the two countries signed the US-China Phase One trade deal in January 2020. The agreement required structural reforms and other changes to China’s economic and trade regime and pretended to restore stability and trust between the two nations. However, the Coronavirus pandemic took the focus out of the conflict. Yet, it is worth mentioning that President Joe Biden, who took office after Trump, kept tariffs in place and even added some additional levies.

The return of Donald Trump to the White House as the 47th US President has sparked a fresh wave of tensions between the two countries. During the 2024 election campaign, Trump pledged to impose 60% tariffs on China once he returned to office, which he did on January 20, 2025. With Trump back, the US-China trade war is meant to resume where it was left, with tit-for-tat policies affecting the global economic landscape amid disruptions in global supply chains, resulting in a reduction in spending, particularly investment, and directly feeding into the Consumer Price Index inflation.

Source link

11 04, 2025

Tea-based Skin Care Market Size, Share

By |2025-04-11T15:08:50+02:00April 11, 2025|Dietary Supplements News, News|0 Comments


Report Overview

The Global Tea-based Skin Care Market size is expected to be worth around USD 541.3 Million by 2034, from USD 260.2 Million in 2024, growing at a CAGR of 7.6% during the forecast period from 2025 to 2034.

The Tea-Based Skin Care Market comprises a segment within the broader skincare industry that formulates products using various tea extracts such as green tea, black tea, white tea, and herbal infusions. These extracts are rich in antioxidants, anti-inflammatory agents, and natural detoxifiers, making them highly effective for addressing skin concerns like acne, aging, pigmentation, and sensitivity.

Tea-based Skin Care Market Size, Share

The market caters to a growing consumer base seeking natural, organic, and sustainable personal care solutions. It includes a variety of products such as creams, serums, facial cleansers, masks, and lotions, infused with tea components. This market is witnessing growing adoption across both mass-market and premium skincare segments, driven by rising health consciousness, consumer awareness of clean ingredients, and the demand for holistic beauty solutions.

Tea-based skincare products have evolved beyond niche segments to become mainstream essentials in beauty routines. Their rise is attributed to strong antioxidant properties that improve skin texture and tone, and cater to the rising demand for natural, chemical-free products. Tea’s therapeutic value, especially in reducing inflammation and protecting against environmental damage, gives it a competitive edge in clean beauty trends.

From a formulation standpoint, tea-derived polyphenols are now pivotal in anti-aging and detoxifying product lines. This trend aligns with consumers prioritizing wellness-oriented ingredients. With increasing R&D investments, brands are exploring unique tea variants like matcha, rooibos, and kombucha for innovative skincare applications.

The tea-based skincare market is experiencing an upward trajectory, driven by the intersection of wellness, sustainability, and efficacy. According to Garnier, eco-friendliness has caught on in the beauty industry, with 1 out of 4 skincare users preferring eco-friendly brands, and 92% of buyers supporting companies with environmental or social advocacies. This aligns with tea’s natural origin and minimal environmental footprint, positioning it favorably in consumer perception.

The scalability of sourcing tea from global markets and its versatile applications across product categories offer an expansive landscape for innovation and product line diversification. Emerging economies are also adopting tea-based skincare, enhancing the market’s global footprint.

Global interest in tea-based skincare is also being shaped by favorable economic trends. According to Economic Times, India’s tea exports hit a decade high of 255 million kg in 2024, indicating a robust supply ecosystem and potential backward integration for skincare brands.

Moreover, the growing popularity of tea for skin benefits is substantiated by Mfine, which states 20% of black tea drinkers in the US choose it for clearer skin, revealing a crossover between wellness and skincare. With 85% of women and 79% of men in the US drinking tea, brands have an opportunity to convert lifestyle preferences into product innovation.

Governments across Asia, particularly India and China, are promoting agro-based exports and natural product industries through subsidies and relaxed regulations, enhancing investment attractiveness. Regulatory bodies are also defining clean beauty guidelines, which tea-based products can easily comply with due to their natural composition, paving the way for smoother market entry and consumer trust.

Key Takeaways

  • Global Tea-based Skin Care Market is projected to reach USD 541.3 Million by 2034 from USD 260.2 Million in 2024, growing at a CAGR of 7.6% (2025–2034).
  • Creams & Lotions led the By Product Type segment in 2024, driven by their moisturizing and anti-aging benefits.
  • Serums followed closely, favored for targeted treatment and high efficacy in skin concerns like brightness and hydration.
  • Green Tea dominated the By Tea Type segment in 2024, due to its rich polyphenol (EGCG) content offering antioxidant and anti-inflammatory effects.
  • Facial Care products held a 69.4% market share in 2024, driven by consumer preference for natural and tea-infused skincare.
  • Offline distribution channels commanded a 78.4% share in 2024, as consumers favored in-store product experience for skincare.
  • Asia Pacific led regionally with a 35.1% market share, worth around USD 91.2 Million, due to its cultural affinity for tea and rising demand for natural skincare.

Product Type Analysis

Creams & Lotions Take the Lead in Tea-based Skincare with a Robust Market Share

In 2024, the Tea-based Skin Care Market saw Creams & Lotions leading the pack in the By Product Type Analysis segment. With their versatile applications ranging from moisturizing to anti-aging benefits, these products secured a strong market position. Moving to Serums, which are highly concentrated and targeted solutions, they followed closely behind, favored for their efficacy in addressing specific skin concerns such as brightness and hydration.

Face Packs/Masks also carved out a significant niche, with consumers turning to these products for intensive care and relaxation, appreciating their deep cleansing and rejuvenating properties. The segment for Cleansers sustained a steady demand. These products are essential in daily skincare routines, valued for their effectiveness in removing impurities and preparing the skin for subsequent products.

Lastly, the category labeled as Other Skincare Products includes a variety of items such as toners and exfoliants. This segment caters to more specific skincare needs, completing the comprehensive skincare regimen that tea-based products offer.

Tea Type Analysis

Green Tea leads with a dominant market position in 2024 due to its antioxidant-rich profile and skin benefits

In 2024, Green Tea held a dominant market position in the By Tea Type Analysis segment of the Tea-based Skin Care Market. Its growing popularity is primarily attributed to the high concentration of polyphenols, particularly EGCG (epigallocatechin gallate), which are known for their potent antioxidant and anti-inflammatory properties. These bioactive compounds help reduce skin irritation, redness, and swelling, making green tea-based skincare products a preferred choice among consumers focused on natural and gentle ingredients.

Green tea also aligns well with the rising demand for clean beauty trends and sustainable product sourcing. Leading skincare brands continue to innovate with green tea formulations in creams, serums, and masks, further cementing its market dominance.

Black Tea captured a modest portion of the market, supported by its firming and anti-aging properties. It contains theaflavins and tannins that are known to improve skin elasticity and reduce puffiness. However, compared to green tea, black tea’s positioning in skincare remains niche and often appeals to more mature consumers seeking wrinkle-reducing formulations.

The Others segment, including white tea, oolong, and herbal infusions, registered a relatively smaller share. These variants are increasingly being explored for their unique phytochemical properties, but their market presence remains limited due to lower consumer awareness and lesser commercial availability.

Product Analysis

Facial Care leads with a dominant 69.4% share, driven by rising demand for natural and soothing skincare solutions

In 2024, Facial Care held a dominant market position in the By Product Analysis segment of the Tea-based Skin Care Market, with a 69.4% share. The segment’s strength stems from the growing preference for natural, tea-infused ingredients known for their antioxidant and anti-inflammatory benefits.

Consumers are increasingly turning to facial care products like cleansers, serums, and face masks formulated with green tea, matcha, and white tea extracts. These products are perceived as gentle, yet effective in combating environmental stressors and signs of aging, thereby boosting their popularity across both premium and mass-market categories.

Body Care is gaining traction as consumers seek holistic skincare routines that go beyond the face. Tea-based body lotions, scrubs, and creams are increasingly being introduced by brands looking to capture the wellness-conscious demographic. While it currently lags behind facial care, this segment shows significant potential for growth, especially among consumers adopting full-body skincare regimens.

The Others category, comprising specialty items like eye creams, hand care, and lip balms, accounts for a smaller portion of the market. However, its niche nature is supported by demand for targeted solutions, particularly in regions where product personalization and multifunctional benefits are becoming essential purchasing drivers.

Distribution Channel Analysis

Offline dominates with 78.4% share due to strong retail presence and consumer trust

In 2024, Offline held a dominant market position in By Distribution Channel Analysis segment of the Tea-based Skin Care Market, with a 78.4% share. This dominance can be attributed to the wide availability of tea-based skin care products in specialty stores, supermarkets, and department stores.

The offline channel continues to benefit from consumers’ preference for physical product inspection, especially for skincare items where texture, fragrance, and packaging influence purchase decisions.

Additionally, brand-led promotions, free samples, and consultations provided in offline stores have created a more personalized shopping experience, increasing consumer engagement and trust. Offline retail formats also appeal to customers in emerging markets where digital infrastructure is still developing, making traditional shopping a more accessible option.

On the other hand, the online channel is gradually gaining traction, driven by the rising adoption of e-commerce platforms and increasing smartphone penetration. While it currently holds a smaller market share, it benefits from convenience, a broader product range, and the ability to compare prices and reviews.

Growing awareness of clean beauty and wellness trends, amplified by social media and influencer marketing, is further fueling online demand for tea-based skincare products. As digital access expands, this segment is poised for future growth.

Tea-based Skin Care Market Distribution Channel AnalysisTea-based Skin Care Market Distribution Channel Analysis

Key Market Segments

By Tea Type

  • Green Tea
  • Black Tea
  • Others

By Product

  • Facial Care
  • Body Care
  • Others

By Distribution Channel

Drivers

Antioxidant-Rich Tea Boosts Demand for Natural Skincare Solutions

Tea-based skincare products are gaining traction globally due to their natural antioxidant properties. Green tea, in particular, is packed with polyphenols—powerful compounds that help fight inflammation, soothe irritated skin, and slow down the signs of aging. These benefits are attracting both skincare brands and consumers looking for gentle yet effective solutions.

Another strong driver is the increasing consumer awareness around what goes into their skincare products. People are becoming more informed about harmful chemicals and are now leaning towards natural, plant-based alternatives. Tea, being a familiar and trusted ingredient, fits perfectly into this trend. Consumers are not just looking for results; they also want to feel confident about the safety and sustainability of the products they use.

Additionally, the global shift towards clean beauty is giving tea-based skincare an extra push. Clean beauty focuses on non-toxic, eco-friendly, and ethically sourced ingredients—values that tea products naturally align with. Whether it’s green, white, black, or oolong tea, these ingredients are perceived as pure, safe, and effective.

Overall, as skincare trends continue to evolve, tea-based formulations are benefiting from a perfect mix of science-backed benefits and strong consumer sentiment around natural wellness. This growing interest, especially among younger, health-conscious buyers, is set to drive steady growth in the tea-based skincare market over the coming years.

Restraints

Limited Awareness About Tea’s Benefits in Skincare Slows Market Growth

One of the main restraints in the tea-based skincare market is the limited consumer understanding of how tea ingredients benefit the skin. While tea is widely known as a healthy beverage, not everyone connects it with skincare advantages such as anti-aging, soothing, and antioxidant properties.

This lack of awareness can slow down the market’s growth, especially in regions where herbal or natural skincare is still gaining ground. Many consumers tend to stick to familiar ingredients they already trust, making it harder for tea-based products to establish a strong foothold.

Another key challenge is regulatory pressure. Skincare products, particularly those claiming natural or therapeutic effects, must comply with strict regulations across different countries. These rules govern what kind of ingredients can be used, how the product is labeled, and what claims can be made in marketing.

For tea-based skincare, this means that even if the product is effective, companies may struggle to promote it openly due to limitations in what they are legally allowed to say. Navigating these complex and varying regulations can delay product launches, increase compliance costs, and restrict innovation in product development.

Overall, while tea-based skincare has strong potential due to growing interest in natural beauty products, limited consumer education and strict regulatory frameworks continue to pose significant restraints to its growth. Brands need to invest in consumer education and ensure clear, compliant messaging to overcome these barriers effectively.

Growth Factors

Rising Beauty Awareness in Emerging Economies Fuels Tea-Based Skincare Growth

The tea-based skincare market is seeing strong growth potential, especially in emerging regions like Asia-Pacific and Latin America. As more people in these areas experience rising incomes and become more conscious about personal care, they are beginning to explore natural and herbal beauty products. Tea, known for its antioxidant and soothing properties, fits well with this trend. Brands can benefit by expanding their product lines into these markets through local partnerships, online channels, and targeted marketing.

Another promising area is the development of men’s skincare products. The male grooming segment is expanding, and tea-infused products tailored for men—such as facial cleansers, moisturizers, or aftershave treatments—can open up a fresh customer base. In addition, consumers today care not only about what’s inside their products but also about how they are packaged.

Eco-conscious shoppers are more likely to support brands that use recyclable or biodegradable packaging. Moving towards sustainable packaging solutions can boost brand reputation and help companies stand out in a crowded market. Altogether, focusing on new markets, underserved customer segments like men, and eco-friendly innovations can give brands a strong competitive edge and long-term growth in the tea-based skincare industry.

Emerging Trends

Rising Preference for Natural Wellness Boosts Tea-Based Skincare Market

As more people look for natural ways to stay healthy inside and out, tea-based skincare is gaining popularity. Consumers are moving beyond just looking good—they want products that support overall wellness. Tea, known for its antioxidants and calming properties, fits perfectly into this holistic approach. Another big trend is the use of multi-step skincare routines, especially in places like South Korea and Japan.

People are using more products in layers, and tea-based items are being added as important steps—like toners, serums, or masks—because they feel gentle and effective. Brands are also getting creative by using different kinds of teas in their formulas. For example, chamomile tea helps calm the skin, while black tea can make it feel firmer.

Green tea is known for reducing inflammation, and white tea is great for fighting signs of aging. By blending these teas, companies can appeal to many skin concerns and offer more targeted solutions. Overall, the mix of wellness trends, beauty routines, and innovative use of ingredients is creating a strong market for tea-based skincare.

Regional Analysis

Asia Pacific Dominates the Tea-based Skin Care Market with a 35.1% Share, Valued at USD 91.2 Million

The global tea-based skin care market is witnessing dynamic regional growth patterns, driven by varying levels of awareness, cultural influence, and consumer preference for natural and organic products.

Asia Pacific stands out as the dominant region, holding a 35.1% market share, valued at approximately USD 91.2 million. This leadership is largely due to the region’s strong cultural connection to tea and rising demand for herbal and natural skincare solutions. Countries such as China, Japan, and South Korea are key markets, with rapidly growing consumer interest in traditional beauty practices infused with modern formulations. The market in this region is expected to maintain strong momentum, driven by both domestic consumption and increasing export demand.

Tea-based Skin Care Market Regional AnalysisTea-based Skin Care Market Regional Analysis

Regional Mentions:

North America follows, with a substantial share of the global market. Consumers in the United States and Canada are increasingly inclined toward clean, plant-based beauty products. The region’s focus on wellness and sustainable beauty trends contributes significantly to the adoption of tea-based skin care items, particularly those infused with green tea and white tea extracts known for their antioxidant and anti-aging properties.

In Europe, the market is also robust, supported by a growing preference for eco-conscious beauty solutions. Countries like Germany, France, and the United Kingdom are embracing tea-based formulations in skincare routines, with a focus on sustainability and product transparency. The region shows promising growth potential due to a maturing organic beauty market.

Meanwhile, Latin America and the Middle East & Africa are emerging markets for tea-based skincare. While growth is comparatively slower, increasing urbanization, rising disposable incomes, and expanding beauty awareness are expected to drive gradual uptake of such products.

Key Regions and Countries

  • North America
  • Europe
    • Germany
    • France
    • The UK
    • Spain
    • Italy
    • Rest of Europe
  • Asia Pacific
    • China
    • Japan
    • South Korea
    • India
    • Australia
    • Rest of APAC
  • Latin America
    • Brazil
    • Mexico
    • Rest of Latin America
  • Middle East & Africa
    • South Africa
    • Saudi Arabia
    • UAE
    • Rest of MEA

Key Players Analysis

In 2024, the global tea-based skin care market is experiencing robust growth, driven by consumer demand for natural, antioxidant-rich formulations. Key players are leveraging tea extracts to meet this demand, each bringing unique strengths to the market.

SkinYoga has established itself as a leader in the natural skincare segment, offering products like the Green Tea Face Mask that cater to consumers seeking organic solutions for acne and sun protection. Their emphasis on minimalistic, plant-based formulations resonates with the growing preference for clean beauty.

L’Oréal S.A. continues to innovate by integrating tea extracts into its extensive product lines, such as the Revitalift series. By acquiring complementary brands with vegan, high-efficacy formulas, L’Oréal enhances its positioning within the clean beauty movement.

ArtNaturals focuses on affordability and accessibility, offering tea tree-infused products that appeal to budget-conscious consumers. Their straightforward formulations and strong online presence make them a go-to brand for natural skincare enthusiasts.

Natura&Co, the parent company of The Body Shop and Aesop, emphasizes sustainability and ethical sourcing in its tea-based skincare offerings. Their commitment to clean beauty and eco-friendly practices positions them well among environmentally conscious consumers.

ORGANIC TEA COSMETICS specializes in tea-infused skincare, with a range of products formulated using green, white, and black tea extracts. Their focus on eco-friendly packaging further appeals to a sustainability-driven audience.

100% PURE leverages tea extracts in its cruelty-free, natural skincare lines, aligning with rising consumer demand for ethical beauty options.

Unilever has expanded its premium skincare portfolio by integrating green tea-based products, reflecting a strategic shift towards natural and effective skincare solutions.

Lu Ming Tang offers luxury tea-based skincare blending French elegance with Chinese tea rituals, targeting consumers who value holistic, culturally inspired beauty routines.

Amorepacific uses green tea extensively in its products, combining traditional Korean beauty knowledge with advanced skincare science to maintain a strong global presence.

Avon incorporates tea tree oil in its affordable skincare lines, making natural solutions accessible to a broad customer base through its global distribution network.

Collectively, these companies are shaping the tea-based skincare market by prioritizing innovation, natural ingredients, and sustainability to align with evolving consumer preferences.

Top Key Players in the Market

  • SkinYoga
  • L’Oréal S.A.
  • ArtNaturals
  • Natura&Co
  • ORGANIC TEA COSMETICS
  • 100% PURE
  • Unilever
  • Lu Ming Tang
  • Amorepacific
  • Avon

Recent Developments

  • In January 2025, Unilever Ventures led a $5 million funding round for India’s RAS Luxury Skincare, aiming to boost the brand’s global presence and product innovation. The investment marks a strategic move into the clean beauty and wellness segment in India.
  • In December 2024, L’Oréal Groupe acquired Korean skincare brand Dr.G, strengthening its footprint in Asia’s premium dermatological skincare market. The deal highlights L’Oréal’s continued interest in science-backed, doctor-developed beauty products.
  • In October 2024, Chinese beauty conglomerate S’Young Group acquired luxury skincare line RéVive, known for its bio-renewal technology. This acquisition aligns with S’Young’s strategy to bring high-end Western brands to China’s booming skincare market.

Report Scope


Source link

11 04, 2025

Fartcoin Price Prediction & Analysis: Solana Meme Coin Surges 20% Today As Analysts Eye $1 Target

By |2025-04-11T15:07:39+02:00April 11, 2025|Crypto News, News|0 Comments

TLDR

  • Fartcoin (FART) price surged 20% today and 80% over the week
  • Currently trading at $0.8416 with a market cap of $841.89M
  • Shows a cup-and-handle formation indicating bullish reversal
  • Analysts predict targets between $1-$1.2 in the short term
  • Rising open interest with majority in long positions shows investor confidence

Fartcoin, one of the most popular Solana-based meme coins, has seen its price jump 20% today despite the broader crypto market downturn. The token is now trading at $0.8416, representing a weekly gain of approximately 80%.

The surge comes as investor interest returns to the token, evidenced by rising open interest data. Market analysts are now watching closely to see if FART can reach the $1 milestone in the coming days.

With a current market capitalization of $841.89 million, Fartcoin has established itself as a notable player in the meme coin sector. Its unique name has helped catch investor attention in a crowded marketplace.

Fartcoin
FARTCOIN Price

This price action stands in stark contrast to most other cryptocurrencies, which have been experiencing downward pressure recently. Even other popular meme coins have struggled, making FART’s performance particularly noteworthy.

Technical Analysis Shows Strong Reversal Pattern

Technical analysts point to a textbook cup-and-handle formation on Fartcoin’s 4-hour chart. This pattern typically signals a bullish reversal after a prolonged downtrend.

The token reached a low of $0.20 during its bottoming process before completing five impulsive waves, confirming the reversal pattern that traders look for.

Fibonacci retracement levels drawn from the previous high of $2.72 to the local bottom of $0.20 indicate current resistance at $0.80, followed by $1.16. These levels align with typical correction targets after extended bearish markets.


The Relative Strength Index (RSI) shows continued strength with higher lows, suggesting momentum remains intact. However, the asset is approaching overbought territory.

This might lead to brief corrections before pushing toward higher levels.

Liquidation Data Supports Bullish Outlook

Data from Coinglass indicates that shorts are being liquidated, forcing traders to rebuy the asset and further pushing up the price.

The majority of capital is placed in long positions, revealing investors’ confidence in FART’s potential for additional gains.

This liquidation pattern often fuels continued price movement in the direction of the trend, providing technical support for the bullish thesis.

Some market participants have noted that this surge in Fartcoin coincides with renewed interest in other Solana-based meme coins, including Bonk and Dogwifhat, which have also seen price increases.

The crypto community speculates that this could mark a recovery of investor interest in these previously struggling digital assets.

Price Targets and Predictions

Various crypto analysts anticipate further upside for the Solana meme coin. With FART having previously reached a high of $2.61 three months ago, a $1 target appears feasible to many observers.

Some analysts predict a near-term target of $1.2, based on the breakout from horizontal resistance and continued bullish momentum amid high trading volume.

More optimistic price forecasts suggest FART could reach as high as $10 during the next major crypto bull run. These predictions are based on the view that Fartcoin has bottomed out and is now consolidating above key breakout levels.

Elliott Wave analysis suggests FART is currently within wave (v) of a higher-degree impulse. Projected targets for this wave fall between $0.85 and $0.98, aligning well with higher timeframe resistance zones.

However, market uncertainty remains due to external factors, including potential impacts from ongoing trade tensions under the Trump administration. These geopolitical concerns continue to influence investor sentiment across all asset classes.

For now, the short-term outlook for Fartcoin appears positive, with technical indicators and market sentiment supporting continued upward momentum. Traders will be watching the $1 psychological level closely in the coming days.

Source link

11 04, 2025

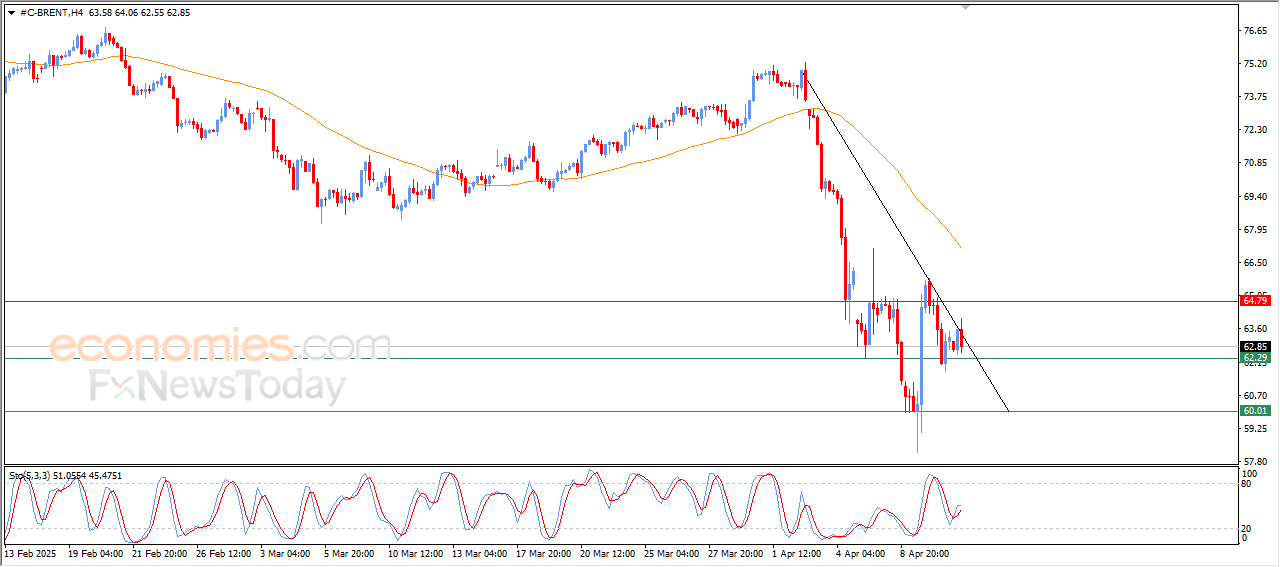
Brent Crude Oil Price Forecast Update – 11-04-2025

By |2025-04-11T13:13:44+02:00April 11, 2025|Forex News, News|0 Comments


The EURUSD price continues the rise during its recent intraday trading, amid the strong dominance of the main upward trend. The pair’s recent rise came despite the emergence of negative signals on the Relative Strength Index (RSI) indicators, after reaching highly overbought levels, which highlights the strength of this positive trend.

To get our more detailed analysis and 100% accurate signals provided by Best Trading Signal, subscribe to Economies.com VIP Club through the link below!


Source link

11 04, 2025

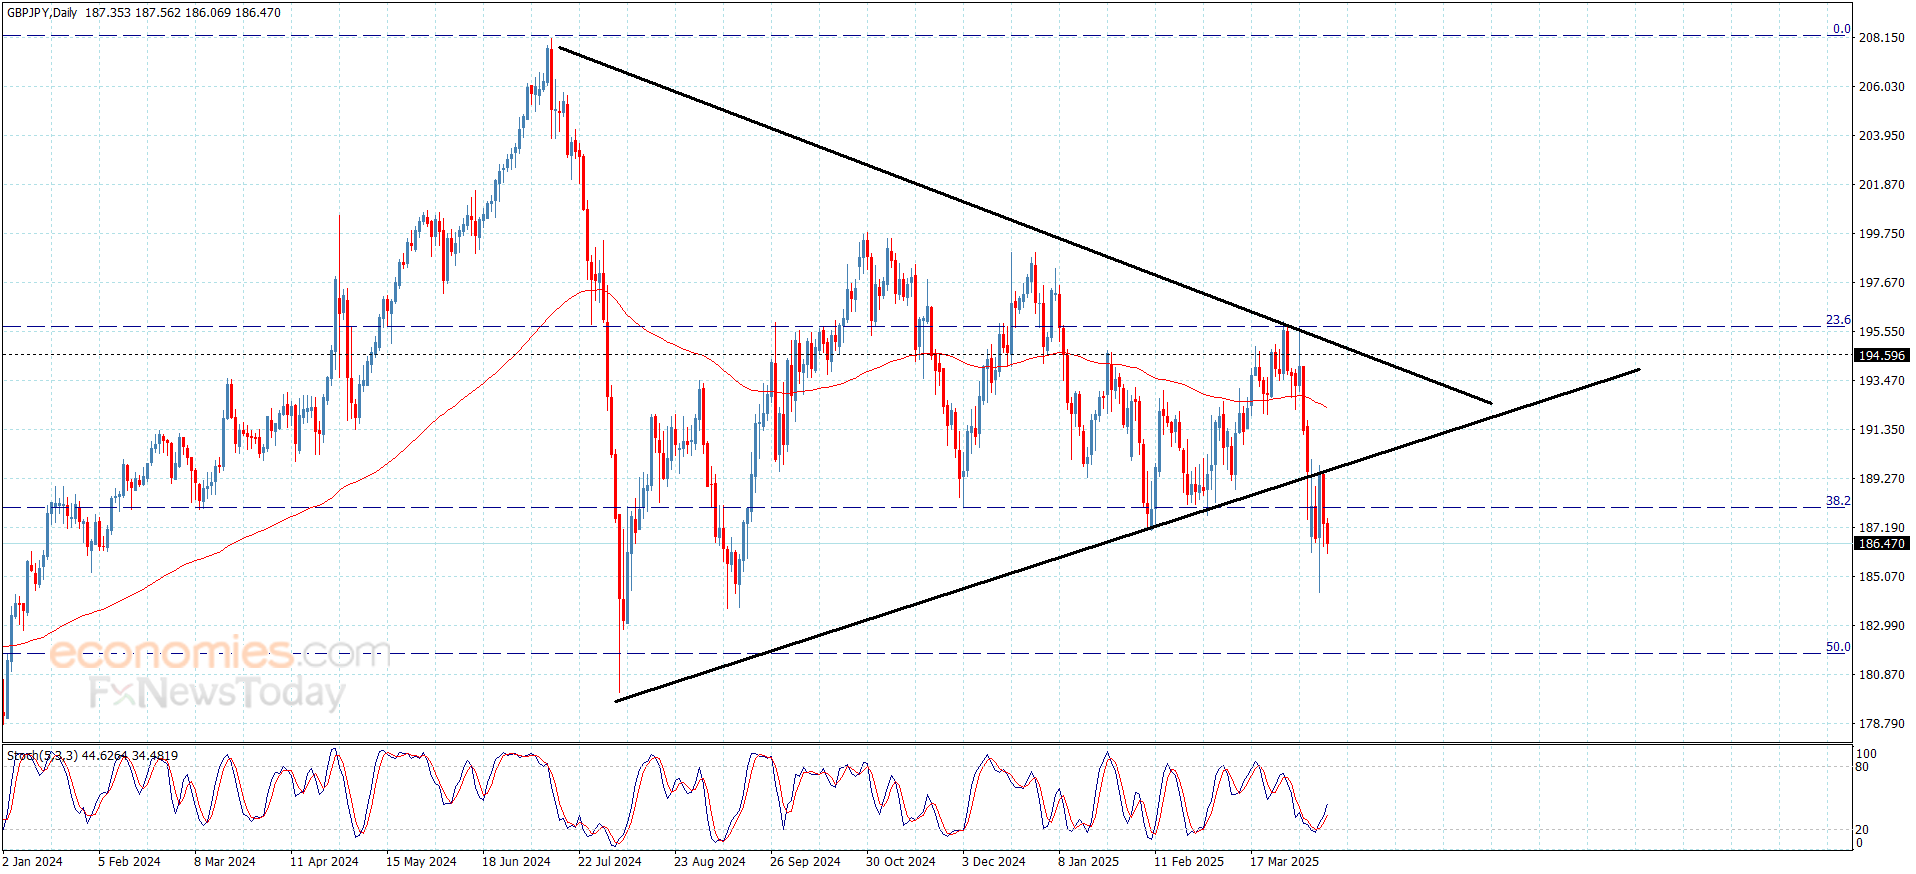
The GBPJPY achieves the negative targets– Forecast today – 11-4-2025.

By |2025-04-11T13:10:33+02:00April 11, 2025|Forex News, News|0 Comments

Copper price didn’t move anything since yesterday’s trading, delaying the bullish rally by its repeated fluctuation below 38.2%Fibonacci correction level, which represents an intraday obstacle by its stability near $4.4000.


The continuation of stochastic attempts to provide positive momentum and the repeated stability above the critical support at $4.000, these factors make us keep the bullish suggestion, to expect the mentioned obstacle and holding above it, targeting extra positive stations that begin at $4.5600 and $4.6800.


The expected trading range for today is between $4.2300 and $4.5600


Trend forecast: Bullish


Source link

11 04, 2025

Gummy Supplements Market Innovation: Flavor, Function,

By |2025-04-11T13:07:44+02:00April 11, 2025|Dietary Supplements News, News|0 Comments


Gummy Supplements Market

Global Gummy Supplements Market reached US$ 17,057.5 million in 2023 and is expected to reach US$ 35,222.5 million by 2031, growing with a CAGR of 11.3% during the forecast period 2024-2031.

Gummy Supplements Market report, published by DataM Intelligence, provides in-depth insights and analysis on key market trends, growth opportunities, and emerging challenges. Committed to delivering actionable intelligence, DataM Intelligence empowers businesses to make informed decisions and stay ahead of the competition. Through a combination of qualitative and quantitative research methods, it offers comprehensive reports that help clients navigate complex market landscapes, drive strategic growth, and seize new opportunities in an ever-evolving global market.

Get a Free Sample PDF Of This Report (Get Higher Priority for Corporate Email ID):- https://datamintelligence.com/download-sample/gummy-supplements-market?kb

Gummy supplements are chewable dietary supplements formulated in a candy-like format, offering a tasty and convenient alternative to traditional pills or capsules. They are popular for delivering essential nutrients such as vitamins, minerals, omega-3s, and probiotics, especially among children and adults seeking easier consumption.

List of the Key Players in the Gummy Supplements Market:

Amway Corp., Bayer AG, Haleon Group of Companies, Nestle, Hero Nutritionals, Inc., Unilever, Herbaland USA, Nature’s Truth, and Otsuka Pharmaceutical Co., Ltd.

Industry Development:

In May 2024, NOW Foods, a prominent natural products company, introduced an omega-3 fish oil gummy powered by ConCordix technology. Crafted for both adults and children aged four and above, each passionfruit-flavored gummy delivers 750mg of fish oil, including 300mg of EPA and 225mg of DHA. The product is now available across the U.S. and Canada through natural health food retailers and online marketplaces.

Growth Forecast Projected:

The Global Gummy Supplements Market is anticipated to rise at a considerable rate during the forecast period, between 2024 and 2031. In 2023, the market is growing at a steady rate, and with the rising adoption of strategies by key players, the market is expected to rise over the projected horizon.

Research Process:

Both primary and secondary data sources have been used in the global Gummy Supplements Market research report. During the research process, a wide range of industry-affecting factors are examined, including governmental regulations, market conditions, competitive levels, historical data, market situation, technological advancements, upcoming developments, in related businesses, as well as market volatility, prospects, potential barriers, and challenges.

Make an Enquiry for purchasing this Report @ https://www.datamintelligence.com/enquiry/gummy-supplements-market?kb

Segment Covered in the Gummy Supplements Market:

By Type: Vitamins, Minerals, Omega Fatty Acids, Collagen, Other Types

By End-User: Adults, Kids

By Distribution Channel: Supermarkets & Hypermarkets, Convenience Stores, Online Retail Stores, Pharmacies and Drug Stores, Others

Regional Analysis for Gummy Supplements Market:

The regional analysis of the Gummy Supplements Market covers key regions including North America, Europe, Asia Pacific Middle East and Africa and South America. The North America with a focus on the U.S., Canada, and Mexico; Europe, highlighting major countries like the U.K., Germany, France, and Italy, along with other nations in the region; Asia-Pacific, covering India, China, Japan, South Korea, and Australia, among others; South America, with emphasis on Colombia, Brazil, and Argentina; and the Middle East & Africa, which includes Saudi Arabia, the U.A.E., South Africa, and other countries. This comprehensive regional breakdown helps identify unique market trends and growth opportunities specific to each area.

⇥ North America (U.S., Canada, Mexico)

⇥ Europe (U.K., Italy, Germany, Russia, France, Spain, The Netherlands and Rest of Europe)

⇥ Asia-Pacific (India, Japan, China, South Korea, Australia, Indonesia Rest of Asia Pacific)

⇥ South America (Colombia, Brazil, Argentina, Rest of South America)

⇥ Middle East & Africa (Saudi Arabia, U.A.E., South Africa, Rest of Middle East & Africa)

Benefits of the Report:

➡ A descriptive analysis of demand-supply gap, market size estimation, SWOT analysis, PESTEL Analysis and forecast in the global market.

➡ Top-down and bottom-up approach for regional analysis

➡ Porter’s five forces model gives an in-depth analysis of buyers and suppliers, threats of new entrants & substitutes and competition amongst the key market players.

➡ By understanding the value chain analysis, the stakeholders can get a clear and detailed picture of this Market

Speak to Our Analyst and Get Customization in the report as per your requirements: https://datamintelligence.com/customize/gummy-supplements-market?kb

People Also Ask:

➠ What is the global sales, production, consumption, import, and export value of the Gummy Supplements market?

➠ Who are the leading manufacturers in the global Gummy Supplements industry? What is their operational status in terms of capacity, production, sales, pricing, costs, gross margin, and revenue?

➠ What opportunities and challenges do vendors in the global Gummy Supplements industry face?

➠ Which applications, end-users, or product types are expected to see growth? What is the market share for each type and application?

➠ What are the key factors and limitations affecting the growth of the Gummy Supplements market?

➠ What are the various sales, marketing, and distribution channels in the global industry?

Contact Us –

Company Name: DataM Intelligence

Contact Person: Sai Kiran

Email: Sai.k@datamintelligence.com

Phone: +1 877 441 4866

Website: https://www.datamintelligence.com

About Us –

DataM Intelligence is a Market Research and Consulting firm that provides end-to-end business solutions to organizations from Research to Consulting. We, at DataM Intelligence, leverage our top trademark trends, insights and developments to emancipate swift and astute solutions to clients like you. We encompass a multitude of syndicate reports and customized reports with a robust methodology.

Our research database features countless statistics and in-depth analyses across a wide range of 6300+ reports in 40+ domains creating business solutions for more than 200+ companies across 50+ countries; catering to the key business research needs that influence the growth trajectory of our vast clientele.

This release was published on openPR.


Source link

11 04, 2025

Top Analyst Projects Here’s How Dogecoin Price Could Surge 364% to $0.67

By |2025-04-11T13:06:30+02:00April 11, 2025|Crypto News, News|0 Comments

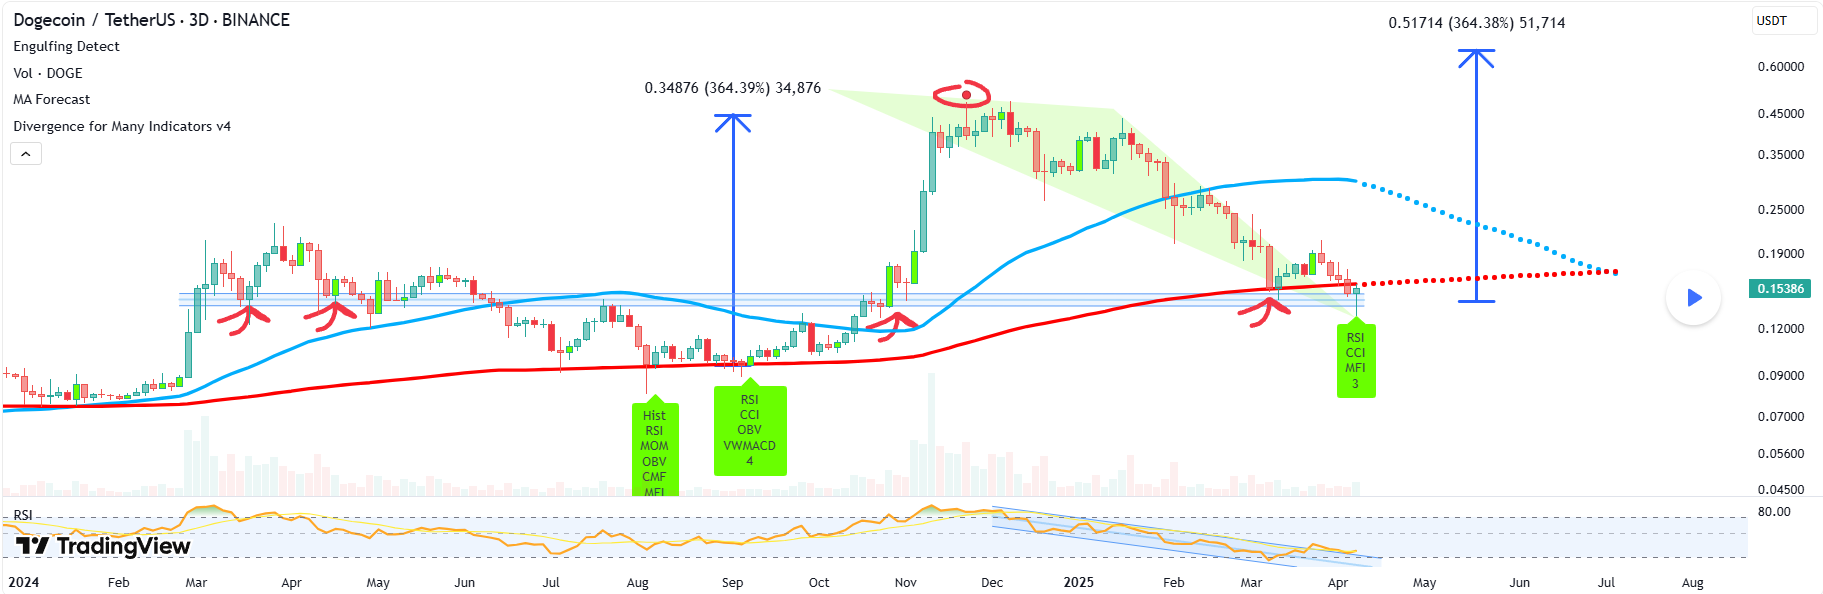
A notable TradingView analyst projects a 364% Dogecoin rally, citing historical patterns and RSI resistance breakout.

Dogecoin’s recent market activity points to increased volatility as short-term price fluctuations continue to unsettle investors. The asset recorded a notable decline from April 5 to April 7, reaching a low of $0.13. Although it recovered slightly on April 10, the price fell again to $0.14 before briefly rebounding to $0.15.

The memecoin’s performance indicators reflect this short-term bearish trend, with a 7-day drop of 5.8%, a 14-day loss of 13.8%, and a 30-day decline of 6.9%. Despite these negative metrics, technical analysts suggest that Dogecoin might be approaching a pivotal inflection point, potentially priming for a major price move.

Technical Setup Signals Possible Upside

A TradingView analyst, with the label without_worries, shares a technical formation based on a 3-day candlestick chart that resembles a breakout structure observed in earlier price surges. He notes a confluence of indicators, including support at historical resistance levels and a breakout in both price action and RSI resistance.

Top Analyst Projects Here’s How Dogecoin Price Could Surge 364% to alt=
Dogecoin Price Prediction

In addition, the chart shows bullish divergence patterns, which, according to the analyst, mirror conditions preceding previous upward trends.

Notably, the same analyst predicted earlier that DOGE could witness a crash when prices were high. This thesis was validated when Dogecoin dropped 70% to the $0.2 level in February. 

He now sees potential for an extended upside of over 364%, targeting a long-term price of around $0.67 if current signals evolve into a sustained trend. He also encourages buying dip, especially now that there is blood on the street.

Support at $0.14 Remains Critical 

Meanwhile, another analyst, MonoCoinSignal, in a separate assessment, underlines Dogecoin’s relative stability during broader market declines. His report, published Monday, observes that Dogecoin registered a modest 0.11% increase even as the global crypto market lost 4.4% in value. This, he argues, reflects the asset’s resilience under current market pressure.

Despite that, MonoCoinSignal emphasizes that mixed momentum persists. He notes that while whale accumulation continues to support a bullish outlook, macroeconomic concerns—especially related to Donald Trump’s ongoing trade policy shifts—may limit near-term price growth. He identifies $0.14 as a critical support level, warning that any sustained break below could reverse recent gains.

Short-Term Resistance at $0.15

In terms of immediate price action, the path to $0.16 remains contingent on Dogecoin breaking the $0.15 resistance with a strong trading volume.

MonoCoinSignal states that a confirmed move beyond $0.16 could set the stage for further gains, potentially allowing DOGE to revisit the $0.20 mark.

DisClamier: This content is informational and should not be considered financial advice. The views expressed in this article may include the author’s personal opinions and do not reflect The Crypto Basic opinion. Readers are encouraged to do thorough research before making any investment decisions. The Crypto Basic is not responsible for any financial losses.

Source link

11 04, 2025

Trump Strikes Down IRS DeFi Rule

By |2025-04-11T11:25:31+02:00April 11, 2025|News, NFT News|0 Comments


U.S. President Donald Trump has signed the first-ever cryptocurrency-focused bill into law, marking a huge legislative win for the digital asset industry. Investors are calling it a groundbreaking move. 

Introduced by Rep. Mike Carey (R-Ohio) and Sen. Ted Cruz (R-Texas), the bill repeals a controversial IRS rule that had extended the definition of a “broker” to include DeFi platforms and other non-custodial crypto services.

This decision is celebrated as a turning point for the industry, which has long felt burdened by unclear and overreaching regulations.

What Was the IRS Rule About?

The now-repealed rule, finalized at the end of 2024, would have forced decentralized finance (DeFi) platforms, wallet providers, and even front-end interfaces of blockchain protocols to gather user information and report transactions to the IRS using Form 1099.

Critics argued that the rule made little sense for platforms that don’t hold customer funds. Instead, it posed unnecessary challenges for innovation and risked overloading the IRS with a mountain of compliance data it isn’t prepared to handle.

Congressman Carey: “This Rule Hinders Innovation”

Rep. Mike Carey strongly opposed the rule, calling it “misguided” and harmful to American tech innovation. In a public statement, he explained that the IRS should focus on its existing responsibilities to taxpayers, not chase new regulatory powers that create confusion.

He also noted this isn’t just another bill, it’s the first tax-related Congressional Review Act of Disapproval ever signed into law, making it a milestone for crypto and tax legislation.

The Bill’s Journey Through Congress

Known officially as H.J. Res.25, the resolution saw solid support in both chambers. It passed the Senate on March 4, 2025, and the House on March 11. Because of its connection to federal budgeting, the bill required one more vote in the Senate, which happened on March 26. After that, it landed on the president’s desk and was signed into law.

The White House had already signaled approval, describing the IRS rule as a “midnight regulation” rushed in during the final days of the Biden administration.

A Shift in the Crypto Regulatory Landscape

This legislative triumph is not taking place in isolation. The broader Washington context is changing the crypto industry. The SEC, under interim chair Mark Uyeda, has recently dropped cases against major crypto players like Coinbase, Gemini, and Kraken.

As a companion action, the Department of Justice shut down its National Cryptocurrency Enforcement Team on April 8, admitting that it had made strategic errors.

And in another big shift, Paul Atkins, a long-time SEC commissioner known for supporting crypto innovation, is set to become the new SEC chair. With Atkins at the helm, many in the industry are hoping for a more balanced, innovation-friendly approach from regulators.


Source link

11 04, 2025

WTI Crude Oil Forecast Today 11/04: Gravity Returns (Video)

By |2025-04-11T11:12:32+02:00April 11, 2025|Forex News, News|0 Comments


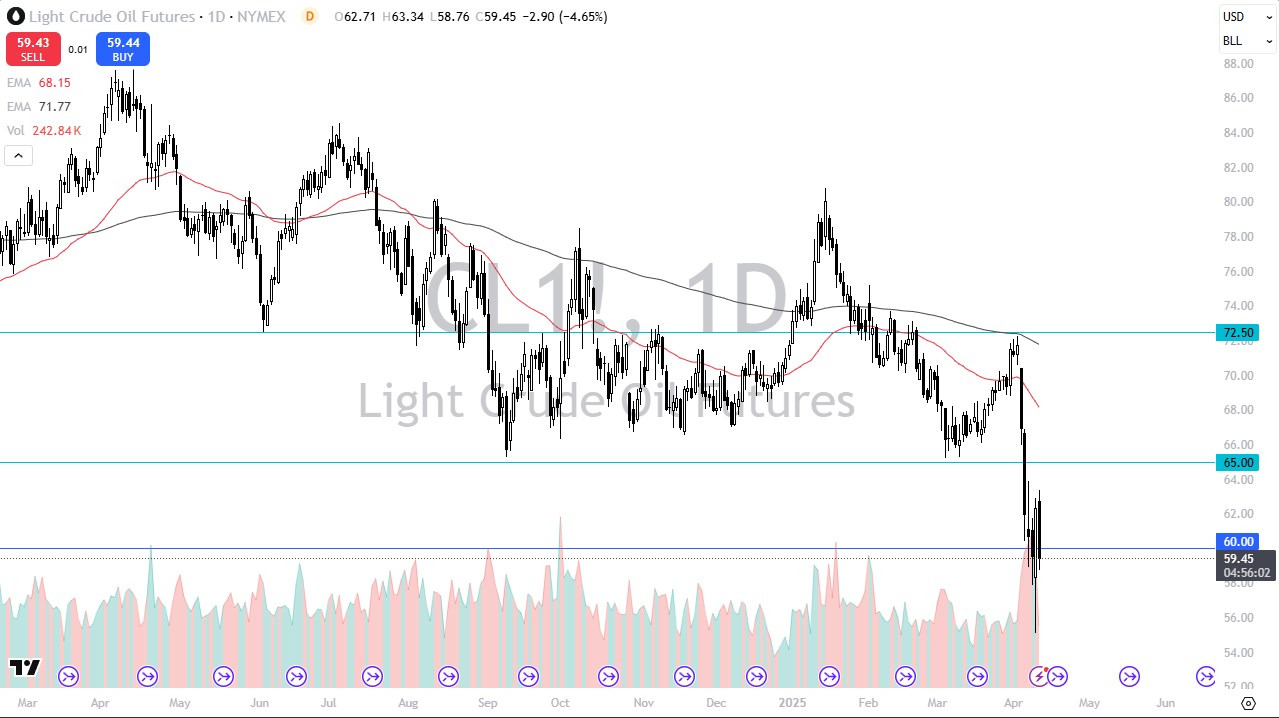
  • It’s been a pretty rough day during the trading session on Thursday for the crude oil market and you can see that the market started falling in pre-market and the US China risk continue to be a major issue.
  • After all, if there is a lack of economic movement, there’s going to be a lack of demand for crude oil. It makes perfect sense.

The reprieve that we got during the trading session on Thursday, quite frankly, I think was a bit of a short covering rally and I think a lot of traders are starting to look at this and go, well, has anything actually changed? Maybe things aren’t as bad as they could be, but the real trade tariff issue right now between the United States and China is going to cause a lot of major problems.

Sellers Are Thankful For this Chance

The market bouncing from here should be thought of as a gift for sellers to get involved in, but I really don’t like the idea of trying to catch a falling knife here. The best case scenario for crude oil at the moment is going to be spending a lot of time around the $60 level. For what it is worth, I was watching the futures market earlier and there was definitely some type of bid right around the $60 level. So, we’ll have to watch that closely. As I record this video, we are down about 50 cents below that level, but we have also bounced from the lows of the day. So, all things being equal, this is a market that I think is in transition and we will have to pay close attention to whether or not it can pick itself up off the floor. Job one for the bulls will be to go sideways for a while. If we break down below the $55 level, look out below. Crude oil, probably just craters.

Ready to trade daily crude oil price analysis? We’ve shortlisted the best Forex Oil trading brokers in the industry for you.


Source link

Go to Top