About Editorial team of BIPNs

Main team of content of bipns.com. Any type of content should be approved by us.
24 03, 2026

Bullish pressure wanes ahead of US PMI data

By |2026-03-24T19:16:13+02:00March 24, 2026|Forex News, News|0 Comments

EUR/USD reversed its direction following a bearish opening to the week and closed in positive territory on Monday. The pair stays in a consolidation phase below 1.1600 on Tuesday as investors await Purchasing Managers’ Index (PMI) data from the US, while keeping a close eye on headlines coming out of the Middle East.

Euro Price Today

The table below shows the percentage change of Euro (EUR) against listed major currencies today. Euro was the weakest against the US Dollar.

USD EUR GBP JPY CAD AUD NZD CHF
USD 0.28% 0.36% 0.19% 0.17% 0.80% 0.71% 0.14%
EUR -0.28% 0.05% -0.07% -0.11% 0.50% 0.42% -0.14%
GBP -0.36% -0.05% -0.13% -0.16% 0.45% 0.38% -0.19%
JPY -0.19% 0.07% 0.13% -0.01% 0.60% 0.51% -0.04%
CAD -0.17% 0.11% 0.16% 0.01% 0.61% 0.52% -0.03%
AUD -0.80% -0.50% -0.45% -0.60% -0.61% -0.08% -0.67%
NZD -0.71% -0.42% -0.38% -0.51% -0.52% 0.08% -0.56%
CHF -0.14% 0.14% 0.19% 0.04% 0.03% 0.67% 0.56%

The heat map shows percentage changes of major currencies against each other. The base currency is picked from the left column, while the quote currency is picked from the top row. For example, if you pick the Euro from the left column and move along the horizontal line to the US Dollar, the percentage change displayed in the box will represent EUR (base)/USD (quote).

Improving risk mood weighed on the US Dollar (USD) on Monday and helped EUR/USD gather bullish momentum after US President Donald Trump announced that they will postpone any military strikes against Iran’s power plants following “good and productive conversations.”

However, contradicting remarks from the Iranian side caused markets to turn cautious. Iran’s foreign ministry said that there was “no dialogue” between Tehran and Washington, while the White House acknowledged that the situation was “fluid” and added that “speculation about meetings should not be deemed as final until they are formally announced by the White House.” Highlighting the negative shift in risk mood, US stock index futures were last seen losing about 0.3% on the day.

On Tuesday, the data from Germany showed that the Composite PMI declined to 51.9 in March’s flash estimate from 53.2 in February, reflecting a loss of growth momentum in the private sector’s business activity. Similarly, the Composite PMI for the Eurozone fell to 50.5 from 51.9 in this period.

Assessing the sruvey’s findings, “the flash Eurozone PMI is ringing stagflation alarm bells as the war in the Middle East drives prices sharply higher while stifling growth,” said Chris Williamson, Chief Business Economist at S&P Global Market Intelligence.

Later in the day, the details of the US PMI surveys will be scrutinized by market participants. In case the publication highlights rising input costs because of high energy prices, the immediate reaction could support the USD and force EUR/USD to stay on the back foot.

Conversely, EUR/USD could turn north again, if risk flows return to markets, with Iran and US officially confirming ongoing negotiations to end the conflict and open the Strait of Hormuz.

EUR/USD Technical Analysis:

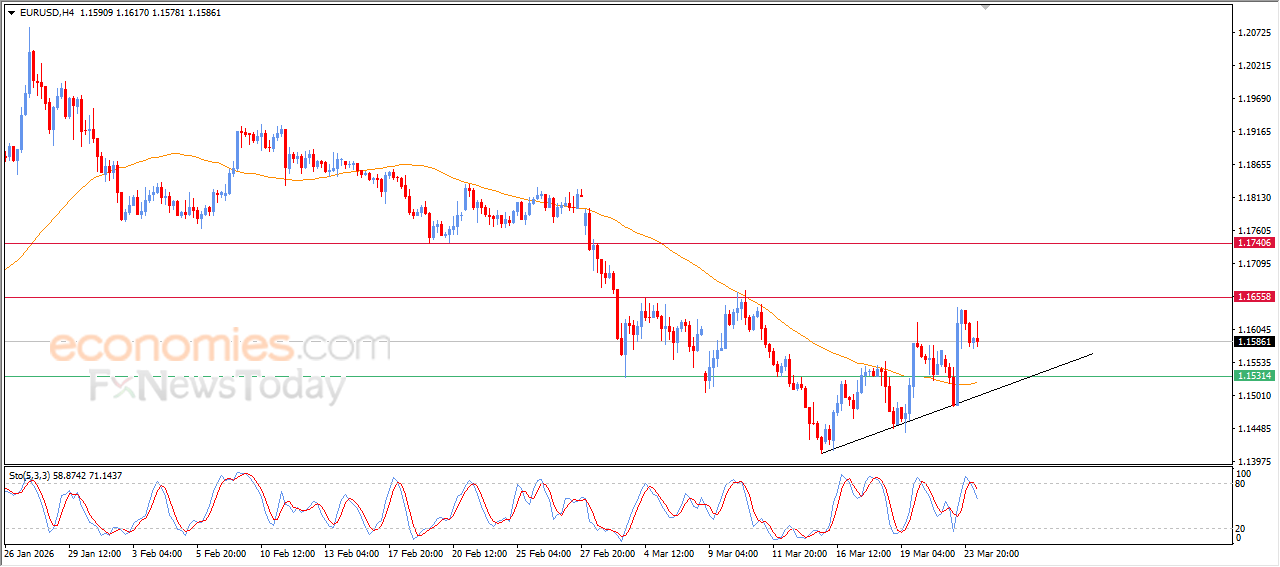
In the 4-hour chart, EUR/USD trades at 1.1582. The near-term bias is mildly bullish as the pair holds above the rising 20-period and 50-period Simple Moving Averages (SMAs), while remaining close to the 100-period SMA. Bollinger Bands have started to contracting as the price is retreating toward the mid-line, while the Relative Strength Index (RSI) hovers in the mid-50s, consistent with a bullish outlook that lacks momentum.

Immediate support sits at 1.1570 (100-period SMA), ahead of 1.1530-1.1520 (static level, 50-period SMA) and 1.1500 (static level, round level). On the upside, resistance is located near 1.1640, which coincides with the upper Bollinger Band, before 1.1670 (static level) and 1.1700 (200-period SMA).

(The technical analysis of this story was written with the help of an AI tool.)

Euro FAQs

The Euro is the currency for the 20 European Union countries that belong to the Eurozone. It is the second most heavily traded currency in the world behind the US Dollar. In 2022, it accounted for 31% of all foreign exchange transactions, with an average daily turnover of over $2.2 trillion a day.
EUR/USD is the most heavily traded currency pair in the world, accounting for an estimated 30% off all transactions, followed by EUR/JPY (4%), EUR/GBP (3%) and EUR/AUD (2%).

The European Central Bank (ECB) in Frankfurt, Germany, is the reserve bank for the Eurozone. The ECB sets interest rates and manages monetary policy.
The ECB’s primary mandate is to maintain price stability, which means either controlling inflation or stimulating growth. Its primary tool is the raising or lowering of interest rates. Relatively high interest rates – or the expectation of higher rates – will usually benefit the Euro and vice versa.
The ECB Governing Council makes monetary policy decisions at meetings held eight times a year. Decisions are made by heads of the Eurozone national banks and six permanent members, including the President of the ECB, Christine Lagarde.

Eurozone inflation data, measured by the Harmonized Index of Consumer Prices (HICP), is an important econometric for the Euro. If inflation rises more than expected, especially if above the ECB’s 2% target, it obliges the ECB to raise interest rates to bring it back under control.
Relatively high interest rates compared to its counterparts will usually benefit the Euro, as it makes the region more attractive as a place for global investors to park their money.

Data releases gauge the health of the economy and can impact on the Euro. Indicators such as GDP, Manufacturing and Services PMIs, employment, and consumer sentiment surveys can all influence the direction of the single currency.
A strong economy is good for the Euro. Not only does it attract more foreign investment but it may encourage the ECB to put up interest rates, which will directly strengthen the Euro. Otherwise, if economic data is weak, the Euro is likely to fall.
Economic data for the four largest economies in the euro area (Germany, France, Italy and Spain) are especially significant, as they account for 75% of the Eurozone’s economy.

Another significant data release for the Euro is the Trade Balance. This indicator measures the difference between what a country earns from its exports and what it spends on imports over a given period.
If a country produces highly sought after exports then its currency will gain in value purely from the extra demand created from foreign buyers seeking to purchase these goods. Therefore, a positive net Trade Balance strengthens a currency and vice versa for a negative balance.
Source link

24 03, 2026

Forecast update for EURUSD -24-03-2026.

By |2026-03-24T15:15:10+02:00March 24, 2026|Forex News, News|0 Comments


The GBPCAD ended the bullish corrective rebound by facing the resistance level at 1.8490, to form a strong obstacle against the attempt of resuming the bullish scenario, forcing it to provide sideways fluctuations near 1.8425.


Note that the stability of the moving average 55 above the current trading that might support the chances of renewing the negative attempts, which might target 1.8330 level reaching 1.8220, while the price success in breaching the resistance and holding above it will confirm its readiness to form strong bullish rally, to begin recording big gains that begin at 1.8550 and 1.8640.


The expected trading range for today is between 1.8330 and 1.8500


Trend forecast: Bearish


Source link

24 03, 2026

The GBPJPY achieves the initial target– Forecast today – 24-3-2026

By |2026-03-24T15:14:49+02:00March 24, 2026|Forex News, News|0 Comments

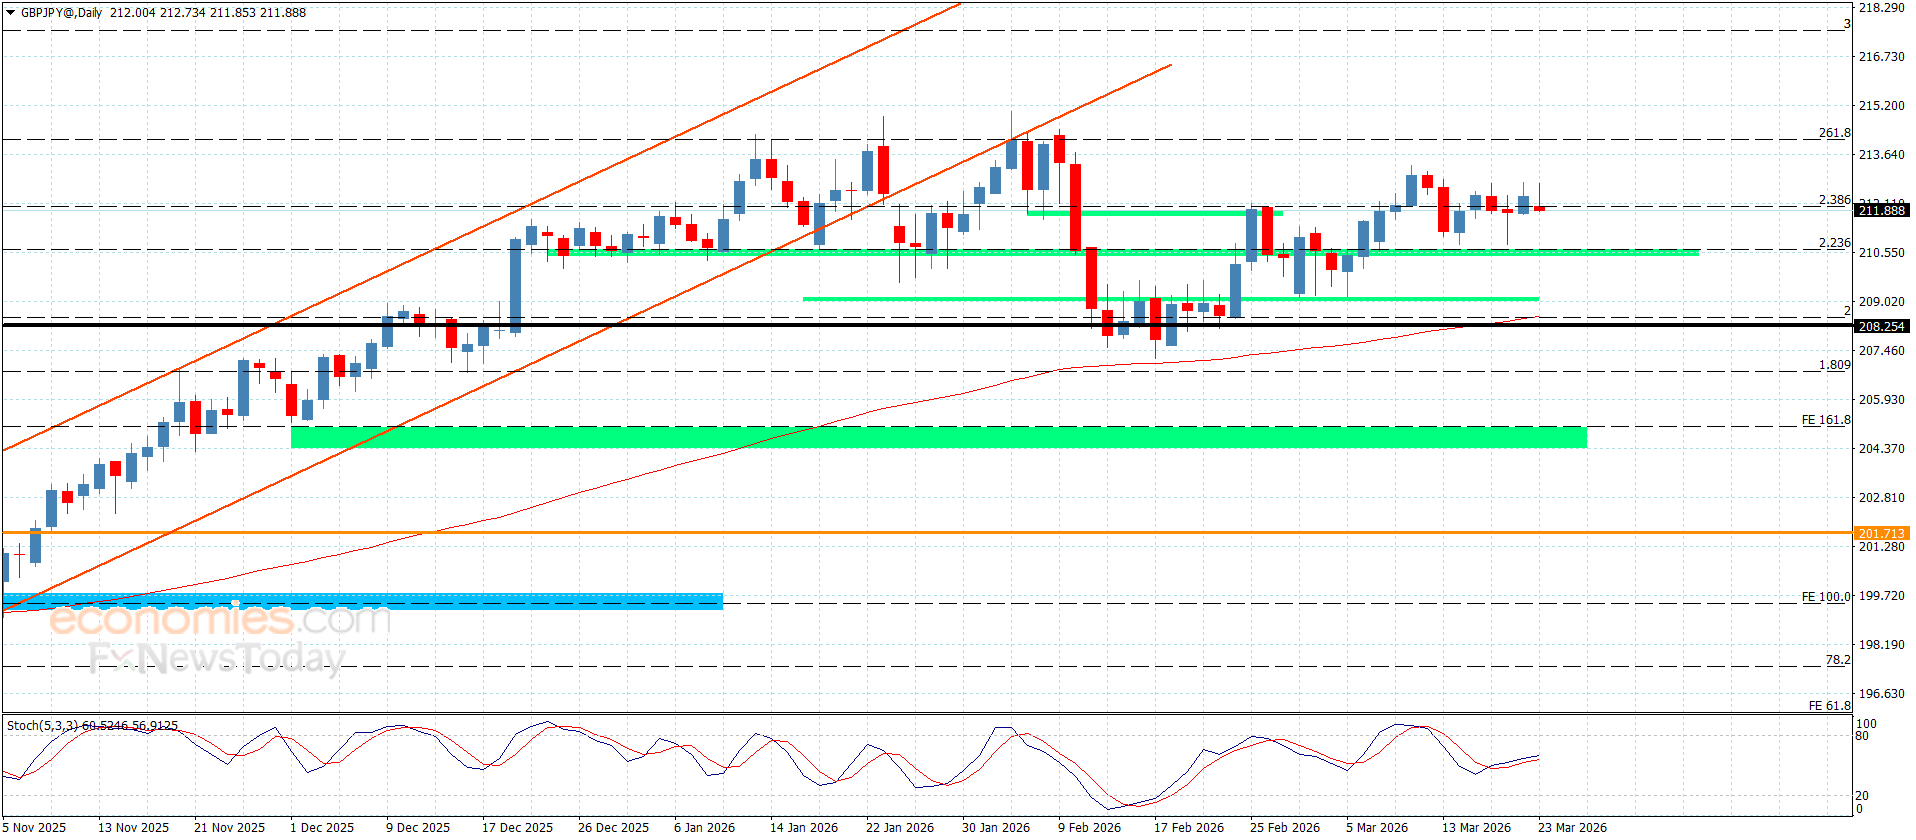
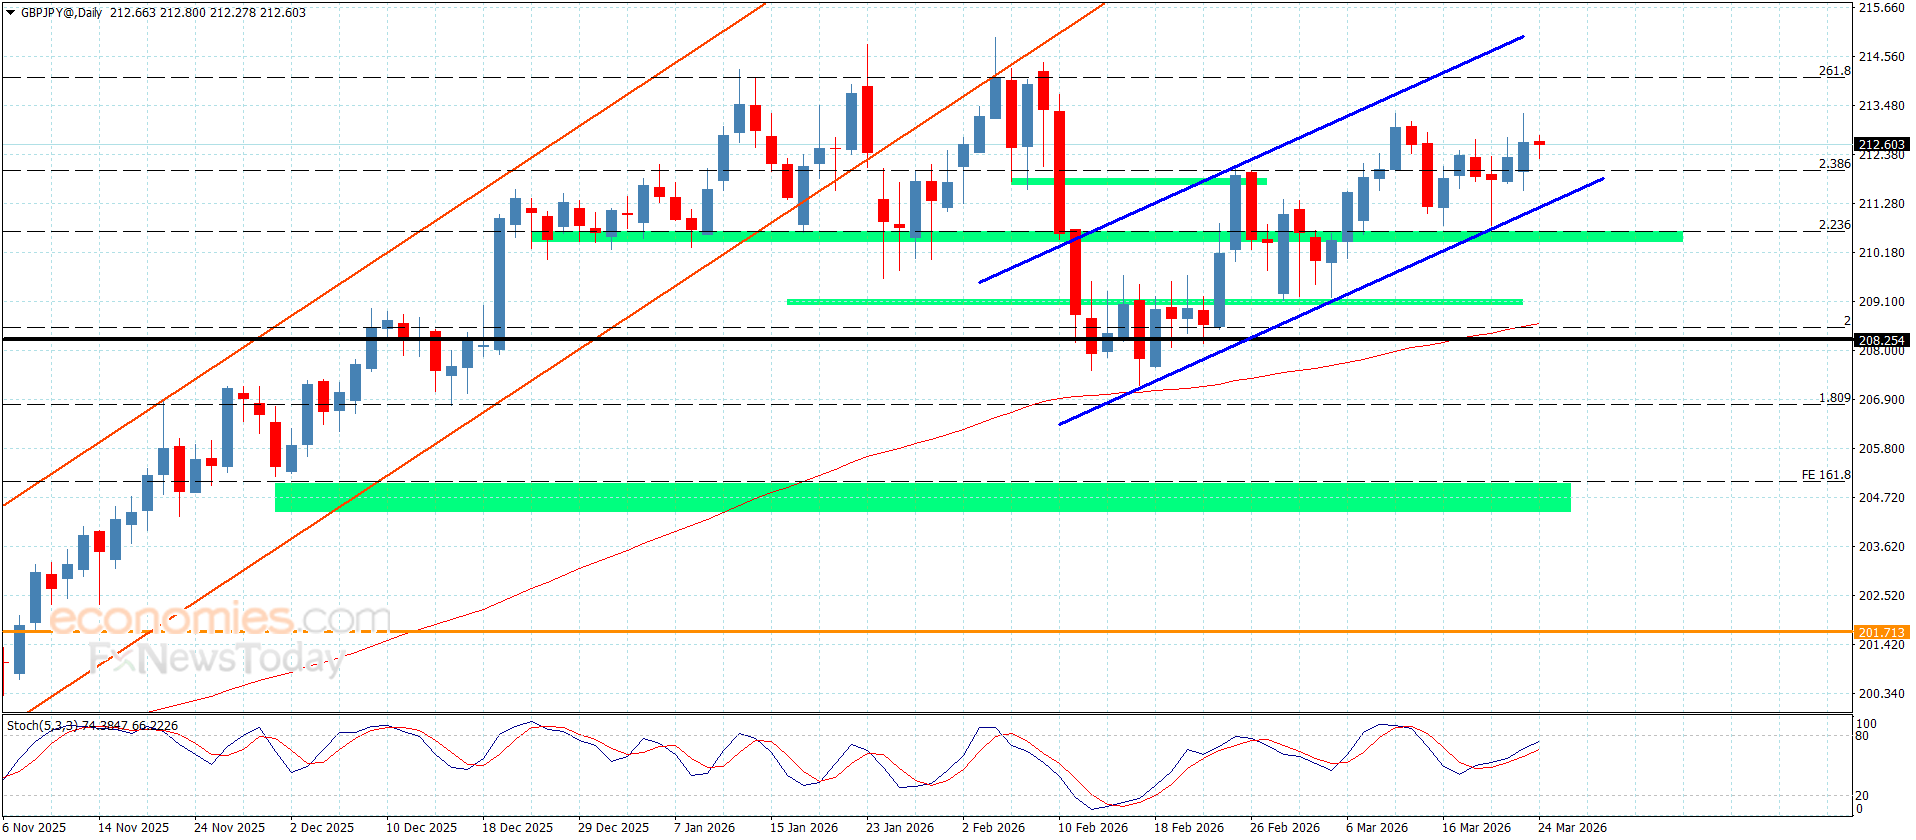
The GBPJPY pair confirmed the stability of the bullish scenario, due to its stability within the minor bullish channel’s levels, to form some bullish waves, to record the initial target by reaching 213.30 level, to rebound temporarily to settle near 212.50.


The stability above the bullish channel’s support towards 211.30, besides providing positive momentum by the main indicators makes us keep the bullish scenario, which might target 214.05 reaching 215.20 level to reach the current channel’s resistance.


The expected trading range for today is between 214.05 and 212.10


Trend forecast: Bullish


Source link

24 03, 2026

Copper price tests the broken support– Forecast today – 24-3-2026

By |2026-03-24T11:14:11+02:00March 24, 2026|Forex News, News|0 Comments


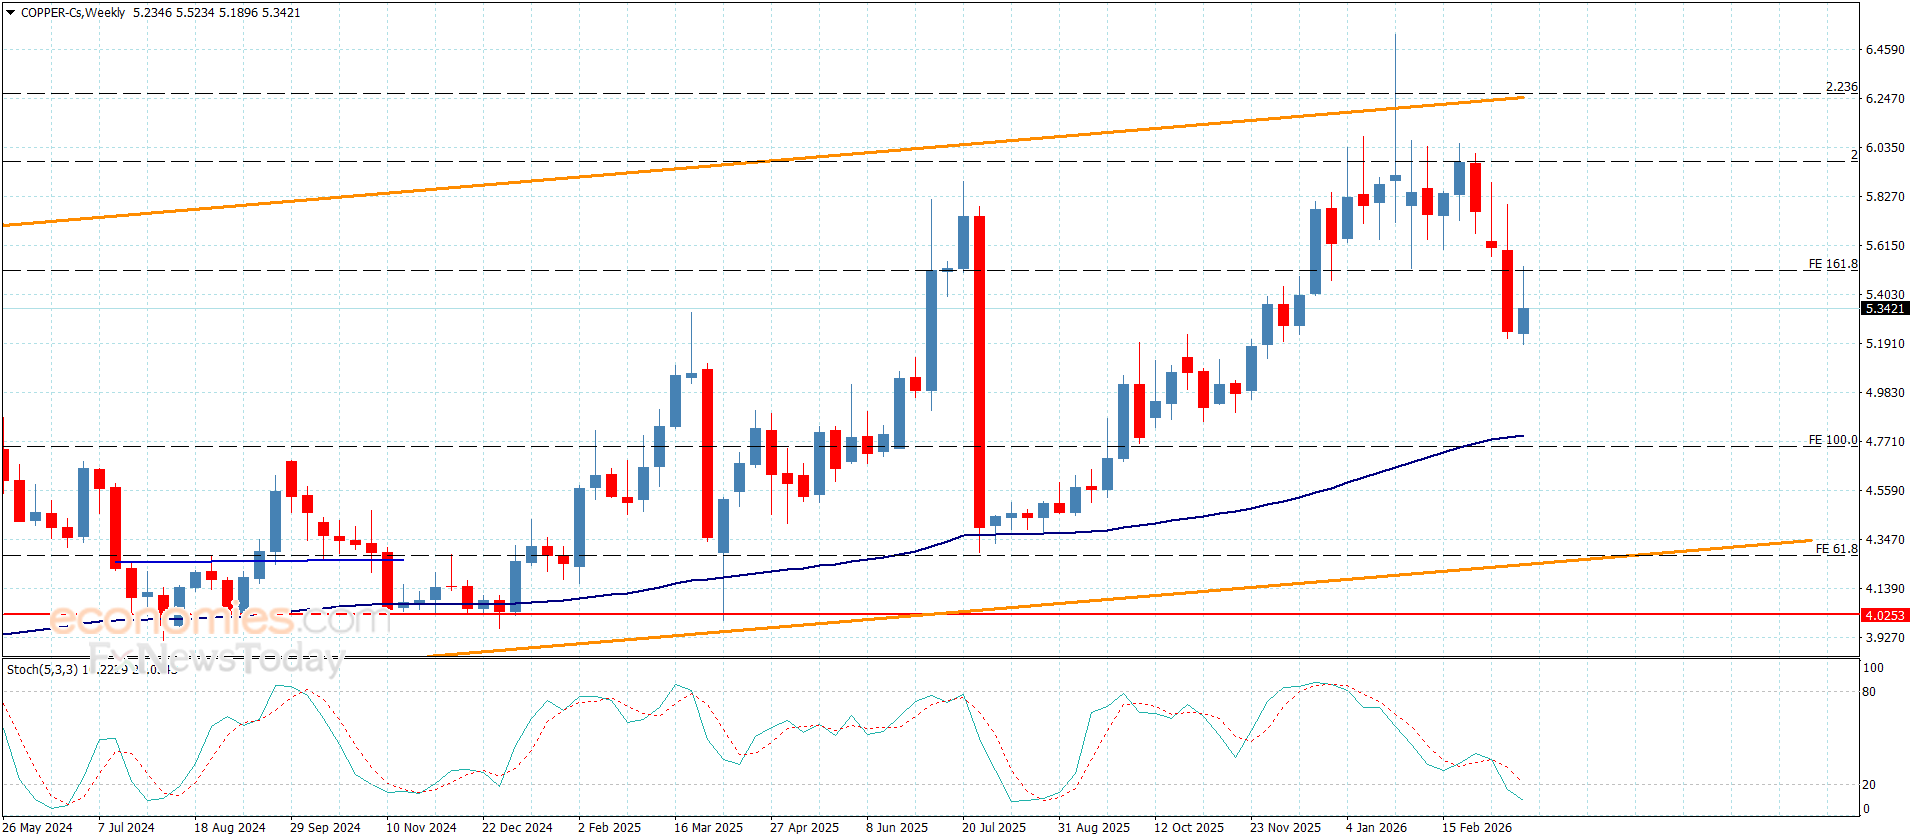
Copper price formed some positive trading in yesterday’s trading, to test the broken support that represents a strong resistance at $5.5100, bouncing quickly towards $5.3300 confirming the continuation of the previously suggested negative scenario.


Providing additional negative momentum by stochastic will help it to renew the negative attempts, to expect reaching $5.1500, attempting to press on the extra support near $4.9500.


The expected trading range for today is between $5.1500 and $5.4000


Trend forecast: Bearish


Source link

24 03, 2026

The EURJPY without any news– Forecast today – 24-3-2026

By |2026-03-24T11:13:01+02:00March 24, 2026|Forex News, News|0 Comments

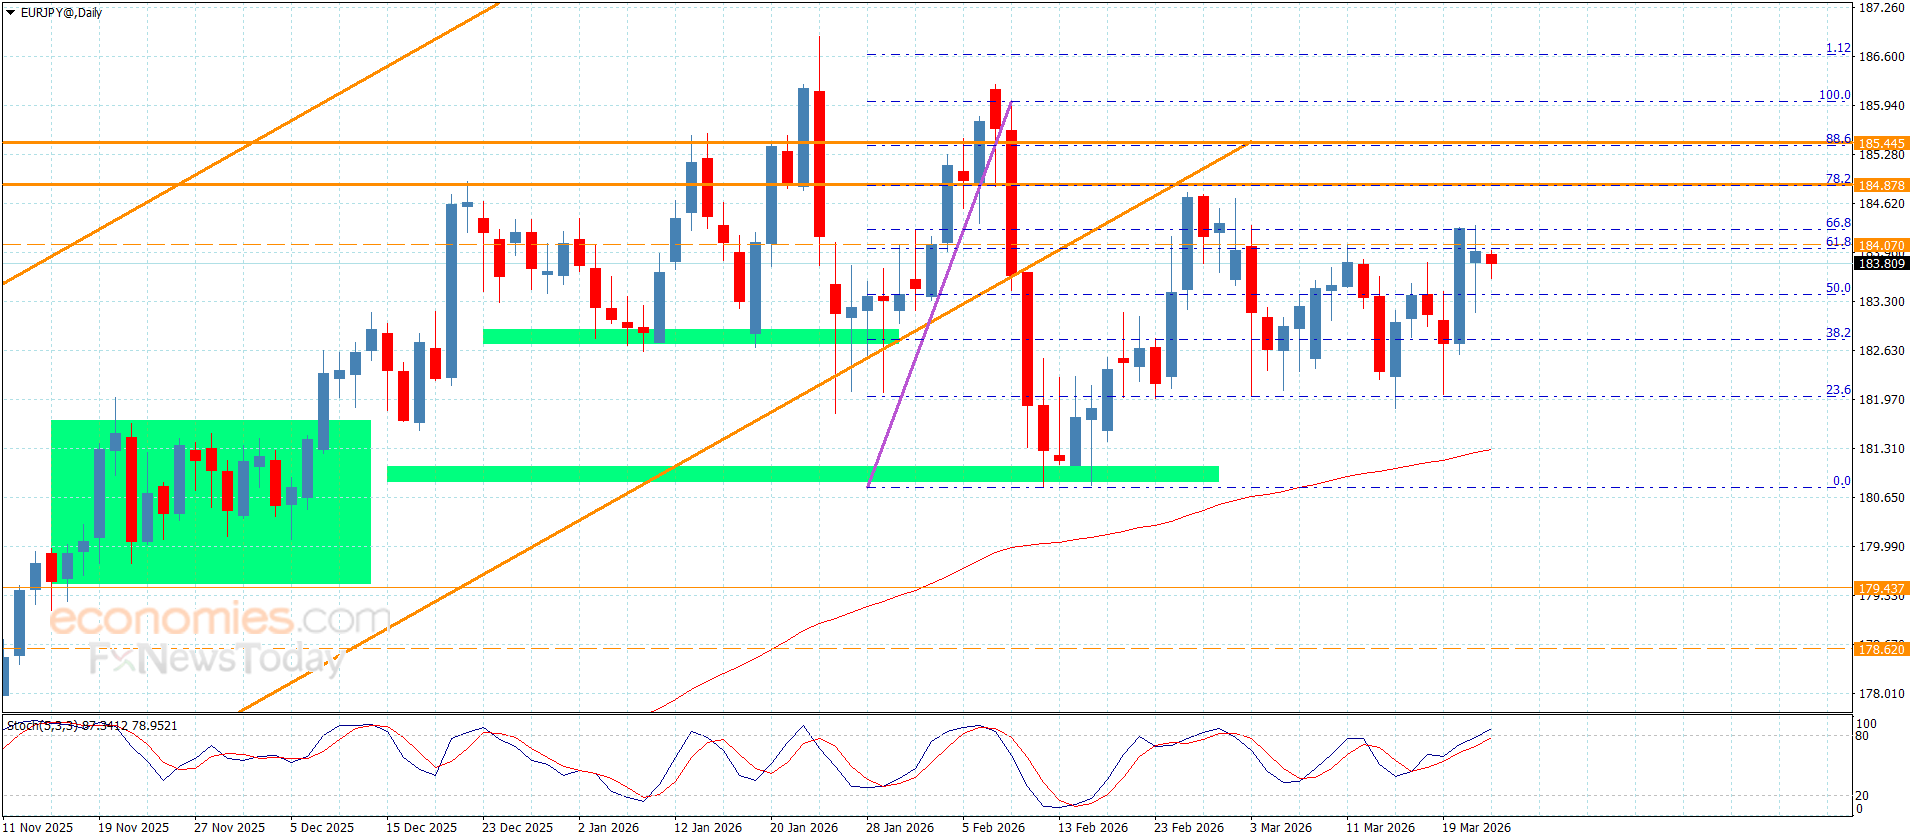
The EURJPY pair remains affected by the stability of the barrier at 184.20, which obstructs the attempts of reaching new positive stations by its stability, to form new sideways fluctuations by its stability near 183.75.


Note that the continuation of providing positive momentum by the main indicators, by the attempt of forming additional support at 183.35 level, these factors make us wait for breaching the barrier and holding above it, to confirm its readiness to record new gains that might begin at 184.80 and 185.45.


The expected trading range for today is between 183.40 and 184.80


Trend forecast: Bullish


Source link

24 03, 2026

The GBPJPY repeats the positive closes– Forecast today – 23-3-2026

By |2026-03-24T07:13:19+02:00March 24, 2026|Forex News, News|0 Comments


The GBPJPY pair faced negative pressures in the last trading, by providing new closes above 210.60 level, to fluctuate near 212.10, attempting to gather the required extra positive momentum to confirm the previously suggested bullish scenario.


The price needs to surpass 212.45 level, forming an intraday barrier in the last period, which allows it to form new bullish waves, to target the initial stations at 213.05 and 214.05, while its decline below 210.60 and providing negative close will force it to activate the negative movement, suffering several losses that might begin at 209.15.


The expected trading range for today is between 211.65 and 214.00


Trend forecast: Bullish


Source link

24 03, 2026

Advances to 158.75 amid bullish technical setup

By |2026-03-24T07:12:03+02:00March 24, 2026|Forex News, News|0 Comments

The USD/JPY pair attracts some dip-buyers following the previous day’s pullback of around 165 pips from the vicinity of its highest level since July 2024, and climbs to the 158.75-158.80 region during the Asian session on Tuesday.

The Japanese Yen (JPY) weakens in reaction to soft inflation figures, which showed that the National Consumer Price Index (CPI) fell below the Bank of Japan’s (BoJ) 2% target and to its lowest level since March 2022. The data further dampens hopes for an immediate interest rate hike by the central bank amid concerns that the war-driven surge in energy prices could weaken Japan’s economic growth.

Meanwhile, geopolitical uncertainties stemming from conflicts in the Middle East continue to fuel inflation fears, curbing bets for further interest rate cuts by the US Federal Reserve (Fed). This, in turn, triggers a fresh leg up in US Treasury bond yields, which, along with the risk of a further escalation of the Iran war, benefits the US Dollar’s (USD) reserve currency status and supports the USD/JPY pair.

Spot prices once again showed some resilience below the 100-period Exponential Moving Average (EMA) on the 4-hour chart, and the subsequent move up favors bullish traders. That said, the Moving Average Convergence Divergence (MACD) line has slipped marginally below the signal line around the zero mark, with a flat histogram, suggesting fading upside momentum rather than a decisive shift in trend.

Moreover, the Relative Strength Index (RSI) near 48 stays close to its midline, reinforcing a consolidative tone within an overall upward context. Nevertheless, the near-term bias is mildly bullish as the USD/JPY pair holds above the 100-period EMA on the 4-hour chart, near 158.20, which keeps the broader uptrend structure intact.

In the meantime, initial support emerges at 158.20 from the 100-period EMA, followed by 157.65, where the latest downswing stalled. A break below 157.65 would expose deeper retracement levels toward the mid-157.00s. On the topside, immediate resistance stands at 159.30, aligned with recent intraday highs, with a break opening the way to 159.80 and the 160.00 psychological barrier.

(The technical analysis of this story was written with the help of an AI tool.)

USD/JPY 4-hour chart

Japanese Yen FAQs

The Japanese Yen (JPY) is one of the world’s most traded currencies. Its value is broadly determined by the performance of the Japanese economy, but more specifically by the Bank of Japan’s policy, the differential between Japanese and US bond yields, or risk sentiment among traders, among other factors.

One of the Bank of Japan’s mandates is currency control, so its moves are key for the Yen. The BoJ has directly intervened in currency markets sometimes, generally to lower the value of the Yen, although it refrains from doing it often due to political concerns of its main trading partners. The BoJ ultra-loose monetary policy between 2013 and 2024 caused the Yen to depreciate against its main currency peers due to an increasing policy divergence between the Bank of Japan and other main central banks. More recently, the gradually unwinding of this ultra-loose policy has given some support to the Yen.

Over the last decade, the BoJ’s stance of sticking to ultra-loose monetary policy has led to a widening policy divergence with other central banks, particularly with the US Federal Reserve. This supported a widening of the differential between the 10-year US and Japanese bonds, which favored the US Dollar against the Japanese Yen. The BoJ decision in 2024 to gradually abandon the ultra-loose policy, coupled with interest-rate cuts in other major central banks, is narrowing this differential.

The Japanese Yen is often seen as a safe-haven investment. This means that in times of market stress, investors are more likely to put their money in the Japanese currency due to its supposed reliability and stability. Turbulent times are likely to strengthen the Yen’s value against other currencies seen as more risky to invest in.

Source link

24 03, 2026

XAG/USD Surges To $64.50 After Dramatic Rebound From 15-Week Lows

By |2026-03-24T03:11:15+02:00March 24, 2026|Forex News, News|0 Comments


Silver Price Forecast: XAG/USD Surges To $64.50 After Dramatic Rebound From 15-Week Lows


Source link

24 03, 2026

GBP/USD Forecast: Pound Sterling Slides as Middle East Tensions Escalate

By |2026-03-24T03:10:48+02:00March 24, 2026|Forex News, News|0 Comments


– Written by

The Pound to US Dollar (GBP/USD) exchange rate came under notable pressure on Monday as investors reacted to renewed geopolitical tensions in the Middle East.

At the time of writing, GBP/USD was trading near $1.3263, down roughly 0.6% compared to the start of the session.

The US Dollar rallied sharply at the beginning of the week, benefiting from a flight to safety as geopolitical risks escalated.

Investor sentiment deteriorated after US President Donald Trump delivered a firm warning to Iran, calling for the reopening of the Strait of Hormuz within a tight timeframe or risking direct military action against strategic targets.

Iran responded with its own threats, signalling that any US intervention would be met with significant retaliation, including potential disruption to vital infrastructure and shipping routes across the Persian Gulf.

This exchange heightened fears of a broader conflict, with markets increasingly concerned about the implications for global energy supply and the risk of a prolonged disruption to oil shipments through the region.

As a result, demand for the safe-haven US Dollar increased markedly.

Save on Your GBP/USD Transfer

Get better rates and lower fees on your next international money transfer.
Compare TorFX with top UK banks in seconds and see how much you could save.


Compare the Best GBP/USD Rates »

Despite its losses against the US Dollar, the Pound held firmer against several other currencies, supported by expectations that the Bank of England may need to raise interest rates further.

With the UK facing growing inflationary pressures linked to rising energy costs, investors are now pricing in the possibility of multiple rate increases over the course of the year.

Short-Term GBP/USD Forecast: UK PMIs in Focus

Developments in the Middle East will remain a key driver of the Pound to US Dollar exchange rate, but upcoming UK economic data could also influence direction.

The release of the latest preliminary PMI figures is expected to provide an early indication of how the UK economy is coping amid the current geopolitical backdrop.

If the services sector continues to show resilience, it could offer some support to Sterling. However, any signs of weakness may leave the currency vulnerable to further losses.

At the same time, any escalation in tensions, particularly if the US follows through on its threats against Iranian energy infrastructure, could reinforce demand for the US Dollar as investors seek safer assets.

Like this piece? Please share with your friends and colleagues:


International Money Transfer? Ask our resident FX expert a money transfer question or try John’s new, free, no-obligation personal service! ,where he helps every step of the way,
ensuring you get the best exchange rates on your currency requirements.

TAGS: Pound Dollar Forecasts

Source link

23 03, 2026

Forecast update for gold -23-03-2026.

By |2026-03-23T23:10:12+02:00March 23, 2026|Forex News, News|0 Comments


The EURJPY pair moves away from 182.00 support, affected by the positivity of the main indicators, attacking the barrier at 184.20 which represents %66.8 Fibonacci corrective level as appears in the above image.


Note that the continuation of the stability below the barrier that might push it to provide new bearish trading, reaching 183.40 and 182.65, while breaching the barrier and holding above it will confirm its readiness to form strong bullish waves, to expect reaching 184.80, attempting to reach the next target near 185.45.


The expected trading range for today is between 183.40 and 184.20


Trend forecast: Fluctuating


Source link

Go to Top