About Editorial team of BIPNs

Main team of content of bipns.com. Any type of content should be approved by us.
6 03, 2025

Do Collagen Supplements Actually Do Anything For Aging Skin?

By |2025-03-06T17:36:58+02:00March 6, 2025|Dietary Supplements News, News|0 Comments


Aging might be an inevitable part of life, but that doesn’t mean people aren’t desperate to slow it down, particularly when it comes to our skin. The fear of a wrinkle or sag can see many dropping their hard-earned cash on products that claim to keep us looking young – including collagen supplements. But does necking a bunch of this particular protein really make a difference?

What is collagen?

Collagen is the most abundant protein in the human body and helps to provide structure, strength, and elasticity, including in the skin. It’s produced by our bodies from amino acids that we get from our diet, but the level of production decreases as we age – and so, with less structure, our skin gets more wrinkly and saggy. 

Collagen is present in certain foods, such as meat that contains connective tissue. Supplements containing collagen, which is usually sourced from animals, are also touted as one way we can replenish the amount of it in our skin, supposedly returning us to a more youthful appearance. They often come in pills, powders, or liquids, which usually contain collagen that has been broken down into smaller fragments – known as collagen peptides or hydrolyzed collagen – that can be more easily digested and absorbed.

Will collagen supplements make your skin youthful again?

The jury’s still very much out as to whether oral collagen supplements actually do what they say on the tin (or attractively designed pill bottle). That’s not to say that studies thus far haven’t found anything positive to show – quite the opposite, in fact.

For example, a 2023 systematic review and meta-analysis of 26 randomized controlled trials found that hydrolyzed collagen supplements could improve both skin hydration and elasticity compared to a placebo, the effects being significant after eight weeks or more of taking them.

However, as the authors point out, there are several limitations to their findings. One was the lack of consistency in the composition of the supplements used across the 26 trials; to properly compare the results and make a reliable conclusion, you’d need all participants to have taken the same amount of collagen from the same source.

The review also made clear that many of the trials were small, which could increase the risk of bias and also means that the findings can’t reliably be applied to everyone. The authors conclude that further research involving much larger clinical trials needs to be carried out in order to form a more reliable picture of collagen supplements’ effects.

Another review also notes that there’s “no reliable evidence to suggest that orally digested collagen becomes preferentially localized to the dermis as opposed to other parts of the body.” 

Considering that’s the case, there doesn’t seem to be much point in dropping a bunch of money on fancy supplements that claim to specifically benefit your skin, seeing as their components might not even end up there anyway.

On that point, the 2023 analysis didn’t factor in lifestyle habits, which means that they couldn’t say for sure that it was the collagen supplements that made a difference to people’s skin; they might’ve just been using a really good sunscreen, for example.

There are also plenty of studies where those involved have a vested interest in the success of oral collagen. A 2024 clinical trial, for example, found that participants taking a supplement containing hydrolyzed collagen for 12 weeks showed improvements in skin hydration, wrinkles, and elasticity – but the trial was funded by the company that produces the collagen supplement in question, and the paper discloses all but one of the authors work for said company. 

Of course, there’s still a chance this may not have biased their results, but it’s worth being at least a bit skeptical. 

Is it safe to take collagen supplements?

Even if the evidence to support collagen supplements is shaky, that’s not necessarily going to stop someone from taking them. In that case, there’s value in finding out whether or not it’s at least safe to do so.

It’s worth bearing in mind that, like other supplements, ones that contain collagen or its components aren’t regulated by the Food and Drug Administration. That means that it’s not always guaranteed that a product contains what it says it does, nor does it have to be proven safe.

Before taking collagen supplements – or any kind of supplement, for that matter – it’s a good idea to speak with a healthcare professional. Some people have health conditions that have an impact on protein metabolism, which means they need to limit their protein intake, so collagen supplements could be off the table.

How to protect the collagen you already have

There are plenty of ways for someone to protect the collagen they already have in their skin without spending their paycheck on expensive supplements. For example, it’s recommended to wear sun protection, as ultraviolet light exposure can lead to degradation of collagen in the skin. Having a healthy, balanced diet, getting enough sleep, and not smoking are all thought to help too.

All “explainer” articles are confirmed by fact checkers to be correct at time of publishing. Text, images, and links may be edited, removed, or added to at a later date to keep information current.

The content of this article is not intended to be a substitute for professional medical advice, diagnosis, or treatment. Always seek the advice of qualified health providers with questions you may have regarding medical conditions. 


Source link

6 03, 2025

Why Did the US Senate Choose $ADA for the Strategic Reserve? — TradingView News

By |2025-03-06T17:33:56+02:00March 6, 2025|Crypto News, News|0 Comments

After Donald Trump’s announcement of a US Strategic Crypto Reserve, Cardano ($ADA) skyrocketed over 70% in less than 24 hours.

Aside from a significant price bump, $ADA’s investor volume also skyrocketed, which has spiked everyone’s interest in what’s being touted as one of the best cryptos to buy now.

Keep reading to find out everything about Cardano’s 2025 price prediction. We’ll paint a clear picture (combined with both fundamental and technical analysis) to understand where $ADA could be headed next.

Cardano 2025 Price Prediction at a Glance

Here’s a brief summary of all the important factors at play for Cardano and the effect they should have on its price this year:

  • Cardano is respecting the 50 EMA on the weekly chart – BULLISH
  • It has bounced off a well-established support/resistance zone – BULLISH
  • We’re seeing the ‘break and retest’ pattern on both the weekly and daily charts – BULLISH
  • The important resistance level of $1.30 is hovering above current prices – BEARISH
  • All major moving averages are sloping upwards on the daily chart – BULLISH
  • Inclusion in Trump’s US Crypto Reserve – BULLISH
  • Potential launch of a Cardano ETF – BULLISH

As you can see, a vast majority of signs are pointing north, so Cardano is rightly expected to generate handsome yields in 2025 (and beyond).

Although it’s difficult to put a finger on an exact price target, our analysis (which you’ll see below) suggests that Cardano could reach as high as $3.10 in the coming few months.

Diving Deeper Into Cardano’s Chart

Technical analysis 101 dictates that we use the higher timeframes (the weekly and the daily) to form the primary context about a stock/crypto’s current and future prices. $ADA’s Weekly Chart Screams Bullishness

One look at $ADA’s weekly chart, and it immediately comes across as a crypto ready to explode. The biggest bullish sign is how well it’s respecting the 50 Exponential Moving Average (EMA). The crypto has taken support on the 50 EMA twice in the last four weeks.

Plus, two important short-term moving averages – the 20 EMA and the 10 EMA – are both pointing upwards, signaling immense bullish strength.

Another reason for joy among $ADA supporters should be that the crypto has found support at a previous resistance zone, i.e., between $0.60 and $0.80. Moreover, this isn’t just a normal resistance; it’s where $ADA’s last higher high was, which means we have a classic ‘break and retest’ pattern in front of us.

This is an extremely well-known technical analysis pattern, one that traders often look at for fresh entries.

Buying a crypto when it’s ‘retesting’ essentially means getting it at a discounted price, which increases the overall profits you can churn out of it.

This is also a pattern we can use for predicting where Cardano’s next potential rally could take it.

Essentially, we could see a move similar to the one in November last year, meaning $ADA can surge past $1.730 in just the next month or two.

For a longer-term Cardano price prediction, we can use the Elliott Wave theory, which suggests that we could be seeing the onset of an impulse (or motive) wave. If this holds true, $ADA can even reach its all-time highs of $3.10 in 2025.

Perhaps the only thing to watch out for is that $ADA’s current resistance level of around $1.30 is a major one. After all, that’s where the crypto really fell from (almost 80%) in March 2022. It’s also where $ADA’s November 2024 rally eventually faded. Lots to Cheer for on Cardano’s Daily Chart as Well

$ADA’s daily chart, unlike $ETH’s, aligns with its weekly chart to confirm the larger bullish picture. The crypto has broken out of its recent downtrend, which was frankly just a correction so long as we put the weekly chart into perspective.

Cardano daily chart TradingView

Additionally, Cardano is showing a similar ‘break and retest’ pattern on the daily chart as it is on the weekly. This happens to be a great confluence (or double confirmation).

Furthermore, all the major EMAs, including the 200 EMA, which is the granddaddy of all moving averages, are sloping upwards. According to this chart, Cardano is looking ripe to capture the recent highs of $1.3278 in the first half of 2025. Once that’s accomplished, we should see the crypto holding well to aim for the $1.730 level.

Cardano’s Market Sentiment

Of course, the biggest piece of positive news for Cardano buyers is its recent inclusion in Trump’s US Crypto Reserve. The announcement saw $ADA rise by over 70% in a day. It’s currently trading at $0.9546.

Cardano CoinMarketCap

Even better, this upmove in price was accompanied by large institutional buying. Put together, whales have bought around 420M $ADA in the last week. Investor interest in Cardano is swelling up, meaning we can expect current prices to hold and rise higher. Additionally, the prospective launch of a Cardano ETF (exchange-traded fund) later this year could easily see the crypto surge past all price targets. On February 11, Grayscale announced that it wants to launch an ADA ETF on the New York Stock Exchange.

An ETF would further crank up investor participation in Cardano, as those interested in $ADA would be able to invest in it without having to buy the token. Currently, only Bitcoin and Ethereum have ETFs. Cardano could well be the third one to join the list.

It’s also worth noting that Cardano’s founder, Charles Hoskinson, said that he didn’t know Trump would include $ADA. Cardano’s founder being unaware of its inclusion in the Crypto Reserve could be a very positive sign.

After all, it shows that the crypto was picked purely because of what it brings to the table.

Is Cardano the Best ‘Science’ Coin? Experts Say MIND of Pepe May Offer Better Returns

Although Cardano is undoubtedly a great opportunity to invest in a development-first ‘science’ coin that grows slowly and steadily over time, there are other more profitable investments out there, like MIND of Pepe ($MIND).

MIND of Pepe ($MIND)

$MIND is the next biggest AI agent project that can be your trading partner. By leveraging its self-evolving and autonomous build, $MIND will interact with crypto influencers online (on dApps and platforms like X).

It will analyze every single market sentiment and bias to then cut through all the noise and identify the best cryptos to invest in. These exclusive trading signals and market insights will only be made available to $MIND holders.

You can join the $MIND army to not only improve your crypto trading performance but also benefit from a top altcoin’s growth.

The MIND of Pepe presale has already amassed over $7.1M, and it shows no signs of slowing down. 1 $MIND is currently available for just $0.0034539 – here’s how to buy it.

Putting aside the crypto market’s bullish signals, volatility is often the ultimate portfolio killer. Whether you invest in $ADA or $MIND (or both), make sure you only put in an amount you’re comfortable losing.

Also, we urge our readers to do their own research before investing. None of the above is financial advice, after all.

Source link

6 03, 2025

XAU/USD looks to all-time highs at $2,956, awaiting US Nonfarm Payrolls

By |2025-03-06T15:52:09+02:00March 6, 2025|Forex News, News|0 Comments


  • Gold price sits at one-week highs near $2,930 early Thursday, awaits US data and Trump’s tariff news.
  • The US Dollar stays vulnerable to Euro strength and tariff war-led economic concerns.
  • Gold price defends 21-day SMA at $2,906 as further upside appears on the cards.

Gold price is sitting at one-week highs near $2,930 early Thursday, consolidating a three-day recovery while aiming for a retest of lifetime highs of $2,956 ahead of mid-tier US economic data releases.

Gold price remains exposed to upside risks, US NFP eyed

Gold price has entered a brief phase of upside consolidation as buyers take a breather before the next leg higher. The buying interest around the bright metal remains unabated amid sustained US Dollar (USD) weakness as increased odds of further interest rate cuts by the Federal Reserve (Fed) due to US economic slowdown concerns.

US President Donald Trump’s tariff war is expected to increase inflation, rekindling stagflation fears.

Even though Trump announced a one-month pause on the auto tariffs while considering agricultural exemptions on Canada and Mexico, the USD sellers refuse to give up amid a recent series of dismal US economic data and a relentless surge in the EUR/USD pair.

Data released by the ADP Research showed on Wednesday that the US private sector added 77K jobs in February after creating 186K jobs in January. The data missed the expectations of 140K by a wide margin. However, the Institute for Supply Management (ISM) Services PMI rose to 53.5 in February, exceeding forecasts for 52.6. The ISM Services Employment Index jumped to 53.9 in February from 52.3 in January.

The Euro (EUR) jumped to a four-month high against the USD, tracking the rally in the German bund yields after German political parties agreed on a massive spending plan to support the Eurozone’s biggest economy. Surging German bund yields drove global yields higher, including the US Treasury bond yields, capping the Gold price recovery.

Gold traders now eagerly await Friday’s Nonfarm Payrolls (NFP) data to assess the Fed’s easing trajectory amid growing trade tensions between the US and its trading partners.

In the meantime, the mid-tier US Jobless Claims data and further developments on the tariffs front by the Trump administration will be closely followed for any impact on the USD performance and the Gold price action.

The upcoming European Central Bank (ECB) policy decision could curb the EUR/USD rally, fuelling a fresh US Dollar rebound. In such a scenario, Gold price could see a corrective move lower, which could also be seen as a profit-taking decline ahead of the all-important US payrolls data on Friday.

Gold price technical analysis: Daily chart

The short-term technical outlook for Gold price remains more or less the same as long as it defends the 21-day Simple Moving Average (SMA) of $2,906.

The uptrend could regain traction only on acceptance above the $2,930 static resistance on a daily candlestick closing basis.

The Relative Strength Index (RSI) has turned slightly lower but holds well above the 50 level, suggesting that the bullish potential remains in place.

If the February 26 high of $2,930 is taken out sustainably, the next topside barriers are at an all-time high of $2,956 and the $2,970 round level.

If sellers fight back control, immediate support is seen at the 21-day SMA at $2,906, below which the $2,850 psychological barrier will be challenged.

The $2,835 demand area will then come into play.

(This story was corrected on March 6 at 07:30 GMT to say that “Gold price defends 21-day SMA at $2,906, not $2,903.7 )

Gold FAQs

Gold has played a key role in human’s history as it has been widely used as a store of value and medium of exchange. Currently, apart from its shine and usage for jewelry, the precious metal is widely seen as a safe-haven asset, meaning that it is considered a good investment during turbulent times. Gold is also widely seen as a hedge against inflation and against depreciating currencies as it doesn’t rely on any specific issuer or government.

Central banks are the biggest Gold holders. In their aim to support their currencies in turbulent times, central banks tend to diversify their reserves and buy Gold to improve the perceived strength of the economy and the currency. High Gold reserves can be a source of trust for a country’s solvency. Central banks added 1,136 tonnes of Gold worth around $70 billion to their reserves in 2022, according to data from the World Gold Council. This is the highest yearly purchase since records began. Central banks from emerging economies such as China, India and Turkey are quickly increasing their Gold reserves.

Gold has an inverse correlation with the US Dollar and US Treasuries, which are both major reserve and safe-haven assets. When the Dollar depreciates, Gold tends to rise, enabling investors and central banks to diversify their assets in turbulent times. Gold is also inversely correlated with risk assets. A rally in the stock market tends to weaken Gold price, while sell-offs in riskier markets tend to favor the precious metal.

The price can move due to a wide range of factors. Geopolitical instability or fears of a deep recession can quickly make Gold price escalate due to its safe-haven status. As a yield-less asset, Gold tends to rise with lower interest rates, while higher cost of money usually weighs down on the yellow metal. Still, most moves depend on how the US Dollar (USD) behaves as the asset is priced in dollars (XAU/USD). A strong Dollar tends to keep the price of Gold controlled, whereas a weaker Dollar is likely to push Gold prices up.


Source link

6 03, 2025

Euro settles above key technical level ahead of ECB

By |2025-03-06T15:38:05+02:00March 6, 2025|Forex News, News|0 Comments

  • EUR/USD trades at fresh multi-month highs near 1.0800 in the European morning on Thursday.
  • The ECB is widely anticipated to lower key rates after March policy meeting.
  • The pair remains technically overbought in the near term.

EUR/USD preserved its bullish momentum and registered impressive gains for the third consecutive day on Wednesday. The pair continues to inch higher in the European morning on Thursday and trades at its highest level since early November above 1.0800. 

Euro PRICE This week

The table below shows the percentage change of Euro (EUR) against listed major currencies this week. Euro was the strongest against the US Dollar.

  USD EUR GBP JPY CAD AUD NZD CHF
USD   -4.05% -2.55% -1.15% -0.78% -2.14% -2.45% -1.36%
EUR 4.05%   1.45% 2.80% 3.21% 1.89% 1.48% 2.61%
GBP 2.55% -1.45%   1.46% 1.74% 0.43% 0.03% 1.15%
JPY 1.15% -2.80% -1.46%   0.60% -0.95% -1.27% -0.21%
CAD 0.78% -3.21% -1.74% -0.60%   -1.21% -1.68% -0.58%
AUD 2.14% -1.89% -0.43% 0.95% 1.21%   -0.40% 0.72%
NZD 2.45% -1.48% -0.03% 1.27% 1.68% 0.40%   1.12%
CHF 1.36% -2.61% -1.15% 0.21% 0.58% -0.72% -1.12%  

The heat map shows percentage changes of major currencies against each other. The base currency is picked from the left column, while the quote currency is picked from the top row. For example, if you pick the Euro from the left column and move along the horizontal line to the US Dollar, the percentage change displayed in the box will represent EUR (base)/USD (quote).

The US Dollar (USD) remained under heavy selling pressure midweek despite the upbeat ISM Services Purchasing Managers Index (PMI) report for February. News of US President Donald Trump granting the US automative industry a one-month exemption from 25% tariffs imposed on Canada and Mexico allowed the risk mood to improve and forced the USD to continue to weaken.

Later in the day, the European Central Bank (ECB) will announce monetary policy decisions and publish the revised macroeconomic projections. Markets widely expect the ECB to lower key rates by 25 basis points (bps).

A downward revision to inflation and growth expectations could cause investors to price in a continuation of policy easing and open the door for the Euro to correct lower. Market participants will also pay close attention to comments from ECB President Christine Lagarde. In case Lagarde adopts a cautious tone on additional rate cuts, citing the uncertainty surrounding the EU-US trade relations, the Euro could hold its ground.

The US economic calendar will feature the weekly Initial Jobless Claims data. Investors, however, could ignore this data ahead of Friday’s Nonfarm Payrolls (NFP) report.

EUR/USD Technical Analysis

The Relative Strength Index (RSI) indicator on the 4-hour chart climbed above 80, reflecting extremely overbought conditions for EUR/USD in the near term. On a bullish note, the pair made a daily close above the 200-day Simple Moving Average (SMA), currently located at 1.0720, for the first time in four months.

On the downside, 1.0760 (static level) aligns as interim support before 1.0720 (200-day SMA) and 1.0700 (static level, round level). Looking north, first resistance could be spotted at 1.0900 (static level, round level) ahead of 1.0940 (static level from November).

ECB FAQs

The European Central Bank (ECB) in Frankfurt, Germany, is the reserve bank for the Eurozone. The ECB sets interest rates and manages monetary policy for the region. The ECB primary mandate is to maintain price stability, which means keeping inflation at around 2%. Its primary tool for achieving this is by raising or lowering interest rates. Relatively high interest rates will usually result in a stronger Euro and vice versa. The ECB Governing Council makes monetary policy decisions at meetings held eight times a year. Decisions are made by heads of the Eurozone national banks and six permanent members, including the President of the ECB, Christine Lagarde.

In extreme situations, the European Central Bank can enact a policy tool called Quantitative Easing. QE is the process by which the ECB prints Euros and uses them to buy assets – usually government or corporate bonds – from banks and other financial institutions. QE usually results in a weaker Euro. QE is a last resort when simply lowering interest rates is unlikely to achieve the objective of price stability. The ECB used it during the Great Financial Crisis in 2009-11, in 2015 when inflation remained stubbornly low, as well as during the covid pandemic.

Quantitative tightening (QT) is the reverse of QE. It is undertaken after QE when an economic recovery is underway and inflation starts rising. Whilst in QE the European Central Bank (ECB) purchases government and corporate bonds from financial institutions to provide them with liquidity, in QT the ECB stops buying more bonds, and stops reinvesting the principal maturing on the bonds it already holds. It is usually positive (or bullish) for the Euro.


Source link

6 03, 2025

Flavored Tea Ingredient Market Growth, Trends,

By |2025-03-06T15:36:09+02:00March 6, 2025|Dietary Supplements News, News|0 Comments


Flavored Tea Ingredient Market

On March 6,2025, Exactitude Consultancy., Ltd. released a research report titled “Flavored Tea Ingredient Market”. This report covers the global Flavored Tea Ingredient market sales, sales volume, price, market share, ranking of major companies, etc., and provides a detailed analysis by region, country, product type, and application. It also forecasts the market size of automotive kick sensors based on market patterns from 2020 to 2036 and future market trends. Along with quantitative data, this study also provides qualitative analysis for companies to formulate growth strategies, evaluate the competitive environment, and analyze their market positions.

Moreover, the report provides a professional in-depth examination of the Flavored Tea Ingredient Market’s current scenario, CAGR, gross margin, revenue, price, production growth rate, volume, value, market share, and growth are among the market data assessed and re-validation in the research. The report will also cover key agreements, collaborations, and global partnerships soon to change the dynamics of the market on a global scale. Detailed company profiling enables users to evaluate company shares analysis, emerging product lines, the scope of new product development in new markets, pricing strategies, innovation possibilities, and much more.

This report is also available in the following languages : Japanese (フレーバーティー原料市場), Korean (향미차 성분 시장), Chinese (调味茶原料市场), French (Marché des ingrédients du thé aromatisé), German (Markt für aromatisierte Teezutaten), and Italian (Mercato degli ingredienti del tè aromatizzato), etc.

Get a Sample Copy of This Report at: https://exactitudeconsultancy.com/reports/47441/flavored-tea-ingredient–market#request-a-sample

Updated Version 2026 is available our Sample Report May Includes the:

➤ 2026 Latest updated research report with Overview, Definition, TOC, updated Top market players

➤ 190+ Pages Research Report

➤ Provide Chapter-wise guidance on the Request

➤ Updated Research Report Includes a List of tables & figures

➤ Report Includes updated 2026 Top Market Players with their latest Business Strategy, Sales Volume, and Revenue Analysis

➤ Facts and Factors updated research methodology

The purpose of this market analysis is to estimate the size and growth potential of the market based on the kind of product, the application, the industry analysis, and the area. Also included is a comprehensive competitive analysis of the major competitors in the market, including their company profiles, critical insights about their product and business offerings, recent developments, and important market strategies.

Flavored Tea Ingredient Market Segments:

According to the report, the Flavored Tea Ingredient Market is segmented in the following ways which fulfill the market data needs of multiple stakeholders across the industry value chain –

The Leading Players involved in the global Flavored Tea Ingredient market are:

Twinings , Lipton (Unilever) , Bigelow Tea , Tazo (Unilever) , Harney & Sons , Celestial Seasonings (Hain Celestial) , Stash Tea , Teavana (Starbucks) , Adagio Teas , Dilmah Tea , Yogi Tea , PG Tips (Unilever) , T2 Tea (Unilever) , Numis Tea , Rishi Tea , Mighty Leaf Tea , Kerala Spice Tea , Numi Organic Tea , Chaiwala , Pukka Herbs

Market segmentation:

1. Type

– Natural Flavor Modulators

– Artificial Flavor Modulators

– Synthetic Flavor Modulators

2. Application

– Food and Beverage

– Dairy Products

– Bakery Products

– Sauces and Condiments

– Processed Foods

– Snacks

– Pharmaceuticals

– Nutraceuticals

– Personal Care Products

3. Form

– Liquid Flavor Modulators

– Powdered Flavor Modulators

4. Distribution Channel

– Online Retail

– Offline Retail

– Supermarkets/Hypermarkets

– Specialty Stores

– Convenience Stores

6. End User

– Food Manufacturers

– Beverage Manufacturers

– Pharmaceutical Companies

– Nutraceutical Companies

Buy this report and Get Up to 60% Discount At: https://exactitudeconsultancy.com/reports/47441/flavored-tea-ingredient-market

Trends and Opportunities of the Global Flavored Tea Ingredient Market:

The global Flavored Tea Ingredient market has seen several trends in recent years, and understanding these trends is crucial to stay ahead of the competition. The global Flavored Tea Ingredient market also presents several opportunities for players in the market. The increasing demand for Flavored Tea Ingredient in various industries presents several growth opportunities for players in the market.

Regional Outlook:

The following section of the report offers valuable insights into different regions and the key players operating within each of them. To assess the growth of a specific region or country, economic, social, environmental, technological, and political factors have been carefully considered. The section also provides readers with revenue and sales data for each region and country, gathered through comprehensive research. This information is intended to assist readers in determining the potential value of an investment in a particular region.

› North America: USA, Canada, Mexico, etc.

› Asia-Pacific: China, Japan, Korea, India, and Southeast Asia

› The Middle East and Africa: Saudi Arabia, the UAE, Egypt, Turkey, Nigeria, and South Africa

› Europe: Germany, France, the UK, Russia, and Italy

› South America: Brazil, Argentina, Columbia, etc.

Research Methodology:

✅ Research Objectives: This section provides an overview of the research study’s primary objectives, encompassing the research questions and hypotheses that will be addressed.

✅ Research Design: The following section presents the comprehensive outline of the research design, encompassing the selected approach for the study (quantitative, qualitative, or mixed-methods), the methodologies utilized for data collection (surveys, interviews, focus groups), and the sampling strategy employed (random sampling, stratified sampling).

✅ Data Collection: This section involves gathering information from primary and secondary sources. Primary sources included the use of survey questionnaires and interview guides, while secondary sources encompassed existing data from reputable publications and databases. Data collection procedures involved meticulous steps such as data cleaning, coding, and entry to ensure the accuracy and reliability of the collected data.

✅ Data Analysis: The data were analyzed using various methods including statistical tests, qualitative coding, and content analysis.

✅ Limitations: The study’s limitations encompass potential biases, errors in data sources, and overall data constraints.

Highlights of the Report:

✔ For the period 2026-2036, accurate market size and compound annual growth rate (CAGR) predictions are provided.

✔ Exploration and in-depth evaluation of growth potential in major segments and geographical areas.

✔ Company profiles of the top players in the global Flavored Tea Ingredient Market are provided in detail.

✔ Comprehensive investigation of innovation and other market developments in the global Flavored Tea Ingredient Market.

✔ Industry value chain and supply chain analysis that is dependable.

✔ A thorough examination of the most significant growth drivers, limitations, obstacles, and future prospects is provided.

Following are Some of the Most Important Questions that are Answered in this Report:

➼ What are the most important market laws governing major sections of the Flavored Tea Ingredient Market?

➼ Which technological advancements are having the greatest influence on the anticipated growth of the worldwide market for Flavored Tea Ingredient Market?

➼ Who are the top worldwide businesses that are now controlling the majority of the Flavored Tea Ingredient Market?

➼ What kinds of primary business models do the primary companies in the market typically implement?

➼ What are the most important elements that will have an impact on the expansion of the Flavored Tea Ingredient Market around the world?

➼ How do the main companies in the environment of the global Flavored Tea Ingredient Market integrate important strategies?

➼ What are the present revenue contributions of the various product categories on the worldwide market for Flavored Tea Ingredient Market, and what are the changes that are expected to occur?

Reason to Buy

✔ Save and reduce time carrying out entry-level research by identifying the growth, size, leading players, and segments in the global Flavored Tea Ingredient Market.

✔ Highlights key business priorities in order to guide the companies to reform their business strategies and establish themselves in the wide geography.

✔ The key findings and recommendations highlight crucial progressive industry trends in the Flavored Tea Ingredient Market, thereby allowing players to develop effective long-term strategies in order to garner their market revenue.

✔ Develop/modify business expansion plans by using substantial growth offerings in developed and emerging markets.

✔ Scrutinize in-depth global market trends and outlook coupled with the factors driving the market, as well as those restraining the growth to a certain extent.

✔ Enhance the decision-making process by understanding the strategies that underpin commercial interest with respect to products, segmentation, and industry verticals.

Request for a FREE sample of this research report at (Use Corporate Mail ID for Quick Response) @ https://exactitudeconsultancy.com/reports/47441/flavored-tea-ingredient–market#request-a-sample

Table of Content:

Chapter 1: Flavored Tea Ingredient Market Overview, Drivers, Restraints and Opportunities, Segmentation overview

Chapter 2: Flavored Tea Ingredient Market Competition by Manufacturers

Chapter 3: Production by Regions

Chapter 6: Consumption by Regions

Chapter 6: Consumption, By Applications, Flavored Tea Ingredient Market share (%) and Growth Rate by Applications

Chapter 6: Complete profiling and analysis of Manufacturers

Chapter 7: Marketing Strategy Analysis, Distributors/Traders

Continue….

Discover More: Visit Our Website For Additional Reports!

https://smb.selmatimesjournal.com/article/3D-Print-Organ-Market-at-a-CAGR-of-880-percent-during-the-forecast-period-2024-2030-Exactitude-Consultancy?storyId=66827b7a137b83ff8fb6aaa4

https://www.bahamasbusinesstimes.com/article/724616149-marine-functional-ingredients-market-at-a-cagr-of-8-6-during-the-forecast-period-2024-2030-exactitude-consultancy

https://smb.thewashingtondailynews.com/article/Automotive-Plastic-Additives-Market-is-projected-to-reach-USD-1230-billion-by-2029-Exactitude-Consultancy?storyId=668a60f2137b83ff8f9c0cf0

https://www.comorosbusinesspress.com/article/726226731-rising-at-7-1-cagr-thermal-spray-coatings-market-is-expected-to-reach-above-usd-14-16-billion-by-2029-exactitude-consultancy

https://www.asiapacificnewsnetwork.com/article/730322321-food-emulsifiers-market-is-expected-to-be-valued-at-usd-6-21-billion-by-2033-exactitude-consultancy

https://www.asiapacificnewsnetwork.com/article/730322321-food-emulsifiers-market-is-expected-to-be-valued-at-usd-6-21-billion-by-2033-exactitude-consultancy

https://www.iowabusinessgazette.com/article/731274666-fiberglass-market-is-expected-to-be-valued-at-usd-23-19-billion-by-2032-exactitude-consultancy

https://www.montanabusinesspress.com/article/731879063-photomask-market-is-expected-to-be-valued-at-usd-6-36-billion-by-2030-exactitude-consultancy

https://www.massachusettsbusinessjournal.com/article/733380018-global-pest-control-market-is-expected-to-be-valued-at-usd-48-21-billion-by-2033-exactitude-consultancy

https://www.frenchguianapress.com/article/734902106-global-6g-enterprise-market-is-expected-to-be-valued-at-usd-34-4-billion-by-2032-exactitude-consultancy

About Us

Exactitude Consultancy is a market research & consulting services firm which helps its client to address their most pressing strategic and business challenges. Our market research helps clients to address critical business challenges and also helps make optimized business decisions with our fact-based research insights, market intelligence, and accurate data.

https://bulletin.exactitudeconsultancy.com/

https://www.thehealthanalytics.com/

https://www.analytica.global/

https://www.marketintelligencedata.com/

https://www.marketinsightsreports.com/

https://exactitudeconsultancy.com/

Connect Us:

IRFAN TAMBOLI

PHONE NUMBER +1 (704) 266-3234

EMAIL ADDRESS: sales@exactitudeconsultancy.com

This release was published on openPR.


Source link

6 03, 2025

XRP (XRP) Price Prediction & Analysis: Whale Feeding Frenzy Scoops Up $3.2 Billion

By |2025-03-06T15:32:46+02:00March 6, 2025|Crypto News, News|0 Comments

  • XRP whales accumulated 1.34 billion XRP (worth $3.26 billion) in the past week despite an 18% price dip
  • The Price DAA Divergence indicator shows a buy signal for XRP, suggesting investor resilience
  • XRP is trading at $2.45, holding above $2.33 support, after a 37% increase
  • South Korean technical adoption news helped XRP recover 11% to $2.17
  • Market volume for XRP is down 19%, indicating investors might be holding their positions

XRP has seen major price movements in recent days. The crypto experienced an 18% crash on Monday but has since rebounded. As of today, XRP is trading at $2.45, showing signs of recovery in the market.

Large investors known as “whales” have been buying up XRP in huge amounts. Over the past week, whale addresses holding between 100 million and 1 billion XRP added 1.34 billion XRP to their holdings. This accumulation is worth over $3.26 billion.

These large holders appear to be buying at low prices. Despite the recent price crash, the whales did not sell their holdings. This suggests they have strong confidence in XRP’s future price growth.

XRP Price on CoinGecko

The Price DAA Divergence, a market indicator, is currently showing a buy signal for XRP. This technical signal happens when an asset’s price movement differs from its daily active addresses. It often suggests a coming price change.

Investor behavior shows resilience despite tough market conditions. With more investors holding their XRP and fewer choosing to sell, the market sentiment seems to be turning positive. This holding pattern could support a longer price rally.

XRP has managed to stabilize above the $2.33 support level. After facing high volatility over the weekend, the cryptocurrency posted a 37% price increase. This move suggests XRP might have momentum for further gains if the current trend continues.

However, XRP failed to secure $2.70 as a support level on Sunday. This prevented the cryptocurrency from pushing to higher price levels. If XRP can break through and hold above $2.70, it could then target the $2.95 resistance level.


Failure to break $2.70 might result in consolidation above $2.33. This could delay any immediate upward movement. The market would then need more clarity before deciding its next direction.

Recovery signs emerged from South Korea recently. Technical adoption news from the region helped XRP recover to $2.17. This positive news came as welcome relief for investors who had seen falling prices.

Market volume for XRP has decreased by 19%. This lower volume might actually be a positive sign. It suggests investors are willing to wait and hold their positions rather than panic selling.

XRP Still Down from Highs

XRP is still down about 30% from its early February price levels. This drop has made some investors cautious about future price movements. Many are watching key resistance levels before making new investment decisions.

The cryptocurrency’s excess supply remains a concern for trading experts. The total supply of XRP is 100 billion coins, with about 46 billion currently in circulation. This large supply can affect price dynamics in the market.

Despite these concerns, whale accumulation suggests strong institutional confidence. When large holders buy in such volumes, it often indicates they see value at current price levels. Their buying power can also help support the price.

If buying pressure continues to increase, XRP could see a sustained rally. This would require support from both retail investors and whales to push through key resistance levels. Market conditions will play a crucial role in determining this outcome.

XRP now needs to establish $2 as a strong baseline for further growth. While recent price action looks promising, the cryptocurrency must maintain its momentum to convince cautious investors to return to the market.

Source link

6 03, 2025

Solana’s DeFi Up 2,400%, Yet Ethereum Wins in Value

By |2025-03-06T14:02:55+02:00March 6, 2025|News, NFT News|0 Comments


Solana’s decentralized finance (DeFi) ecosystem has surged ahead, expanding more rapidly than Ethereum’s and pulling in huge revenues. Still, despite this swift climb, a new report from Franklin Templeton, a global asset manager, points out a glaring gap: Solana’s DeFi tokens are priced far below Ethereum’s, even with all this growth.

The study digs into five top DeFi projects from both Ethereum and Solana, checking how they’ve performed. For Ethereum, it lists Lido, Aave, Ethena, Maker, and Uniswap. Over on Solana, it spotlights Jito, Jupiter, Kamino, Marinade, and Raydium.

The numbers grab attention—over the last year, fees for Solana’s DeFi platforms have shot up by 2,400%, while Ethereum’s projects have only ticked up by 150%.

Still, Solana projects are valued at a median multiple of 9x, while Ethereum’s hit a stronger 18x. The key takeaway? Solana’s DeFi world is doing great, but its tokens are still a lot cheaper than Ethereum’s.

More people are turning to Layer-2 networks like Arbitrum, Optimism, and Base, which shows Ethereum is keeping up with change. These tools reduce network clogging and cut transaction fees, proving Ethereum’s scaling plan is solid. Franklin Templeton says leaning on L2s is a major step in Ethereum’s effort to stay in the lead.

Even with its standout growth, Solana’s DeFi tokens are still priced low compared to Ethereum’s. But if this trend rolls on, that could change soon. As Solana keeps proving it’s a high-performance blockchain, the market might adjust. Major Solana DeFi players like Jito, Raydium, Jupiter, Orca, and Kamino could see their values climb to rival Ethereum’s big names.

DeFi is shifting quickly. Solana’s gaining ground, while Ethereum works out new ways to hold its advantage. One thing’s for sure—this isn’t a passing moment. Whether Solana catches up remains unclear, but its steady rise is hard to miss.

Also Read: Hamster Network Hits 34,028 TPS, Beating Solana and Aptos


Source link

6 03, 2025

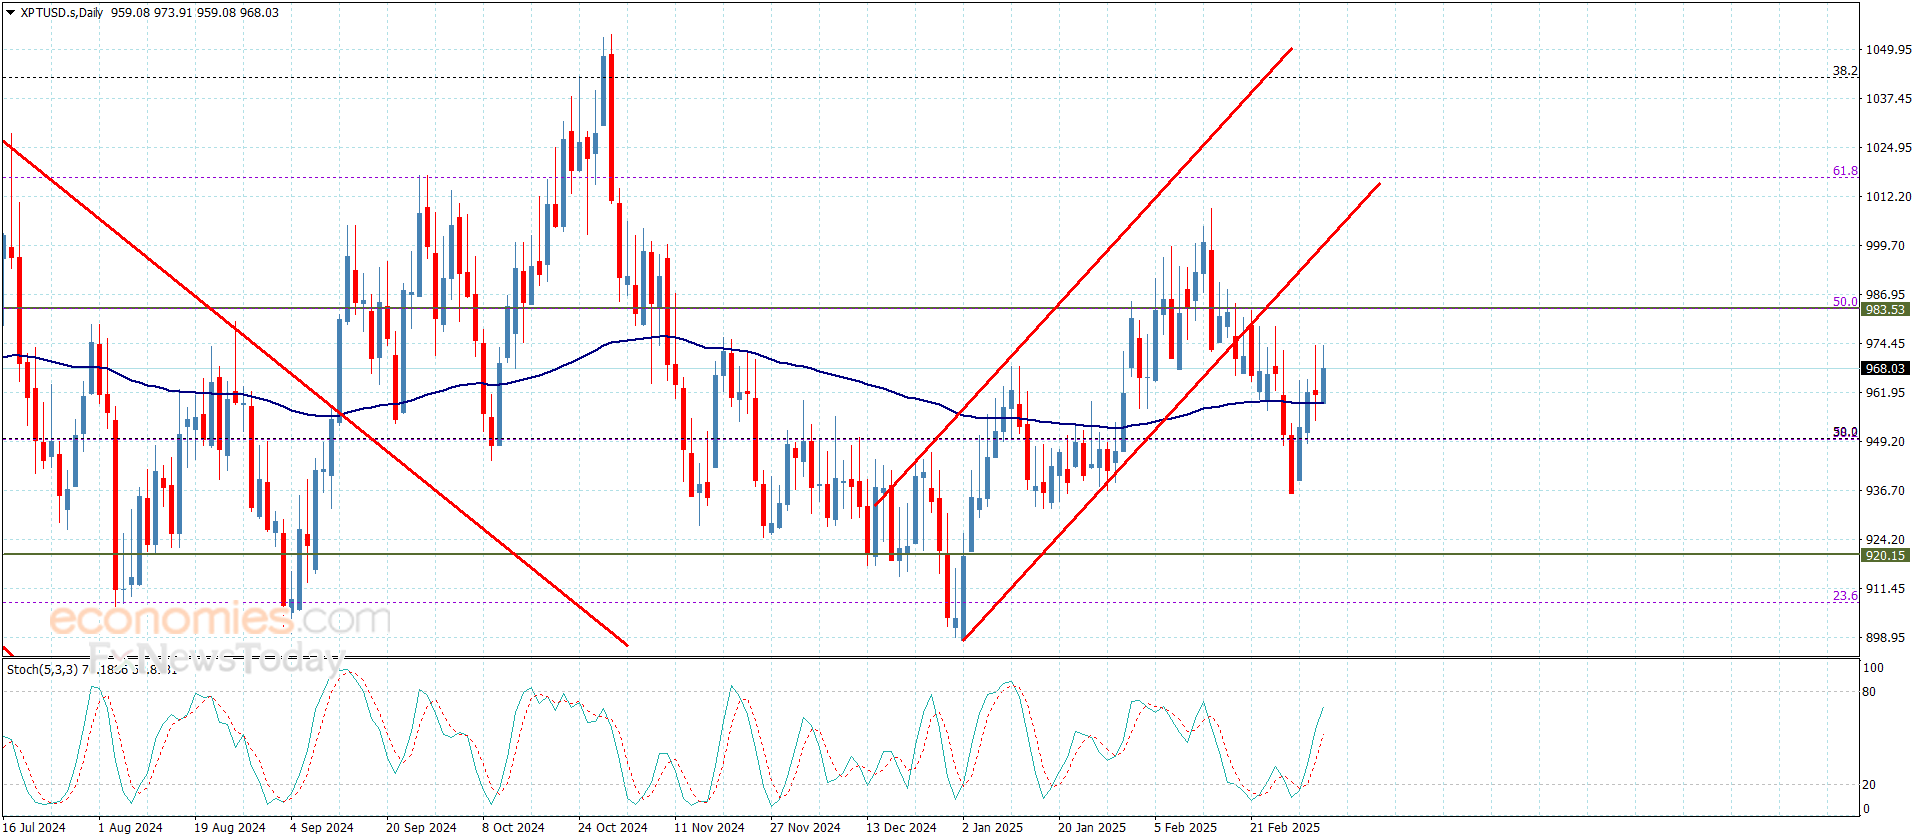
Platinum price touches the first target – Forecast today – 6-3-2025

By |2025-03-06T13:50:56+02:00March 6, 2025|Forex News, News|0 Comments


Copper price confirmed its surrender to the previously suggested positivity by settling within the bullish channel frequently and surpassing 4.6800$ barrier now, to notice the beginning of recording the positive targets by touching 4.7800$ now.


The continuous positive momentum provided by the major indicators will increase the efficiency of the bullish track, to expect attacking 4.8100$ recorded high soon, while surpassing it will start targeting new positive stations by rallying towards 4.9100$ and face the bullish channel’s resistance line.


The expected trading range for today is between 4.6800$ and 4.9100$


Trend forecast: Bullish


Source link

6 03, 2025

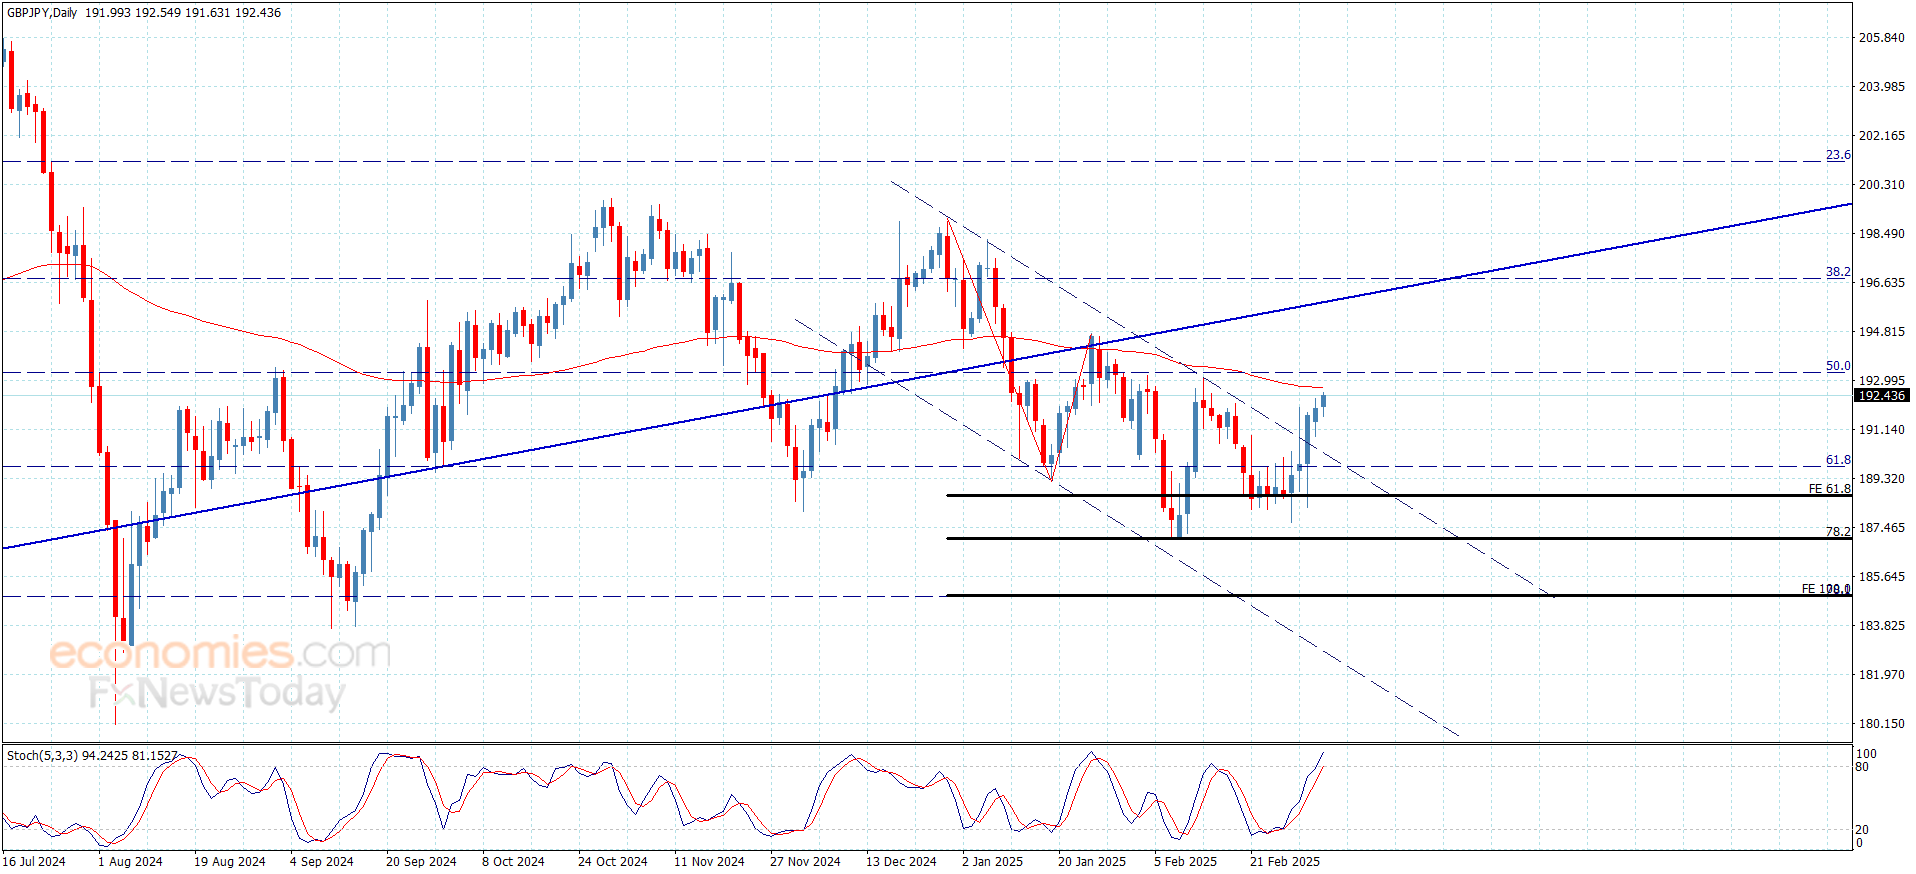
The GBPJPY touches the first target – Forecast today – 6-3-2025

By |2025-03-06T13:35:50+02:00March 6, 2025|Forex News, News|0 Comments

Copper price confirmed its surrender to the previously suggested positivity by settling within the bullish channel frequently and surpassing 4.6800$ barrier now, to notice the beginning of recording the positive targets by touching 4.7800$ now.


The continuous positive momentum provided by the major indicators will increase the efficiency of the bullish track, to expect attacking 4.8100$ recorded high soon, while surpassing it will start targeting new positive stations by rallying towards 4.9100$ and face the bullish channel’s resistance line.


The expected trading range for today is between 4.6800$ and 4.9100$


Trend forecast: Bullish


Source link

6 03, 2025

France warns against weight loss supplements using Garcinia plant

By |2025-03-06T13:34:37+02:00March 6, 2025|Dietary Supplements News, News|0 Comments


Credit: Unsplash/CC0 Public Domain

France warned Wednesday against dietary supplements promising weight loss that use the tropical plant Garcinia cambogia after a range of rare but serious side effects including one death were reported.

Garcinia cambogia—which is also called Garcinia gummi-gutta or Malabar tamarind—grows in India and Southeast Asia and has a fruit that looks like a pumpkin.

A range of supplements are sold around the world using extracts from the plant advertising its ability to suppress appetite and drive weight loss—claims not backed by comprehensive scientific evidence.

After investigating the death of a person who took a Garcinia-based supplement—and looking at other side effects reported in the United States and elsewhere—French food safety agency ANSES said it “strongly advises” people against consuming the plant.

The plant has been banned from being used medicine since 2012 in France, but continues to be advertised in more 340 dietary supplements, which are mostly available online, the agency said in a statement.

There were 38 cases of serious side effects affecting the liver, pancreas, heart, muscles and mental health reported in France between 2009 and March last year, ANSES said.

These side effects can affect people with a history of psychiatric disorders, pancreatitis or hepatitis—or who suffer from diabetes, obesity or high blood pressure, the agency added.

People taking antidepressants, antiretrovirals or drugs that affect the liver can also experience side effects.

A 71-year-old woman in France taking blood pressure drugs died of acute hepatitis in 2019 after taking Garcinia-based supplement Slim Metabol. ANSES says her death was “very likely” linked to the supplement, which remains on sale.

However people without a history of health problems can also be affected.

“A 32-year-old woman with no medical history developed myocarditis that led to her requiring a heart transplant,” Aymeric Dopter, head of the ANSES nutrition risk assessment unit, told AFP.

“Some people will tell you: ‘I took it and I am fine’,” Dopter said.

“But we can see from these few cases that people who were simply trying to lose weight ended up with seriously impaired health—or even died,” he said.

“It is not the worth the risk.”

The safety of products using Garcinia cambogia is currently being assessed by the European Food Safety Agency.

The watchdog is also investigating the risk of hydroxycitric acid, an ingredient extracted from the Garcinia plant’s fruit, which is also used in supplements promoting weight loss.

France’s ANSES called for the list of plants authorized for use in food supplements to be “harmonized” across the European Union.

© 2025 AFP

Citation:
France warns against weight loss supplements using Garcinia plant (2025, March 5)
retrieved 6 March 2025
from https://medicalxpress.com/news/2025-03-france-weight-loss-supplements-garcinia.html

This document is subject to copyright. Apart from any fair dealing for the purpose of private study or research, no
part may be reproduced without the written permission. The content is provided for information purposes only.


Source link

Go to Top