About Editorial team of BIPNs

Main team of content of bipns.com. Any type of content should be approved by us.
3 03, 2025

Tea Market Booms to Reach $35.6 Billion by 2034 as Green &

By |2025-03-03T16:56:50+02:00March 3, 2025|Dietary Supplements News, News|0 Comments


Rockville , March 03, 2025 (GLOBE NEWSWIRE) — According to the updated research analysis by Fact.MR, a market research and competitive intelligence provider, the global tea market reached a valuation worth US$ 20.4 billion in 2024. Worldwide sales of tea are forecasted to rise at a CAGR of 5.7% from 2024 to 2034.

The size of the tea market is driven by trends in health and wellness. Recent years have seen a significant growth in interest in health and wellbeing, which is fueling the expansion of the tea market. More consumers are turning to tea as a healthy beverage option to improve their overall well-being. Teas with specific health benefits, such as reducing stress, boosting immunity, aiding in weight loss, and helping digestion, are gaining popularity among more consumers.

Click to Request a Sample of this Report for Additional Market Insights

https://www.factmr.com/connectus/sample?flag=S&rep_id=10367

The most often consumed tea varieties include green tea, black tea, oolong tea, and herbal tea. Increasing interest in green tea is attributed to its popularity as a beverage or nutritional supplement promoting weight loss, easing headaches and digestive issues, and improving mental clarity.

Key Takeaway from Market Study

  • The tea market is analyzed to reach a value of US$ 35.6 billion by the end of 2034.
  • North America is approximated to capture a 23.9% share of the global market in 2024.
  • Global sales of black tea are evaluated to rise at a CAGR of 5.8% to reach US$ 25.1 billion by 2034-end.
  • Sales of tea in Japan are projected to rise at 6.2% CAGR through 2034.
  • South Korea is analyzed to account for a share of 22.2% of the East Asian market revenue in 2024.
  • The market in East Asia is forecasted to expand at a CAGR of 6% from 2024 to 2034.

“The increasing number of people using social media, where influencers and celebrities are promoting several tea brands and tea-related lifestyle products, is contributing to their rising sales,” says a Fact.MR analyst.

Herbal Tea Known for Anti-inflammatory and Antioxidant Qualities

Herbal teas are becoming more popular as a result of their purported health advantages. Herbal teas have long been recognized for their anti-inflammatory and antioxidant properties; some have even been linked to improved digestion and sleep. As more people are looking to natural remedies for several health problems, herbal teas have grown in popularity.

Key Market Players Driving the Global Tea Market
Key businesses driving the global tea market include ThirsTea Corp; The Chai Direct; RFI Ingredients; A. Holliday & Company Inc.; Monin, Inc.; Herbalife International of America, Inc.; Synergy Flavors, Inc.; Maya Tea Company; Amelia Bay; Island Rose Gourmet Tea; PepsiCo, Inc.; Tata Global Beverages Ltd; H&H Products Company; MB-Holding GmbH & Co. KG; Cooper Tea Company LLC.

Industry News in the Tea Buisness Analysis

Leading tea market players are prioritizing customer demands by enhancing packaging, ensuring efficient delivery of premium-quality products, and emphasizing the use of superior organic herbs known for their health benefits and immunity-boosting properties.

  • Tata Consumer Products finalized an agreement in January 2024 to acquire up to 100% equity in Organic India, a company specializing in organic food, beverages, and herbal supplements.
  • Dabur India Limited introduced Dabur Vedic Tea in 2022, a premium black tea infused with over 30 Ayurvedic ingredients such as cardamom, ginger, and tulsi.
  • Twinings, a brand under Associated British Foods plc, launched Superblends in February 2022, a collection of five wellness-oriented tea blends—Sleep, Calm, Digest, Focus, and Glow—designed to support overall health.
  • In September 2021, Twinings also unveiled an exclusive foodservice line, featuring 11 specialty tea blends crafted specifically for the hospitality industry.

Get a Custom Analysis for Targeted Research Solutions

https://www.factmr.com/connectus/sample?flag=S&rep_id=10367

More Valuable Insights on Offer

Fact.MR, in its new offering, presents an unbiased analysis of the tea market, presenting historical demand data (2019 to 2023) and forecast statistics for the period (2024 to 2034).

The study divulges essential insights into the tea market based on type (black tea, green tea, oolong tea, herbal tea), by distribution channel (hyper/super market, convenience stores, retail stores, online stores), across seven major regions of the world (North America, Latin America, Western Europe, Eastern Europe, East Asia, South Asia & Pacific, and MEA).

Discover Additional Market Insights from Fact.MR Research

The global bottled tea market, valued at US$ 50 billion in 2023, is set to reach US$ 78 billion by 2033, expanding at a 4.5% CAGR. Black tea, a key segment, is rich in antioxidants, free from fat, sugar, and carbonation, and supports hydration and overall health.

The global tea infusion market, valued at US$ 720.7 million in 2022, is projected to reach US$ 992.3 million by 2032, growing at a 3.2% CAGR. It held a 3.2% share of the global tea market in 2021.

The global nitrogen-infused tea market, valued at US$ 24.97 million in 2023, is projected to reach US$ 161.2 million by 2033, growing at a CAGR of 20.5%. Known for its smooth, creamy texture and enhanced flavor, nitro tea offers a unique, foamy drinking experience, driving its rising popularity.

The global beverage carrier rings market is expanding rapidly due to rising demand for canned beverages. Available in various materials like plastic, fiber, and cardboard, these rings simplify bulk transportation. With restrictions on single-use plastics, cardboard carrier rings are gaining traction, offering reusability and branding opportunities. This segment is projected to grow at a 6.6% CAGR.

The global transglutaminase market is expected to reach US$ 593.8 million in 2024 and grow at a 7.4% CAGR to US$ 1.21 billion by 2034. Widely used in the food industry to improve texture, flavor, and shelf life, microbial transglutaminase is also finding applications in tissue engineering, textiles, and leather processing, driving market growth.

The global microbial-derived fiber market is set to grow at a 9.8% CAGR, reaching US$ 62.33 million by 2033 from US$ 24.47 million in 2023. These fibers, produced through microbial fermentation, differ from traditional plant-based fibers by offering unique dietary benefits. As interest in functional and fermentable fibers increases, microbial-derived fibers are gaining traction in the health and nutrition industry.

About Us:

Fact.MR is a distinguished market research company renowned for its comprehensive market reports and invaluable business insights. As a prominent player in business intelligence, we deliver deep analysis, uncovering market trends, growth paths, and competitive landscapes. Renowned for its commitment to accuracy and reliability, we empower businesses with crucial data and strategic recommendations, facilitating informed decision-making and enhancing market positioning. With its unwavering dedication to providing reliable market intelligence, FACT.MR continues to assist companies in navigating dynamic market challenges with confidence and achieving long-term success. With a global presence and a team of experienced analysts, FACT.MR ensures its clients receive actionable insights to capitalize on emerging opportunities and stay ahead in the competitive landscape.

Contact:
US Sales Office:
11140 Rockville Pike
Suite 400
Rockville, MD 20852
United States
Sales Team: sales@factmr.com
Follow Us: LinkedIn | Twitter | Blog


Source link

3 03, 2025

Solana (SOL) Price Prediction for March 3

By |2025-03-03T16:54:25+02:00March 3, 2025|Crypto News, News|0 Comments

The bulls are dominating today, according to CoinStats.

Top coins by CoinStats

SOL/USD

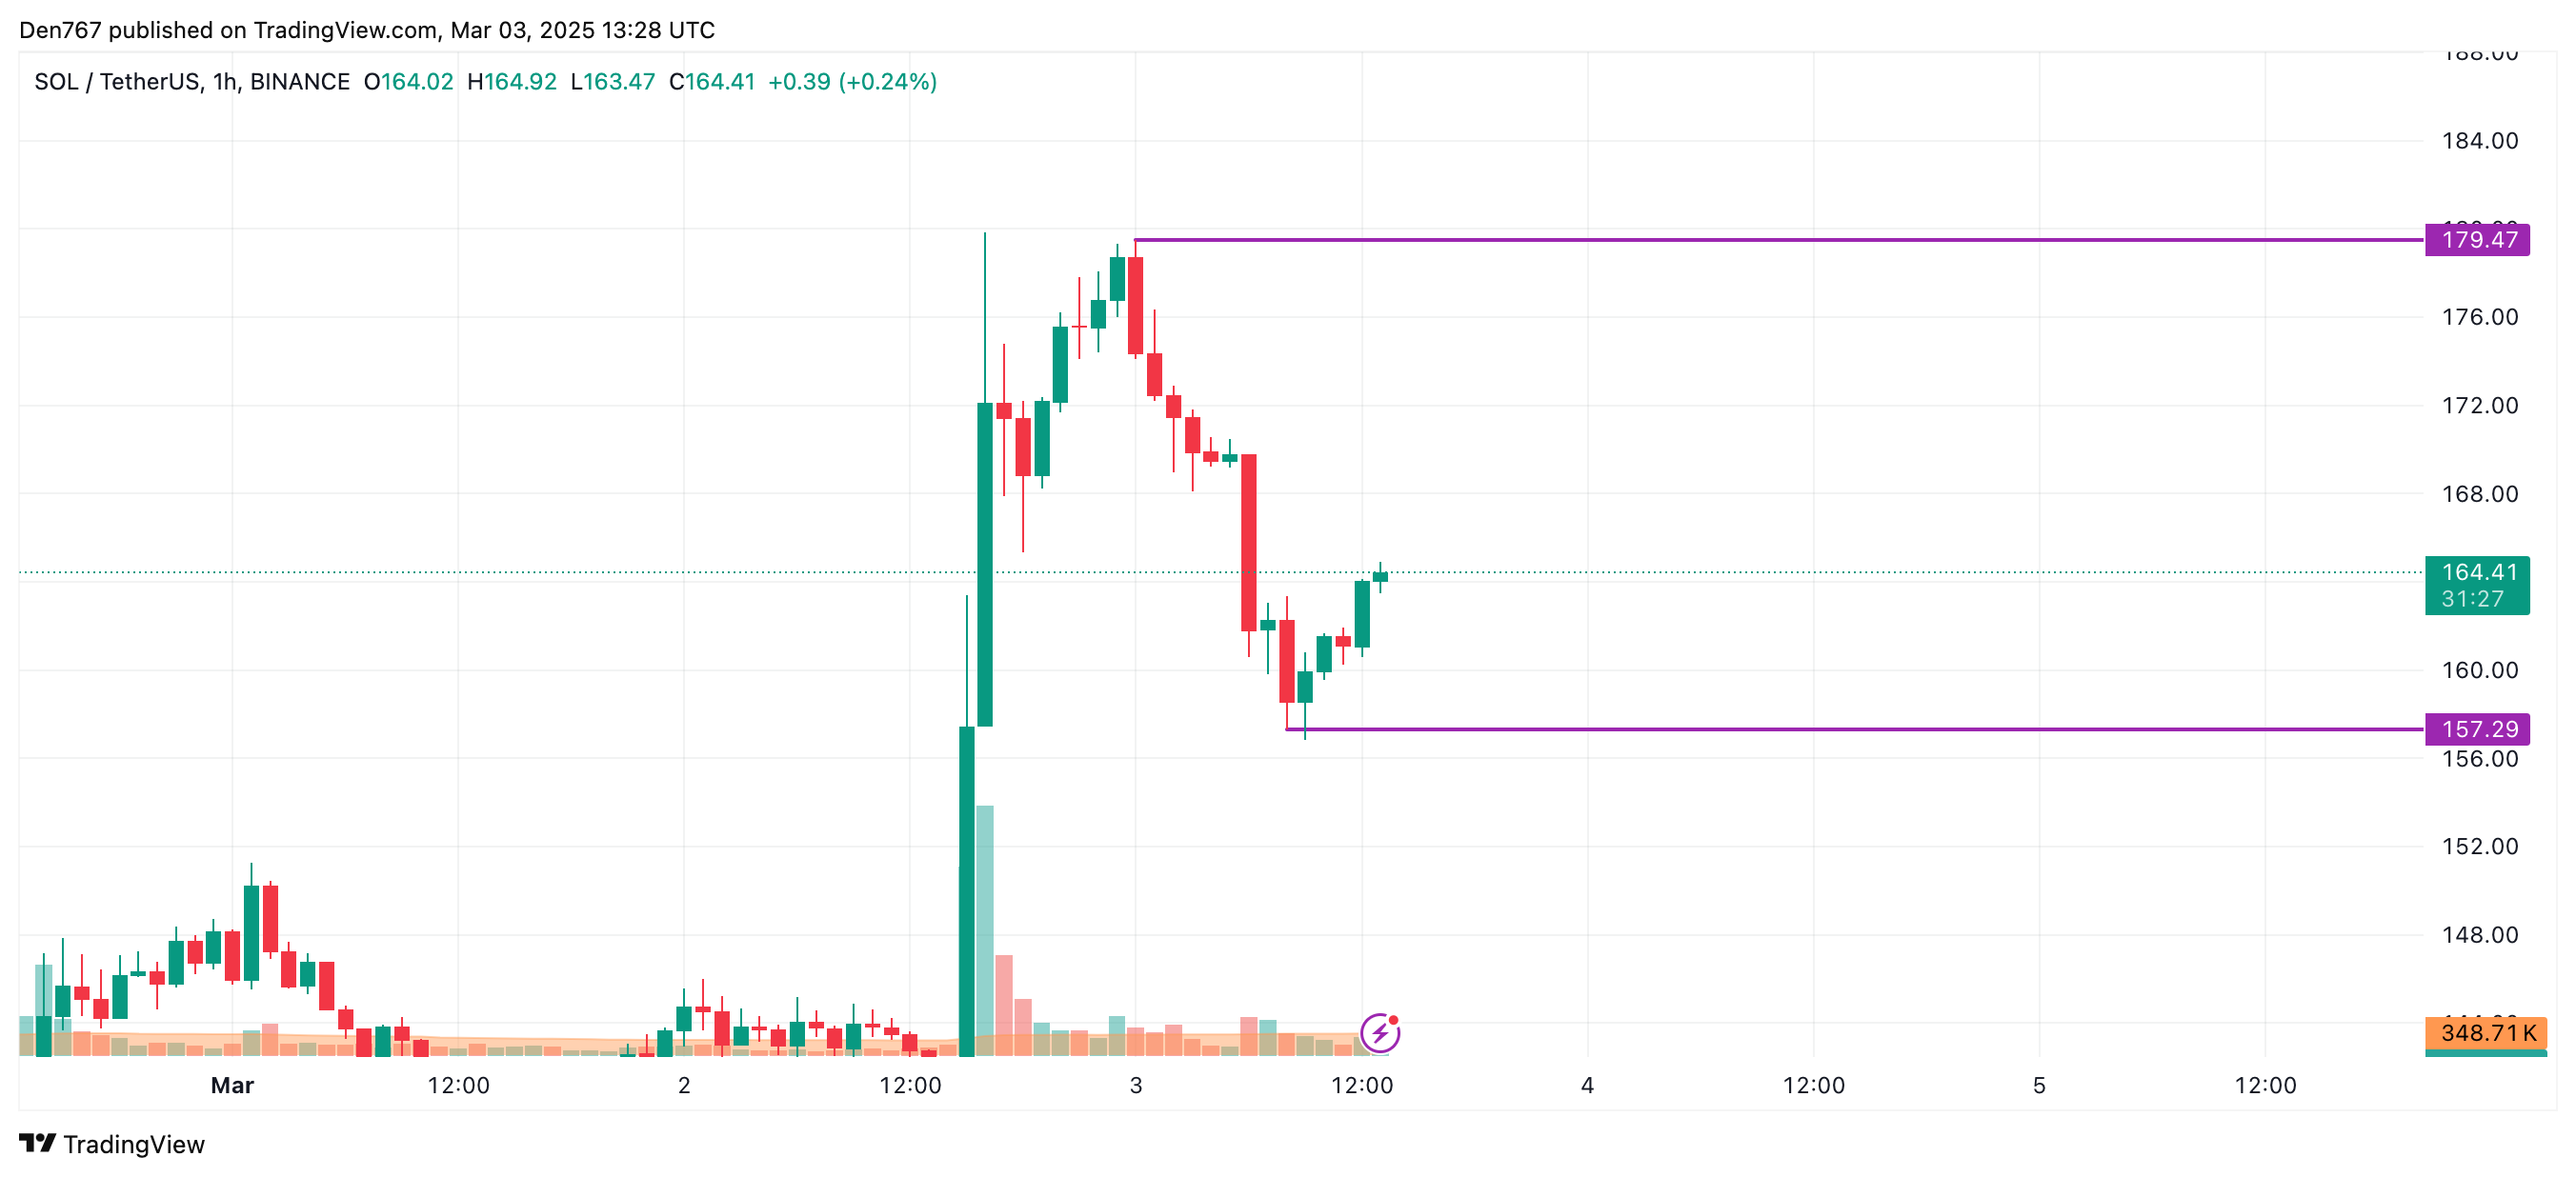
Solana (SOL) is one of the biggest gainers today, rising by 15.92%.

Article image
Image by TradingView

On the hourly chart, the price of SOL might have found a local support level of $157.29. If the daily bar closes far from that mark, growth is likely to continue to the resistance of $179.47 by tomorrow.

Article image
Image by TradingView

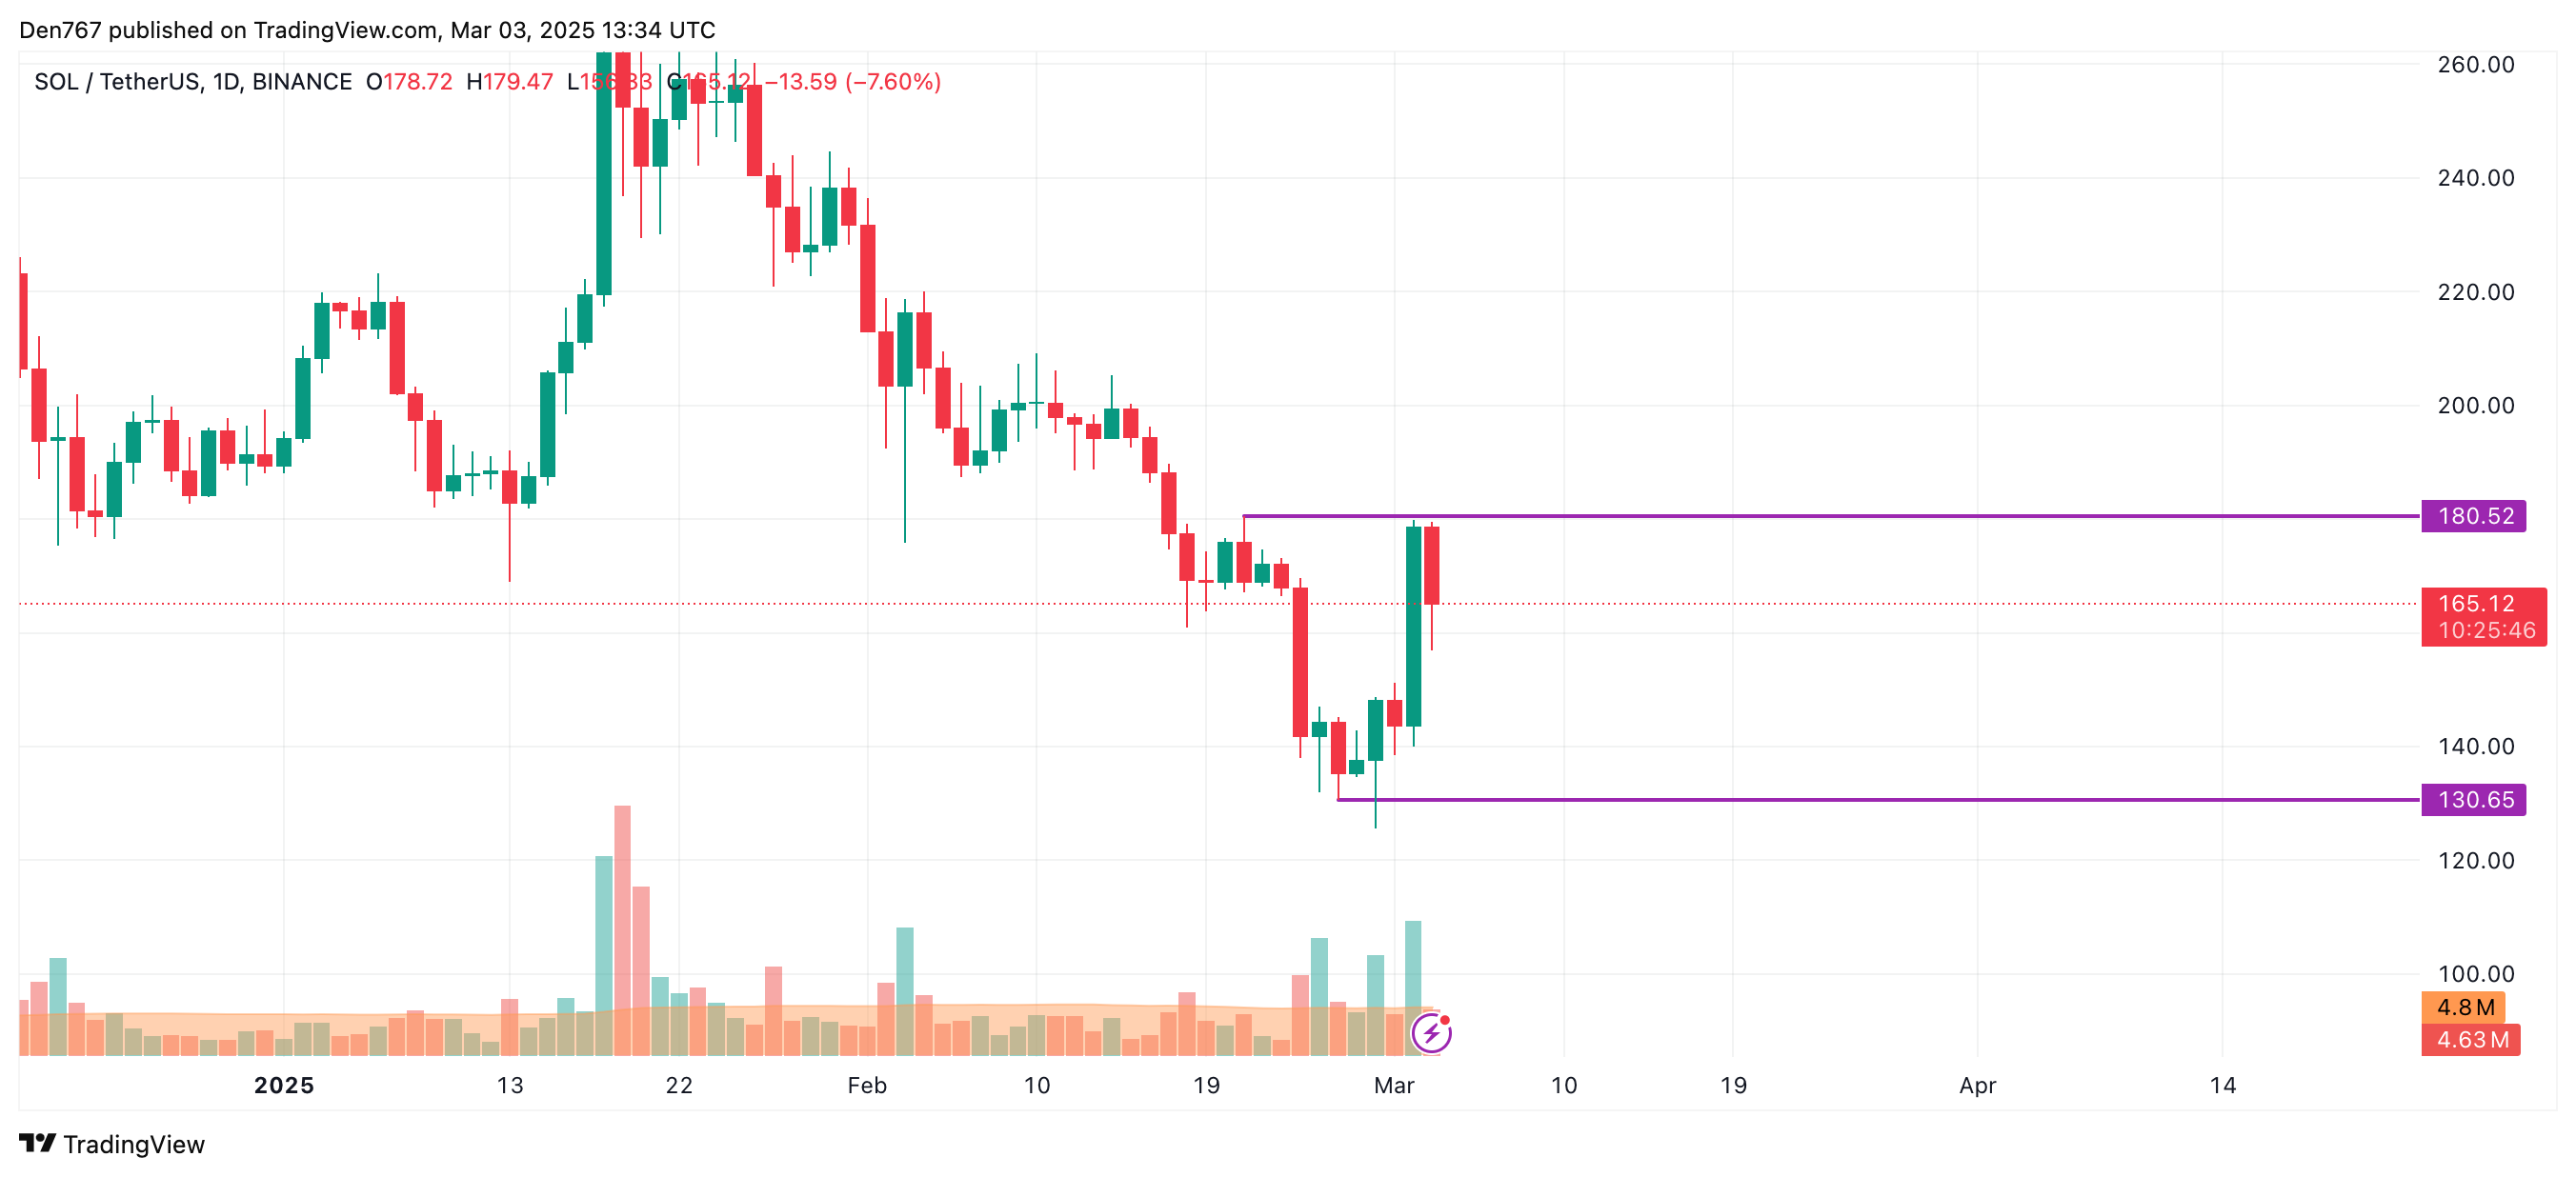
On the bigger time frame, one should pay attention to the level of $180.52. Until the rate reaches that mark, bears remain more powerful than bulls.

Related

Ethereum (ETH) Price Prediction for March 2

However, if the breakout happens, the accumulated energy might be enough for a test of the $200 zone.

Article image
Image by TradingView

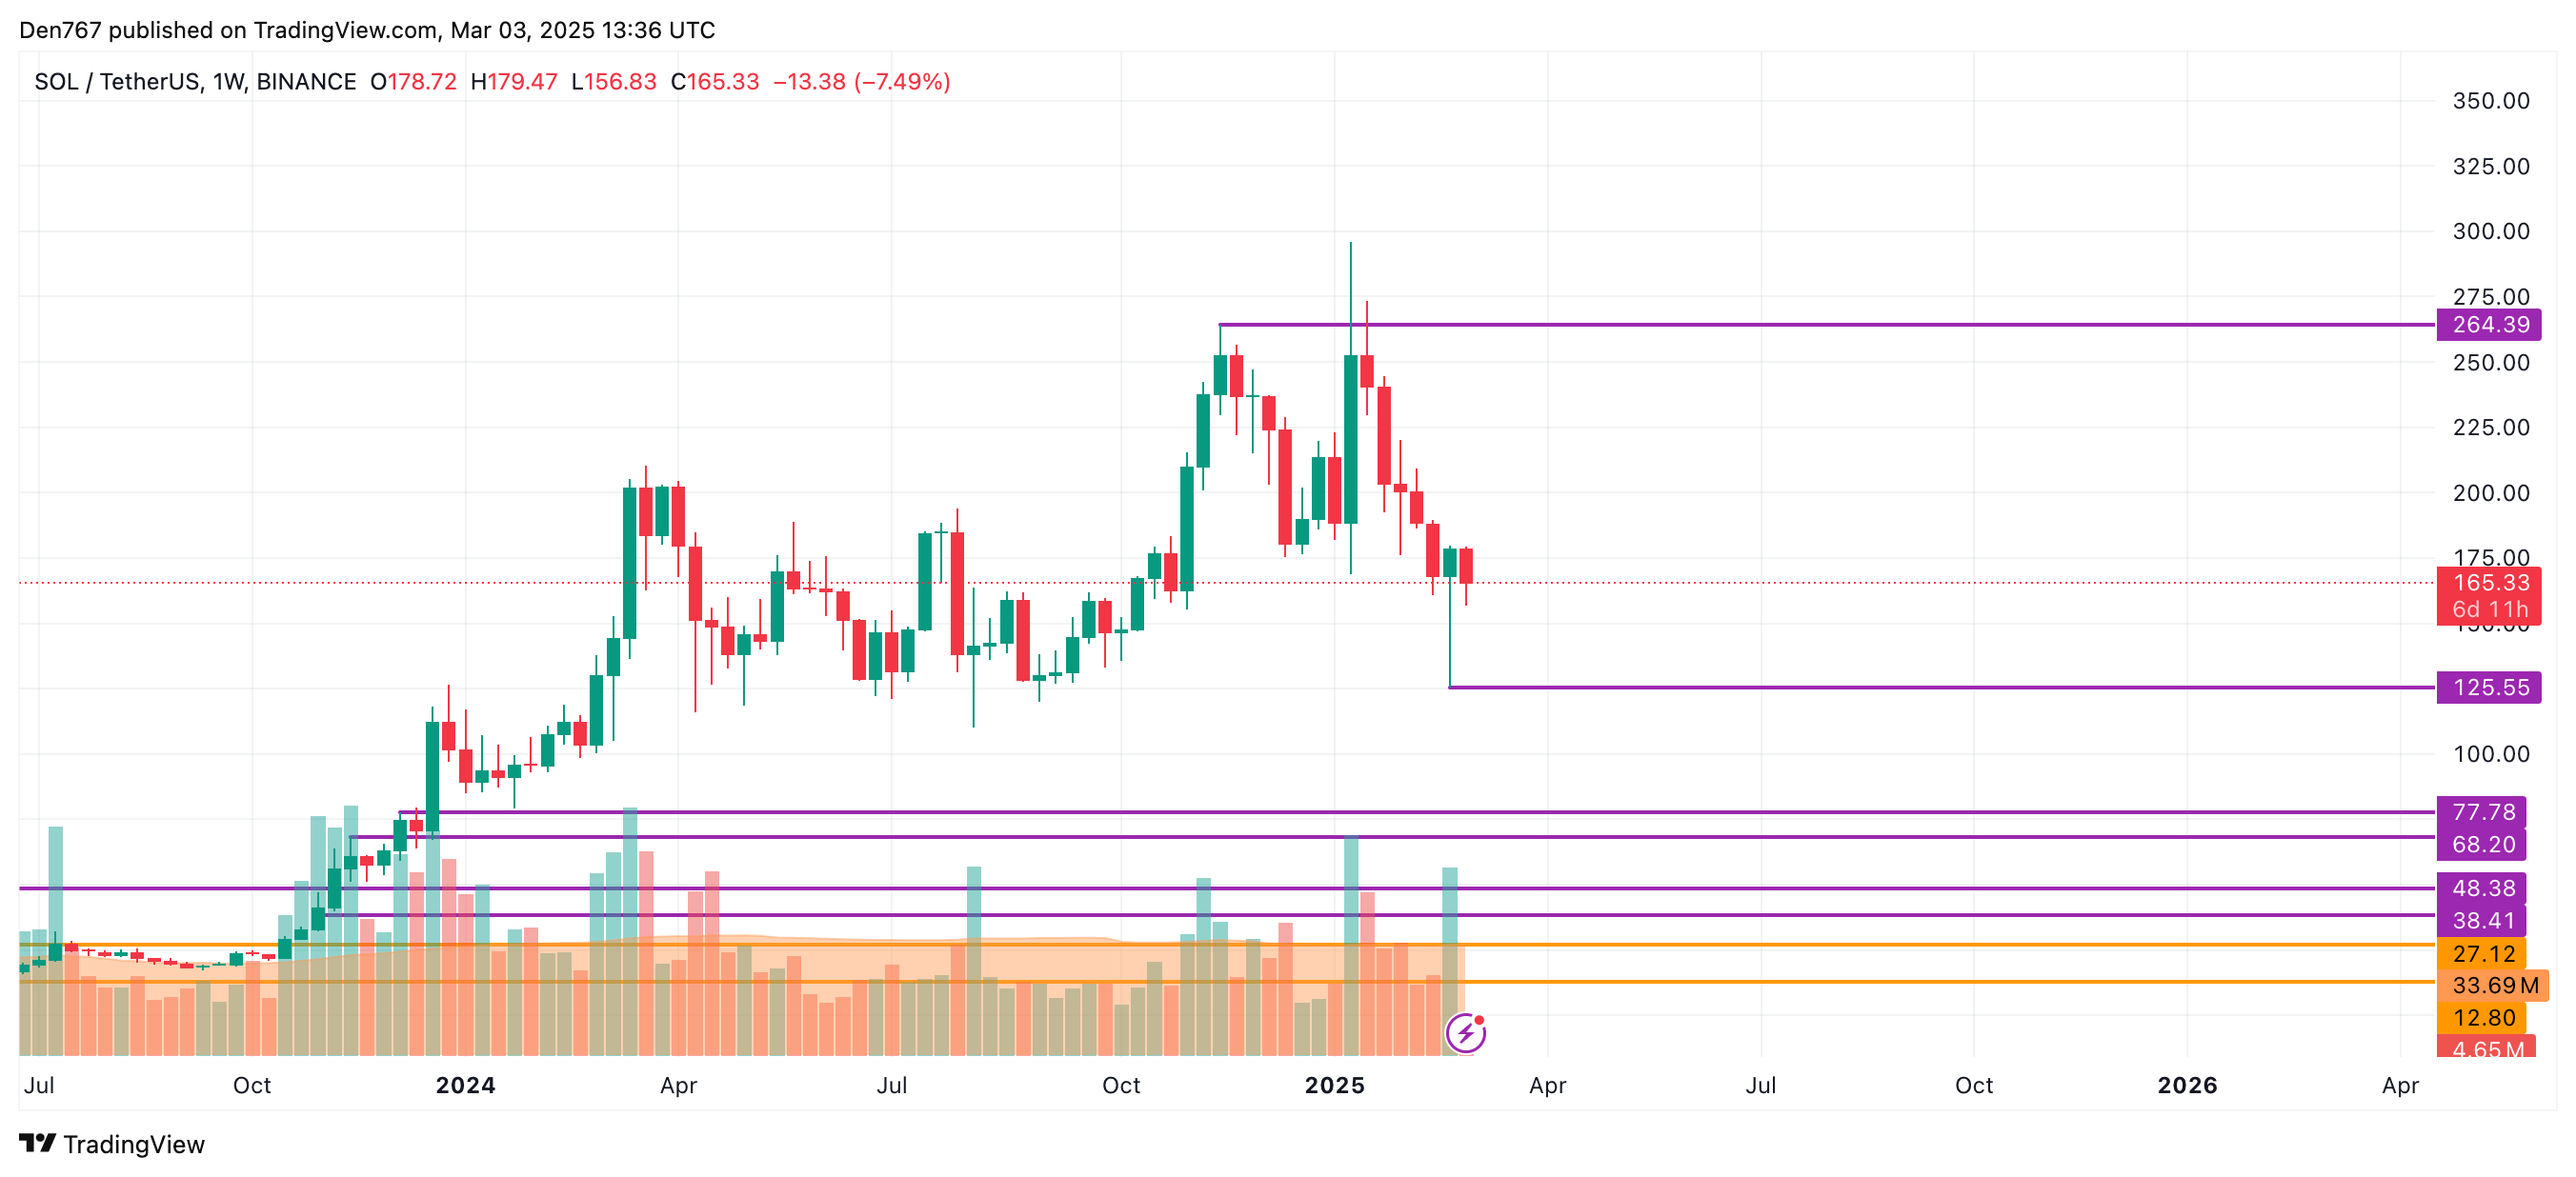
From the midterm point of view, it is too early to make any distant predictions. If the weekly bar closes above $175 and with no long wick, growth may continue to the $200-$225 area.

SOL is trading at $164.90 at press time.

Source link

3 03, 2025

The EURUSD price forecast update

By |2025-03-03T15:11:27+02:00March 3, 2025|Forex News, News|0 Comments


The EURJPY pair lost its negative momentum after touching 154.78 level, to form correctional bullish rebound and notice testing the additional barrier at 157.35 and settling below it.


The frequent stability below this barrier allows us to wait to gather the additional negative momentum to ease the mission of forming strong negative waves and target 155.90 followed by 155.20 levels soon, while jumping above the barrier will reinforce the chances of resuming the positive correction to expect rallying towards 158.20.


The expected trading range for today is between 155.90 and 157.35


Trend forecast: Bearish


Source link

3 03, 2025

Holds Steady Near 1.04 (Video)

By |2025-03-03T14:56:57+02:00March 3, 2025|Forex News, News|0 Comments

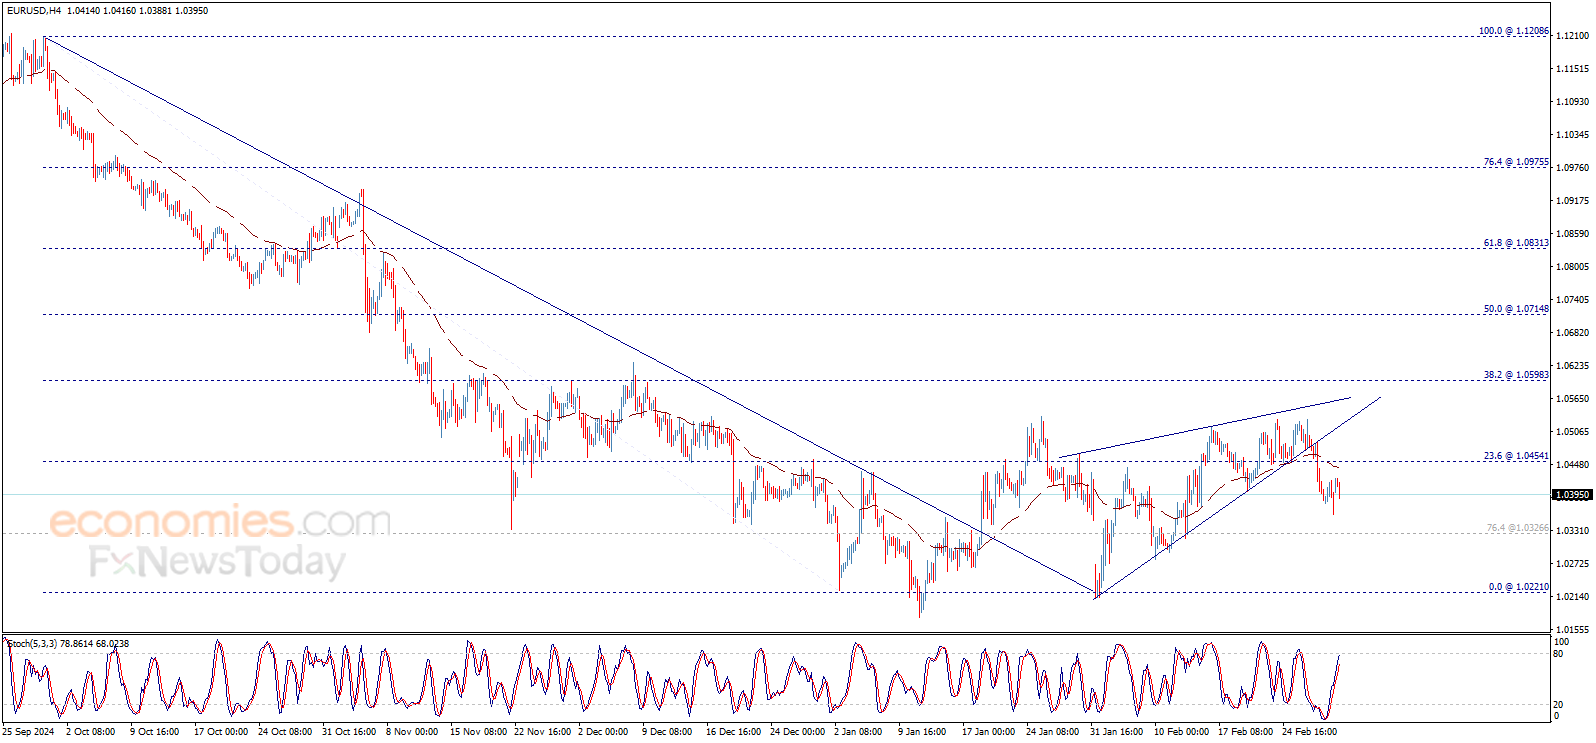
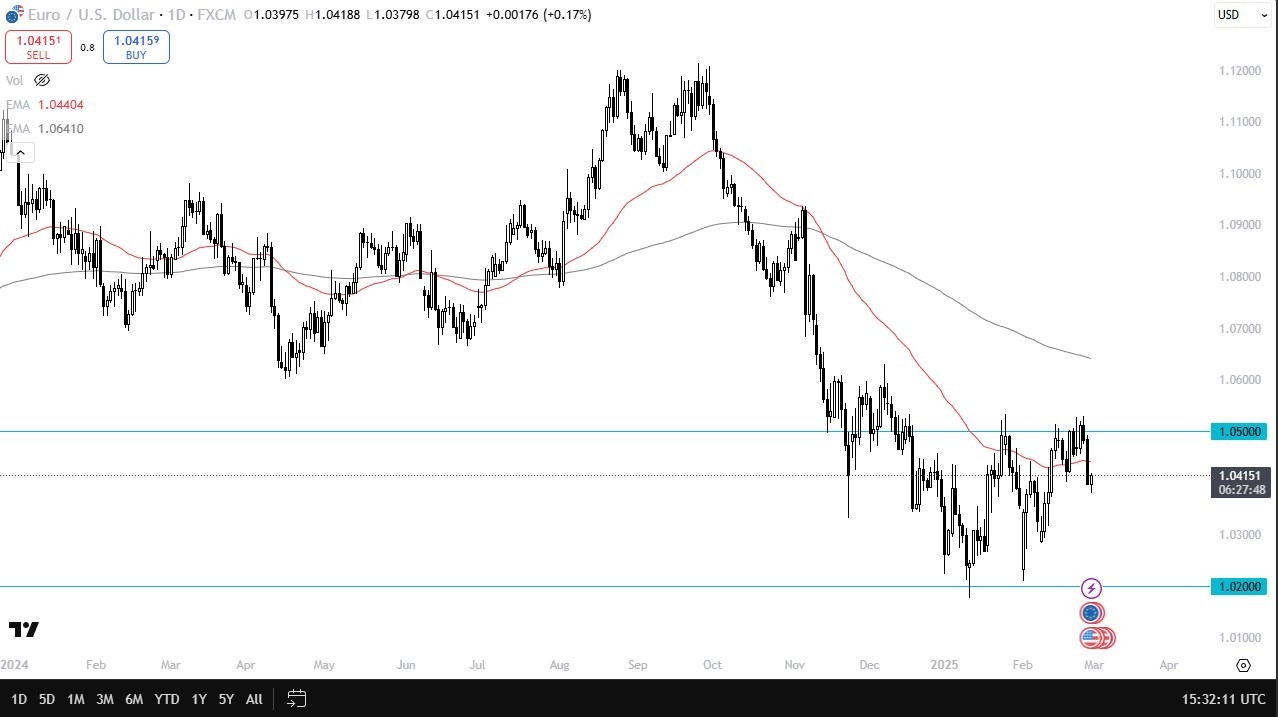
  • You can see that the Euro has stabilized a bit during the trading session on Friday as we continue to pay close attention to the 1.04 level.
  • Donald Trump’s announcement of tariffs on the European Union has had a greater impact on traders than I initially expected.
  • Given that he had previously mentioned the possibility of such tariffs, I’m somewhat surprised by the market’s reaction.

Nonetheless, the market is now below the 50-day EMA, and that will attract a certain amount of attention in and of itself, and I think really what matters here is that we now find ourselves somewhat affirming the previous consolidation area, at least in theory we are of 1.05 above being a major barrier and 1.02 underneath being a major floor. As long as we stay in this area, I think we will continue to see a lot of noisy and erratic trading. That’s typical for the Euro. All one has to do is zoom out, look at the chart, and you can see a lot of it’s just chopping back and forth.

Rangebound Still

This range that we find ourselves in now is just below the one before it. And that is common for the euro as well. It finds a range, it stays there for a certain amount of time, and then it moves to the next block. With that being the case, I think you have to assume that there is still a lot of selling pressure above the 1.05 level. Just as there’s a lot of support at the 1.02 level, a lot of pundits had the euro go into parity before it’s all said and done. It wouldn’t really surprise me if that happened.

As far as getting bullish, I would need to see this market actually break above the 1.06 level because it would take out a cluster from December that could cause a bit of headaches for buyers. And of course, take out the crucial 200 day EMA. Ultimately though, I think we’ve got a lot more sideways action in front of us than anything else.

Ready to trade our EUR/USD analysis and predictions? Here are the best European brokers to choose from.

Source link

3 03, 2025

Diabetes Supplements Market Set to Transform Nutritional

By |2025-03-03T14:55:22+02:00March 3, 2025|Dietary Supplements News, News|0 Comments


Diabetes Supplements Market Size, Share & Forecast

The global diabetes supplements market is poised to revolutionize nutritional support for individuals managing diabetes, driven by increasing health awareness, technological innovations in supplement formulation, and the rising prevalence of diabetes worldwide. As consumers become more proactive about their health and wellness, this market is experiencing robust growth and diversification, with innovative products designed to support blood sugar regulation, enhance metabolic health, and improve overall quality of life.

Get a free sample report: https://datahorizzonresearch.com/request-sample-pdf/diabetes-supplements-market-4122

The global diabetes supplements market was valued at approximately USD 11.8 billion in 2024 and is anticipated to reach around USD 17.6 billion by 2033, reflecting a CAGR of 4.2% from 2025 to 2033.

Diabetes is a chronic condition affecting millions globally, with a rising incidence due to factors such as sedentary lifestyles, poor dietary habits, and genetic predisposition. In response, the diabetes supplements market has emerged as a critical segment within the broader nutritional supplements industry. These products aim to complement conventional diabetes management strategies by providing natural ingredients, vitamins, minerals, and herbal extracts known to support glucose metabolism, insulin sensitivity, and overall metabolic function.

Key market drivers include increased consumer awareness of preventive healthcare, the integration of alternative and complementary therapies in diabetes management, and a growing focus on personalized nutrition. As healthcare systems worldwide grapple with the economic and social burden of diabetes, nutritional supplements have gained prominence as an accessible, non-invasive means to aid in disease management and improve patient outcomes.

Ask for a discount: https://datahorizzonresearch.com/ask-for-discount/diabetes-supplements-market-4122

Market Analysis: Trends, Drivers, and Strategic Opportunities

Several interrelated trends are shaping the diabetes supplements market, contributing to its dynamic growth and offering a wealth of opportunities for manufacturers, healthcare providers, and investors:

• Rising Prevalence of Diabetes: With the global diabetic population steadily increasing, the demand for products that support glycemic control and metabolic health is at an all-time high. This trend is particularly evident in regions with rapidly evolving lifestyles and dietary habits, such as Asia-Pacific, Latin America, and the Middle East.

• Innovation in Formulation and Technology: Advances in nutritional science and supplement technology have led to the development of highly targeted formulations. These include products enriched with chromium, magnesium, alpha-lipoic acid, cinnamon extract, and other natural ingredients that have demonstrated efficacy in supporting blood sugar balance. Enhanced bioavailability, innovative delivery systems (e.g., liquid supplements, chewables, or encapsulated forms), and personalized nutrition solutions are key factors driving consumer adoption.

• Consumer Demand for Natural and Clean Label Products: Modern consumers are increasingly seeking supplements made from natural ingredients, free from synthetic additives and harmful chemicals. This demand for clean label products has spurred manufacturers to invest in organic, non-GMO, and sustainably sourced ingredients that align with consumer expectations for safety and efficacy.

• Integration of Digital Health and Wellness Platforms: The integration of digital health solutions, such as mobile apps and wearable devices, is enabling consumers to track their health metrics and tailor their supplement intake to individual needs. These platforms provide real-time feedback, support adherence to supplement regimens, and help create personalized dietary plans that complement diabetes management.

• Shift Toward Preventive and Holistic Healthcare: There is a growing emphasis on preventive healthcare strategies that focus on early intervention and holistic management of chronic conditions. Diabetes supplements are increasingly viewed not only as a complementary therapy for those already diagnosed with diabetes but also as a proactive measure for individuals at risk, including those with prediabetes or a family history of metabolic disorders.

Market Segmentation: Tailoring Products to Diverse Consumer Needs

By Product Type:

o Vitamins and Minerals

o Omega-3 Fatty Acids

o Herbal Supplements

o Others (e.g. fiber supplements, probiotics)

By Form:

o Tablets and Capsules

o Powders

o Liquids

o Others (e.g. softgels)

By Distribution Channel:

o Drug Stores

o Health Food Stores

o Online Retailers

o Direct Selling

Key Companies

• Nestle Health Science

• Abbott Laboratories

• Amway

• Nature’s Bounty

• Glanbia

Strategic Outlook and Future Growth Prospects

Looking ahead, the diabetes supplements market is set to expand rapidly as innovation continues and consumer awareness grows. Key strategic initiatives for market players include:

• Investing in Research and Development: Continuous investment in R&D is essential to develop more effective, safe, and innovative formulations. Collaborative efforts between nutritional scientists, medical professionals, and technology experts can accelerate the creation of next-generation supplements.

• Expanding Digital Integration: Leveraging digital health tools to provide personalized supplement regimens and real-time health tracking will enhance consumer engagement and adherence. Integrating digital platforms with supplement programs can also provide valuable data to refine product offerings.

• Enhancing Regulatory Compliance and Quality Assurance: As consumers become more discerning, ensuring stringent quality control and adherence to regulatory standards will be critical. Transparent labeling, third-party certifications, and rigorous clinical testing can help build consumer trust and drive market adoption.

• Strengthening Global Distribution Channels: Expanding market reach through strategic partnerships, localized manufacturing, and targeted marketing campaigns will be essential for capturing growth opportunities in emerging markets. Tailored solutions that address regional dietary habits and health concerns can further boost market penetration.

• Educating Consumers and Healthcare Providers: Initiatives to increase awareness about the benefits and proper use of diabetes supplements will be vital. Educational programs, webinars, and collaborations with healthcare professionals can help disseminate reliable information and promote informed decision-making.

Conclusion

The diabetes supplements market is at a pivotal juncture, offering promising opportunities to support millions of individuals managing diabetes and those at risk of developing the condition. By harnessing the power of innovative formulations, digital integration, and a patient-centric approach, the market is well-positioned to deliver effective nutritional solutions that complement conventional diabetes treatments and promote overall metabolic health.

Industry stakeholders-including supplement manufacturers, healthcare providers, research institutions, and investors-are encouraged to explore the vast potential of this dynamic market. By investing in advanced technologies, expanding product portfolios, and engaging in strategic collaborations, the diabetes supplements market can drive significant improvements in patient outcomes and contribute to a healthier global community.

Contact:

Ajay N

Ph: +1-970-672-0390

Latest Reports:

Clozapine Tablets Market: https://datahorizzonresearch.com/clozapine-tablets-market-10156

Co2 Sampling Cannula Market: https://datahorizzonresearch.com/co2-sampling-cannula-market-10155

Coccidiosis Vaccine For Chickens Market: https://datahorizzonresearch.com/coccidiosis-vaccine-for-chickens-market-10154

Clostridium Botulinum Infection Treatment Market: https://datahorizzonresearch.com/clostridium-botulinum-infection-treatment-market-10153

Closures For Food Market: https://datahorizzonresearch.com/closures-for-food-market-10152

Company Name: DataHorizzon Research

Address: North Mason Street, Fort Collins,

Colorado, United States.

Ph: +1-970-672-0390

DataHorizzon is a market research and advisory company that assists organizations across the globe in formulating growth strategies for changing business dynamics. Its offerings include consulting services across enterprises and business insights to make actionable decisions. DHR’s comprehensive research methodology for predicting long-term and sustainable trends in the market facilitates complex decisions for organizations.

This release was published on openPR.


Source link

3 03, 2025

Polygon (MATIC) Price Prediction March 2025, 2026, 2030, 2040

By |2025-03-03T14:53:20+02:00March 3, 2025|Crypto News, News|0 Comments

Polygon has created history with its mind blowing hold over the world. The financial system was revolutionized when Polygon started climbing the ladder. The coin is expected to show a surge in the coming days, but it would require a technical eye to understand. It is utmost important for any trader to understand the charts and then invest their hard earned money.

In this article, you will learn how Polygon is anticipated to perform in the coming years. Read the technical analysis and everything you need to know about the coin.

  • The real-time price of MATIC to USD is $0.28126861
  • Our indicators show that the market sentiments of Polygon are mixed, still the 24hour volume is $172.30M

Polygon (MATIC) Price Prediction 2025

Drawing insights from historical Polygon price data, CoinGape’s experienced team of analysts projects intriguing scenarios for 2025. Here’s what investors can consider:

Minimum Price: By 2025, Polygon could stabilize around a minimum of $0.2404221.

Maximum Potential: The upper limit might reach an impressive $0.2841190.

Average Trading Price: On average, expect Polygon to trade around $0.2600857.

Month Minimum Price Average Price Maximum Price Potential ROI
January $0.2805176 $0.2823183 $0.2841190 1.28%
February $0.2771563 $0.2787769 $0.2803976 1.17%
March $0.2734349 $0.2752356 $0.2770363 1.32%
April $0.2698335 $0.2715742 $0.2733148 1.29%
May $0.2661121 $0.2679127 $0.2697134 1.35%
June $0.2625107 $0.2642513 $0.2659920 1.33%
July $0.2587892 $0.2605899 $0.2623906 1.39%
August $0.2550678 $0.2568685 $0.2586692 1.41%
September $0.2514664 $0.2532071 $0.2549477 1.38%
October $0.2477450 $0.2495457 $0.2513464 1.45%
November $0.2441436 $0.2458842 $0.2476249 1.43%
December $0.2404221 $0.2422228 $0.2440235 1.50%

MATIC Price Prediction for April 2025

April could sprinkle Polygon with a mix of dips and peaks. Prices might shower down to $0.2698335 but rebound to $0.2733148, preparing for a vibrant season ahead.

May 2025 Polygon Price Prediction

With the full bloom of spring, the Polygon price could mirror the growth and vibrancy of the season. A minimum of $0.2661121 could represent the seeding of investments, with a maximum of $0.2697134 if market optimism sustains.

MATIC Price Prediction for June 2025

The start of summer might bring calm stability to the MATIC price, with a steady floor of $0.2625107 and a sunny ceiling of $0.2659920

Polygon (MATIC) Price Prediction for July 2025

With a history of notable price swings, the Polygon coin sees a rise to $0.2623906 mark in July but occasion pullback may plunge to a low of $0.2587892

August 2025 MATIC Price Forecast

As the summer concludes, Polygon might see a heightened fluctuation. Relaxing from a lazy low $0.2550678 to an active $0.2586692 , the market could reflect the changing seasons.

Polygon Price Prediction: September 2025

Polygon could see a boost in activity and price, potentially ranging from an educated guess of $0.2514664 to a learned high of $0.2549477

October 2025: MATIC Price Forecast

October’s spooky season could bring eerie market movements, with Polygon’s price potentially ghosting from a haunting low of $0.2477450 to a spirited high of $0.2513464

Polygon Price Prediction November 2025

In a month of giving thanks, Polygon might harvest gains, with prices potentially ranging from a thankful low of $0.2441436 to a generous high of $0.2476249 , as the community reflects on the year’s bounty.

MATIC Price Prediction December 2025

Wrapping up the year, the MATIC price could be wrapped in a festive rally, with prices potentially resting at a bottom $0.2404221 or climbing to a celebratory $0.2440235 , embodying the season’s warmth and cheer.

Polygon (MATIC) Price Prediction 2026

As Polygon continues to evolve, 2026 could mark a pivotal year of technological breakthroughs and wider adoption. With the ecosystem maturing, anticipate Polygon to navigate the year with a minimum price of $0.1966052 and possibly reaching exhilarating highs of $0.2403021.

Month Minimum Price Average Price Maximum Price Potential ROI
January $0.2367007 $0.2385014 $0.2403021 1.52%
February $0.2333394 $0.2349600 $0.2365807 1.39%
March $0.2296180 $0.2314187 $0.2332194 1.57%
April $0.2260166 $0.2277573 $0.2294979 1.54%
May $0.2222951 $0.2240958 $0.2258965 1.62%
June $0.2186938 $0.2204344 $0.2221751 1.59%
July $0.2149723 $0.2167730 $0.2185737 1.68%
August $0.2112509 $0.2130516 $0.2148523 1.70%
September $0.2076495 $0.2093902 $0.2111308 1.68%
October $0.2039281 $0.2057288 $0.2075295 1.77%
November $0.2003267 $0.2020673 $0.2038080 1.74%
December $0.1966052 $0.1984059 $0.2002066 1.83%

Polygon Price Prediction for January 2026

As the new year unfolds, Polygon could find itself navigating through the uncertainties and a flood of new investment from market participants. The renewed recovery may surge the MATIC price to a high of $0.2403021, while occasional mark swing lows at $0.2367007

February 2026 MATIC Prediction

Building up on January’s recovery, analysts believe the Polygon price could rise to a new high $0.2365807 in February, while the correction trend may pull the asset back to the $0.2333394 mark.

Polygon (MATIC) Price Prediction March 2026

As winter’s grip loosens, Polygon might experience a thaw in market hesitancy, potentially leading to a spring of investment activity. The MATIC price could find suitable support at a low of $0.2296180, while a recovery trend may see a rise to the $0.2332194 mark.

April 2026 : Polygon Price Forecast

April may shower Polygon with volatility, presenting a mix of potential dips and surges. Prices could fluctuate from a low of $0.2260166, up to a revitalized high of $0.2294979

Polygon Price Prediction for May 2026

Mirroring the growth of spring, the crypto analyst predicts the MATIC price to set a minimum price of $0.2222951, with potential growth pushing the maximum to $0.2258965

MATIC Price Prediction for June 2026

The onset of summer could bring a calming effect on Polygon’s volatility, stabilizing prices. The price swing may find a steady base at $0.2221751, while a potential may ascent to $0.2186938

Polygon Price Prediction for July 2026

With summer at its peak, Polygon might ride a wave of heightened market activity, potentially reaching up to $0.2185737, while bottom support could be located at $0.2149723

August 2026 : Polygon Price Prediction

August may witness stable price action, as the Polygon price may recuperate its exhausted bullish momentum, The potential consolidation may uplift the MATIC price to $0.2148523, while the correction phase may plunge the price to a low of $0.2112509

Polygon Price Forecast for September 2026

The arrival of autumn might rejuvenate Polygon’s market activity, with prices potentially ranging from a base support of $0.2076495 to a robust high of $0.2111308

MATIC Price Prediction October 2026

The Halloween month may also haunt Polygon holders with new correction trends as the price may plunged to a low of $0.2039281, while some upswing could mark high at $0.2075295

Polygon Price Prediction for November 2026

In a time of gratitude, the Polygon holder seek for pullback opportunity be the ongoing correction seek suitable support. Thus, the MATIC price could see an extended correction to $0.2003267, while the bullish swing could reach $0.2038080 high.

Polygon Price Forecast for December 2026

Closing the year, Polygon could embrace a festive spirit, and drive a rally to $0.2002066 high, while occasional pullback seek support at $0.1966052 low.

Polygon (MATIC) Price Prediction 2027

By 2027, Polygon’s integration into global finance and decentralized applications could be profound. As industries embrace blockchain, the MATIC price might reflect this universal adoption, ranging from a solid foundation of $0.1527883 to record peaks of $0.1964852.

Month Minimum Price Average Price Maximum Price Potential ROI
January $0.1928838 $0.1946845 $0.1964852 1.87%
February $0.1895225 $0.1911431 $0.1927638 1.71%
March $0.1858011 $0.1876018 $0.1894025 1.94%
April $0.1821997 $0.1839404 $0.1856810 1.91%
May $0.1784782 $0.1802789 $0.1820796 2.02%
June $0.1748769 $0.1766175 $0.1783582 1.99%
July $0.1711554 $0.1729561 $0.1747568 2.10%
August $0.1674340 $0.1692347 $0.1710354 2.15%
September $0.1638326 $0.1655733 $0.1673139 2.12%
October $0.1601112 $0.1619119 $0.1637125 2.25%
November $0.1565098 $0.1582504 $0.1599911 2.22%
December $0.1527883 $0.1545890 $0.1563897 2.36%

Polygon (MATIC) Price Prediction 2028

With scalability solutions fully operational, 2028 could witness Polygon handling unprecedented transaction volumes seamlessly. This efficiency might translate into market confidence, propelling prices from a robust $0.1088514 to a peak performance of $0.1526683.

Month Minimum Price Average Price Maximum Price Potential ROI
January $0.1490669 $0.1508676 $0.1526683 2.42%
February $0.1455856 $0.1472662 $0.1489469 2.31%
March $0.1418641 $0.1436648 $0.1454655 2.54%
April $0.1382627 $0.1400034 $0.1417441 2.52%
May $0.1345413 $0.1363420 $0.1381427 2.68%
June $0.1309399 $0.1326806 $0.1344212 2.66%
July $0.1272185 $0.1290192 $0.1308199 2.83%
August $0.1234970 $0.1252977 $0.1270984 2.92%
September $0.1198956 $0.1216363 $0.1233770 2.90%
October $0.1161742 $0.1179749 $0.1197756 3.10%
November $0.1125728 $0.1143135 $0.1160542 3.09%
December $0.1088514 $0.1106521 $0.1124528 3.31%

Polygon (MATIC) Price Prediction 2029

As the ethos of decentralization takes deeper root globally, Polygon’s pivotal role could see it reaching new market heights. From a decentralized bedrock of $0.0650345, the MATIC price could ascend to visionary heights of $0.1087313, reflecting its core contribution to a decentralized world.

Month Minimum Price Average Price Maximum Price Potential ROI
January $0.1051299 $0.1069306 $0.1087313 3.43%
February $0.1017687 $0.1033893 $0.1050099 3.18%
March $0.0980472 $0.0998479 $0.1016486 3.67%
April $0.0944458 $0.0961865 $0.0979272 3.69%
May $0.0907244 $0.0925251 $0.0943258 3.97%
June $0.0871230 $0.0888637 $0.0906043 4.00%
July $0.0834016 $0.0852023 $0.0870030 4.32%
August $0.0796801 $0.0814808 $0.0832815 4.52%
September $0.0760787 $0.0778194 $0.0795601 4.58%
October $0.0723573 $0.0741580 $0.0759587 4.98%
November $0.0687559 $0.0704966 $0.0722373 5.06%
December $0.0650345 $0.0668352 $0.0686359 5.54%

Polygon (MATIC) Price Prediction 2030

Rounding out a transformative decade, 2030 might highlight Polygon as a linchpin in the crypto economy. With its infrastructure underpinning countless applications, expect Polygon to range from a minimum price of $0.0212176, to a potential zenith of $0.0649144.

Month Minimum Price Average Price Maximum Price Potential ROI
January $0.0613130 $0.0631137 $0.0649144 5.87%
February $0.0579517 $0.0595724 $0.0611930 5.59%
March $0.0542303 $0.0560310 $0.0578317 6.64%
April $0.0506289 $0.0523696 $0.0541103 6.88%
May $0.0469075 $0.0487082 $0.0505089 7.68%
June $0.0433061 $0.0450468 $0.0467874 8.04%
July $0.0395847 $0.0413854 $0.0431861 9.10%
August $0.0358632 $0.0376639 $0.0394646 10.04%
September $0.0322618 $0.0340025 $0.0357432 10.79%
October $0.0285404 $0.0303411 $0.0321418 12.62%
November $0.0249390 $0.0266797 $0.0284204 13.96%
December $0.0212176 $0.0230183 $0.0248190 16.97%

Polygon (MATIC) Price Prediction 2031

After meticulous analysis spanning years, crypto experts have unveiled their MATIC price estimations for 2031 with Polygon poised to trade at a robust a minimum of $0.0210975. Optimistically, MATIC could surge to impressive heights, potentially reaching $0.0225993 . On average, they anticipate Polygon’s price to stabilize around $0.0218634 in 2032.

Month Minimum Price Average Price Maximum Price Potential ROI
January $0.0174961 $0.0192968 $0.0210975 20.58%
February $0.0141348 $0.0157555 $0.0173761 22.93%
March $0.0104134 $0.0122141 $0.0140148 34.58%
April $0.0068120 $0.0085527 $0.0102934 51.11%
May $0.0030906 $0.0048913 $0.0066920 116.53%
June $0.0005108 $0.0012299 $0.0029705 481.54%
July $0.0006309 $0.0024315 $0.0042322 570.88%
August $0.0043523 $0.0061530 $0.0079537 82.75%
September $0.0080737 $0.0098144 $0.0115551 43.12%
October $0.0116751 $0.0134758 $0.0152765 30.85%
November $0.0153965 $0.0171372 $0.0188779 22.61%
December $0.0189979 $0.0207986 $0.0225993 18.96%

Polygon (MATIC) Price Prediction 2032

Experts looking into the price of Polygon throughout the next decade project the highest peak in 2032 at $0.0665363. Historical data shows that Polygon may stabilize during this time and average at $0.0645639. It is prudent to anticipate volatility at this price level, projecting a $0.0628148 per MATIC.

Month Minimum Price Average Price Maximum Price Potential ROI
January $0.0227194 $0.0245201 $0.0263208 15.85%
February $0.0264408 $0.0281215 $0.0298021 12.71%
March $0.0299222 $0.0317228 $0.0335235 12.04%
April $0.0336436 $0.0353843 $0.0371249 10.35%
May $0.0372450 $0.0390457 $0.0408464 9.67%
June $0.0409664 $0.0427071 $0.0444478 8.50%
July $0.0445678 $0.0463685 $0.0481692 8.08%
August $0.0482892 $0.0500899 $0.0518906 7.46%
September $0.0520107 $0.0537513 $0.0554920 6.69%
October $0.0556121 $0.0574128 $0.0592135 6.48%
November $0.0593335 $0.0610742 $0.0628148 5.87%
December $0.0629349 $0.0647356 $0.0665363 5.72%

Polygon (MATIC) Price Prediction 2033

Years of technical analysis blended with fundamental and macro factors like inflation would keep Polygon price volatile in 2033. Optimistic excerpts believe that Polygon may top $0.1103532. during this year while averaging at $0.1086413. Due to volatility in the market, a minimum price of $0.1066317. could occur.

Month Minimum Price Average Price Maximum Price Potential ROI
January $0.0666563 $0.0684570 $0.0702577 5.40%
February $0.0703778 $0.0719984 $0.0736190 4.61%
March $0.0737391 $0.0755397 $0.0773404 4.88%
April $0.0774605 $0.0792012 $0.0809418 4.49%
May $0.0810619 $0.0828626 $0.0846633 4.44%
June $0.0847833 $0.0865240 $0.0882647 4.11%
July $0.0883847 $0.0901854 $0.0919861 4.07%
August $0.0921061 $0.0939068 $0.0957075 3.91%
September $0.0958276 $0.0975682 $0.0993089 3.63%
October $0.0994290 $0.1012297 $0.1030304 3.62%
November $0.1031504 $0.1048911 $0.1066317 3.38%
December $0.1067518 $0.1085525 $0.1103532 3.37%

Polygon (MATIC) Price Prediction 2034

Technical analysis and macro factors suggest that Polygon price will remain volatile in 2034. Optimistic predictions indicate that Polygon may reach a maximum price of $0.1541701, with an average price of $0.1521233 and a minimum price of $0.1504486.

Month Minimum Price Average Price Maximum Price Potential ROI
January $0.1104732 $0.1122739 $0.1140746 3.26%
February $0.1141947 $0.1158153 $0.1174359 2.84%
March $0.1175560 $0.1193567 $0.1211573 3.06%
April $0.1212774 $0.1230181 $0.1247587 2.87%
May $0.1248788 $0.1266795 $0.1284802 2.88%
June $0.1286002 $0.1303409 $0.1320816 2.71%
July $0.1322016 $0.1340023 $0.1358030 2.72%
August $0.1359230 $0.1377237 $0.1395244 2.65%
September $0.1396445 $0.1413852 $0.1431258 2.49%
October $0.1432459 $0.1450466 $0.1468473 2.51%
November $0.1469673 $0.1487080 $0.1504486 2.37%
December $0.1505687 $0.1523694 $0.1541701 2.39%

Polygon (MATIC) Price Prediction 2035

A combination of technical and fundamental analysis indicates that Polygon price will experience significant fluctuations in 2035. Optimistic forecasts suggest that Polygon may reach a peak price of $0.1979870, with an average trading price of $0.1961263 and a minimum price of $0.1942656.

Month Minimum Price Average Price Maximum Price Potential ROI
January $0.1542901 $0.1560908 $0.1578915 2.33%
February $0.1580116 $0.1596322 $0.1612528 2.05%
March $0.1613729 $0.1631736 $0.1649743 2.23%
April $0.1650943 $0.1668350 $0.1685756 2.11%
May $0.1686957 $0.1704964 $0.1722971 2.13%
June $0.1724171 $0.1741578 $0.1758985 2.02%
July $0.1760185 $0.1778192 $0.1796199 2.05%
August $0.1797399 $0.1815406 $0.1833413 2.00%
September $0.1834614 $0.1852021 $0.1869427 1.90%
October $0.1870628 $0.1888635 $0.1906642 1.93%
November $0.1907842 $0.1925249 $0.1942656 1.82%
December $0.1943856 $0.1961863 $0.1979870 1.85%

Polygon (MATIC) Price Prediction 2036

Technical analysis coupled with fundamental analysis shows that Polygon price will be highly erratic and volatile in 2036.Polygon could reach a top of $0.2419239 during this year after forming a low of $0.2382025. Considering these, the average price could hover around $0.2401004.

Month Minimum Price Average Price Maximum Price Potential ROI
January $0.1981070 $0.1999077 $0.2017084 1.82%
February $0.2018285 $0.2035091 $0.2051898 1.67%
March $0.2053098 $0.2071105 $0.2089112 1.75%
April $0.2090312 $0.2107719 $0.2125126 1.67%
May $0.2126326 $0.2144333 $0.2162340 1.69%
June $0.2163541 $0.2180947 $0.2198354 1.61%
July $0.2199555 $0.2217562 $0.2235569 1.64%
August $0.2236769 $0.2254776 $0.2272783 1.61%
September $0.2273983 $0.2291390 $0.2308797 1.53%
October $0.2309997 $0.2328004 $0.2346011 1.56%
November $0.2347212 $0.2364618 $0.2382025 1.48%
December $0.2383225 $0.2401232 $0.2419239 1.51%

Polygon (MATIC) Price Prediction 2037

In addition to technical analysis, macro factors also play a crucial role in determining price projections. Considering both these, Polygon price will continue its volatile movement in 2037 with optimistic predictions of $0.2857408. Polygon’s average price could trade around $0.2838801 and a minimum price of 0.2820194.

Month Minimum Price Average Price Maximum Price Potential ROI
January $0.2420440 $0.2438447 $0.2456454 1.49%
February $0.2457654 $0.2473860 $0.2490067 1.32%
March $0.2491267 $0.2509274 $0.2527281 1.45%
April $0.2528482 $0.2545888 $0.2563295 1.38%
May $0.2564495 $0.2582502 $0.2600509 1.40%
June $0.2601710 $0.2619116 $0.2636523 1.34%
July $0.2637724 $0.2655731 $0.2673738 1.37%
August $0.2674938 $0.2692945 $0.2710952 1.35%
September $0.2712152 $0.2729559 $0.2746966 1.28%
October $0.2748166 $0.2766173 $0.2784180 1.31%
November $0.2785381 $0.2802787 $0.2820194 1.25%
December $0.2821395 $0.2839401 $0.2857408 1.28%

Polygon (MATIC) Price Prediction 2038

Market analysts predict that Polygon price will remain highly volatile in 2038, influenced by various technical and macro factors. Polygon is expected to reach a maximum price of $0.3295577 during this year, with a potential low of $0.3258363 and an average trading price of $0.3278087.

Month Minimum Price Average Price Maximum Price Potential ROI
January $0.2858609 $0.2876616 $0.2894623 1.26%
February $0.2895823 $0.2912029 $0.2928236 1.12%
March $0.2929436 $0.2947443 $0.2965450 1.23%
April $0.2966651 $0.2984057 $0.3001464 1.17%
May $0.3002664 $0.3020671 $0.3038678 1.20%
June $0.3039879 $0.3057286 $0.3074692 1.15%
July $0.3075893 $0.3093900 $0.3111907 1.17%
August $0.3113107 $0.3131114 $0.3149121 1.16%
September $0.3150321 $0.3167728 $0.3185135 1.11%
October $0.3186335 $0.3204342 $0.3222349 1.13%
November $0.3223550 $0.3240956 $0.3258363 1.08%
December $0.3259564 $0.3277571 $0.3295577 1.10%

Polygon (MATIC) Price Prediction 2039

Technical analysis and macroeconomic factors suggest that Polygon price will continue to experience significant price swings in 2039. Optimistic predictions indicate that Polygon may top $0.3733746 during this year, with an average price of $0.3715511 and a minimum price of $0.3696532.

Month Minimum Price Average Price Maximum Price Potential ROI
January $0.3296778 $0.3314785 $0.3332792 1.09%
February $0.3333992 $0.3350199 $0.3366405 0.97%
March $0.3367605 $0.3385612 $0.3403619 1.07%
April $0.3404820 $0.3422226 $0.3439633 1.02%
May $0.3440833 $0.3458840 $0.3476847 1.05%
June $0.3478048 $0.3495455 $0.3512861 1.00%
July $0.3514062 $0.3532069 $0.3550076 1.02%
August $0.3551276 $0.3569283 $0.3587290 1.01%
September $0.3588490 $0.3605897 $0.3623304 0.97%
October $0.3624504 $0.3642511 $0.3660518 0.99%
November $0.3661719 $0.3679125 $0.3696532 0.95%
December $0.3697733 $0.3715740 $0.3733746 0.97%

Polygon (MATIC) Price Prediction 2040

Cryptocurrency analysts’ projections for Polygon in 2040 highlight a potential rise to a peak of $0.4173116. Historical performance suggests a trading floor of , with an expected average trading price of around $0.4154509

Month Minimum Price Average Price Maximum Price Potential ROI
January $0.3734947 $0.3752954 $0.3770961 0.96%
February $0.3772161 $0.3788968 $0.3805774 0.89%
March $0.3806975 $0.3824982 $0.3842989 0.95%
April $0.3844189 $0.3861596 $0.3879003 0.91%
May $0.3880203 $0.3898210 $0.3916217 0.93%
June $0.3917417 $0.3934824 $0.3952231 0.89%
July $0.3953431 $0.3971438 $0.3989445 0.91%
August $0.3990646 $0.4008653 $0.4026659 0.90%
September $0.4027860 $0.4045267 $0.4062673 0.86%
October $0.4063874 $0.4081881 $0.4099888 0.89%
November $0.4101088 $0.4118495 $0.4135902 0.85%
December $0.4137102 $0.4155109 $0.4173116 0.87%

Polygon (MATIC) Price Prediction 2041

A combination of technical and fundamental analysis indicates that Polygon price will experience significant fluctuations in 2041. Optimistic forecasts suggest that Polygon may reach a peak price of 0.4611285, with an average trading price of $0.4593422 and a minimum price of $0.4574071.

Month Minimum Price Average Price Maximum Price Potential ROI
January $0.4174316 $0.4192323 $0.4210330 0.86%
February $0.4211531 $0.4227737 $0.4243943 0.77%
March $0.4245144 $0.4263151 $0.4281158 0.85%
April $0.4282358 $0.4299765 $0.4317172 0.81%
May $0.4318372 $0.4336379 $0.4354386 0.83%
June $0.4355586 $0.4372993 $0.4390400 0.80%
July $0.4391600 $0.4409607 $0.4427614 0.82%
August $0.4428815 $0.4446822 $0.4464829 0.81%
September $0.4466029 $0.4483436 $0.4500842 0.78%
October $0.4502043 $0.4520050 $0.4538057 0.80%
November $0.4539257 $0.4556664 $0.4574071 0.77%
December $0.4575271 $0.4593278 $0.4611285 0.79%

Polygon (MATIC) Price Prediction 2042

Market analysts predict that Polygon price will remain highly volatile in 2042, influenced by various technical and macro factors. Polygon is expected to reach a maximum price of $0.5049454 during this year, with a potential low of $0.5012240 and an average trading price of $0.5031591.

Month Minimum Price Average Price Maximum Price Potential ROI
January $0.4612485 $0.4630492 $0.4648499 0.78%
February $0.4649700 $0.4665906 $0.4682112 0.70%
March $0.4683313 $0.4701320 $0.4719327 0.77%
April $0.4720527 $0.4737934 $0.4755341 0.74%
May $0.4756541 $0.4774548 $0.4792555 0.76%
June $0.4793755 $0.4811162 $0.4828569 0.73%
July $0.4829769 $0.4847776 $0.4865783 0.75%
August $0.4866984 $0.4884991 $0.4902998 0.74%
September $0.4904198 $0.4921605 $0.4939011 0.71%
October $0.4940212 $0.4958219 $0.4976226 0.73%
November $0.4977426 $0.4994833 $0.5012240 0.70%
December $0.5013440 $0.5031447 $0.5049454 0.72%

Polygon (MATIC) Price Prediction 2043

Technical analysis and macroeconomic factors suggest that Polygon price will continue to experience significant price swings in 2043. Optimistic predictions indicate that Polygon may top $0.5487623 during this year, with an average price of $0.5469388 and a minimum price of $0.5450409.

Month Minimum Price Average Price Maximum Price Potential ROI
January $0.5050655 $0.5068661 $0.5086668 0.71%
February $0.5087869 $0.5104075 $0.5120281 0.64%
March $0.5121482 $0.5139489 $0.5157496 0.70%
April $0.5158696 $0.5176103 $0.5193510 0.67%
May $0.5194710 $0.5212717 $0.5230724 0.69%
June $0.5231924 $0.5249331 $0.5266738 0.67%
July $0.5267938 $0.5285945 $0.5303952 0.68%
August $0.5305153 $0.5323160 $0.5341167 0.68%
September $0.5342367 $0.5359774 $0.5377180 0.65%
October $0.5378381 $0.5396388 $0.5414395 0.67%
November $0.5415595 $0.5433002 $0.5450409 0.64%
December $0.5451609 $0.5469616 $0.5487623 0.66%

Polygon (MATIC) Price Prediction 2044

A thorough analysis of technical and fundamental factors reveals that Polygon price will remain highly erratic in 2044. Polygon is expected to reach a peak price of $0.5926993 during this year, with a potential low of $0.5889778 and an average trading price of $0.5908385.

Month Minimum Price Average Price Maximum Price Potential ROI
January $0.5488824 $0.5506831 $0.5524837 0.66%
February $0.5526038 $0.5542844 $0.5559651 0.61%
March $0.5560851 $0.5578858 $0.5596865 0.65%
April $0.5598066 $0.5615472 $0.5632879 0.62%
May $0.5634080 $0.5652087 $0.5670094 0.64%
June $0.5671294 $0.5688701 $0.5706107 0.61%
July $0.5707308 $0.5725315 $0.5743322 0.63%
August $0.5744522 $0.5762529 $0.5780536 0.63%
September $0.5781737 $0.5799143 $0.5816550 0.60%
October $0.5817750 $0.5835757 $0.5853764 0.62%
November $0.5854965 $0.5872372 $0.5889778 0.59%
December $0.5890979 $0.5908986 $0.5926993 0.61%

Polygon (MATIC) Price Prediction 2045

Market experts predict that Polygon price will experience significant volatility in 2045, driven by various technical and macro factors. Optimistic forecasts suggest that Polygon may reach a maximum price of $0.6365162 during this year, with an average trading price of $0.6346554 and a minimum price of 0.6327947.

Month Minimum Price Average Price Maximum Price Potential ROI
January $0.5928193 $0.5946200 $0.5964207 0.61%
February $0.5965407 $0.5981614 $0.5997820 0.54%
March $0.5999020 $0.6017027 $0.6035034 0.60%
April $0.6036235 $0.6053641 $0.6071048 0.58%
May $0.6072249 $0.6090256 $0.6108263 0.59%
June $0.6109463 $0.6126870 $0.6144276 0.57%
July $0.6145477 $0.6163484 $0.6181491 0.59%
August $0.6182691 $0.6200698 $0.6218705 0.58%
September $0.6219906 $0.6237312 $0.6254719 0.56%
October $0.6255920 $0.6273926 $0.6291933 0.58%
November $0.6293134 $0.6310541 $0.6327947 0.55%
December $0.6329148 $0.6347155 $0.6365162 0.57%

Polygon (MATIC) Price Prediction 2046

A combination of technical and fundamental analysis indicates that Polygon price will experience significant fluctuations in 2046. Optimistic forecasts suggest that Polygon may reach a peak price of $0.6803331, with an average trading price of $0.6785468 and a minimum price of $0.6766116.

Month Minimum Price Average Price Maximum Price Potential ROI
January $0.6366362 $0.6384369 $0.6402376 0.57%
February $0.6403576 $0.6419783 $0.6435989 0.51%
March $0.6437189 $0.6455196 $0.6473203 0.56%
April $0.6474404 $0.6491811 $0.6509217 0.54%
May $0.6510418 $0.6528425 $0.6546432 0.55%
June $0.6547632 $0.6565039 $0.6582445 0.53%
July $0.6583646 $0.6601653 $0.6619660 0.55%
August $0.6620860 $0.6638867 $0.6656874 0.54%
September $0.6658075 $0.6675481 $0.6692888 0.52%
October $0.6694089 $0.6712095 $0.6730102 0.54%
November $0.6731303 $0.6748710 $0.6766116 0.52%
December $0.6767317 $0.6785324 $0.6803331 0.53%

Polygon (MATIC) Price Prediction 2047

Market analysts predict that Polygon price will remain highly volatile in 2047, influenced by various technical and macro factors. Polygon is expected to reach a maximum price of $0.7241500 during this year, with a potential low of $0.7204285 and an average trading price of $0.7221032.

Month Minimum Price Average Price Maximum Price Potential ROI
January $0.6804531 $0.6822538 $0.6840545 0.53%
February $0.6841746 $0.6857952 $0.6874158 0.47%
March $0.6875358 $0.6893365 $0.6911372 0.52%
April $0.6912573 $0.6929980 $0.6947386 0.50%
May $0.6948587 $0.6966594 $0.6984601 0.52%
June $0.6985801 $0.7003208 $0.7020615 0.50%
July $0.7021815 $0.7039822 $0.7057829 0.51%
August $0.7059029 $0.7077036 $0.7095043 0.51%
September $0.7096244 $0.7113650 $0.7131057 0.49%
October $0.7132258 $0.7150265 $0.7168271 0.50%
November $0.7169472 $0.7186879 $0.7204285 0.49%
December $0.7205486 $0.7223493 $0.7241500 0.50%

Polygon (MATIC) Price Prediction 2048

Technical analysis and macroeconomic factors suggest that Polygon price will continue to experience significant price swings in 2048. Optimistic predictions indicate that Polygon may top $0.7680869 during this year, with an average price of $0.7661518 and a minimum price of $0.7643655.

Month Minimum Price Average Price Maximum Price Potential ROI
January $0.7242700 $0.7260707 $0.7278714 0.50%
February $0.7279915 $0.7296721 $0.7313528 0.46%
March $0.7314728 $0.7332735 $0.7350742 0.49%
April $0.7351942 $0.7369349 $0.7386756 0.47%
May $0.7387956 $0.7405963 $0.7423970 0.49%
June $0.7425171 $0.7442577 $0.7459984 0.47%
July $0.7461184 $0.7479191 $0.7497198 0.48%
August $0.7498399 $0.7516406 $0.7534413 0.48%
September $0.7535613 $0.7553020 $0.7570427 0.46%
October $0.7571627 $0.7589634 $0.7607641 0.48%
November $0.7608841 $0.7626248 $0.7643655 0.46%
December $0.7644855 $0.7662862 $0.7680869 0.47%

Polygon (MATIC) Price Prediction 2049

A thorough analysis of technical and fundamental factors reveals that Polygon price will remain highly erratic in 2049. Polygon is expected to reach a peak price of $0.8119038 during this year, with a potential low of $0.8081824 and an average trading price of $0.8101920.

Month Minimum Price Average Price Maximum Price Potential ROI
January $0.7682070 $0.7700077 $0.7718084 0.47%
February $0.7719284 $0.7735490 $0.7751697 0.42%
March $0.7752897 $0.7770904 $0.7788911 0.46%
April $0.7790111 $0.7807518 $0.7824925 0.45%
May $0.7826125 $0.7844132 $0.7862139 0.46%
June $0.7863340 $0.7880746 $0.7898153 0.44%
July $0.7899354 $0.7917360 $0.7935367 0.46%
August $0.7936568 $0.7954575 $0.7972582 0.45%
September $0.7973782 $0.7991189 $0.8008596 0.44%
October $0.8009796 $0.8027803 $0.8045810 0.45%
November $0.8047010 $0.8064417 $0.8081824 0.43%
December $0.8083024 $0.8101031 $0.8119038 0.45%

Polygon (MATIC) Price Prediction 2050

Toward the end of this decade, Polygon may tremendously gain momentum to achieve a record high of $0.8557207 . Analysts projected that while the trend could slow down due to profit-taking and unforeseen macroeconomic factors, $0.8519993. might be the lowest MATIC reaches during this year. Amidst the ups and downs, trading momentum may average at $0.8540461.

Month Minimum Price Average Price Maximum Price Potential ROI
January $0.8120239 $0.8138246 $0.8156253 0.44%
February $0.8157453 $0.8173659 $0.8189866 0.40%
March $0.8191066 $0.8209073 $0.8227080 0.44%
April $0.8228280 $0.8245687 $0.8263094 0.42%
May $0.8264294 $0.8282301 $0.8300308 0.44%
June $0.8301509 $0.8318915 $0.8336322 0.42%
July $0.8337523 $0.8355529 $0.8373536 0.43%
August $0.8374737 $0.8392744 $0.8410751 0.43%
September $0.8411951 $0.8429358 $0.8446765 0.41%
October $0.8447965 $0.8465972 $0.8483979 0.43%
November $0.8485180 $0.8502586 $0.8519993 0.41%
December $0.8521193 $0.8539200 $0.8557207 0.42%

Disclaimer: The presented content may include the personal opinion of the author and is subject to market condition. Do your market research before investing in cryptocurrencies. The author or the publication does not hold any responsibility for your personal financial loss.

Source link

3 03, 2025

Institutional Investors Increasingly Favor Fixed-Rate Yields in DeFi | Flash News Detail

By |2025-03-03T13:23:56+02:00March 3, 2025|News, NFT News|0 Comments


On March 3, 2025, IntoTheBlock reported that fixed-rate yields are gaining traction among institutional investors in the DeFi space, signaling a shift towards more predictable returns (IntoTheBlock, March 3, 2025). This development was first noted when the DeFi protocol Aave introduced fixed-rate yield options on February 28, 2025, leading to a 15% increase in the protocol’s total value locked (TVL) to $10.5 billion within 24 hours (Aave, February 28, 2025). Simultaneously, the price of AAVE, the native token of the Aave platform, rose by 7.2% from $200 to $214.40 within the same timeframe (CoinGecko, February 28, 2025). Additionally, Compound, another major DeFi platform, followed suit by launching its own fixed-rate yield product on March 1, 2025, which resulted in a 10% TVL increase to $8.8 billion over the next 48 hours (Compound, March 1, 2025). The COMP token experienced a 5.8% price surge from $170 to $179.86 during this period (CoinGecko, March 1, 2025). The trading volumes for AAVE and COMP also saw significant spikes, with AAVE recording a volume of $450 million and COMP reaching $320 million on their respective launch days (CoinMarketCap, February 28, 2025; CoinMarketCap, March 1, 2025). This trend underscores a growing demand for stable returns in the DeFi sector, which is further evidenced by the 22% increase in the DeFi Pulse Index (DPI) from 250 to 305 points between February 28 and March 3, 2025 (DeFi Pulse, March 3, 2025).

The introduction of fixed-rate yields has profound implications for trading strategies within the DeFi ecosystem. On March 2, 2025, the 24-hour trading volume for AAVE against USDT surged by 25% to $562.5 million, indicating strong investor interest in the token following the yield product launch (Binance, March 2, 2025). Similarly, the COMP/USDT pair experienced a 20% volume increase to $384 million over the same period (Kraken, March 2, 2025). These volume spikes suggest a bullish sentiment among traders, likely driven by the anticipation of stable returns. Moreover, the on-chain metrics reveal a 30% increase in the number of unique AAVE depositors from 10,000 to 13,000 between February 28 and March 2, 2025, and a similar 25% rise in COMP depositors from 8,000 to 10,000 over the same timeframe (IntoTheBlock, March 2, 2025). This indicates a broadening of the user base, which could further drive demand for these tokens. Additionally, the DeFi sector’s overall market sentiment has improved, as evidenced by the Crypto Fear & Greed Index rising from 45 to 55 points between February 28 and March 3, 2025, reflecting a shift from neutral to slightly bullish sentiment (Alternative.me, March 3, 2025).

Technical indicators further support the bullish outlook for AAVE and COMP. On March 3, 2025, AAVE’s 14-day Relative Strength Index (RSI) increased from 60 to 68, signaling that the token is approaching overbought territory (TradingView, March 3, 2025). Similarly, COMP’s RSI rose from 55 to 62 over the same period, indicating strong buying pressure (TradingView, March 3, 2025). The Moving Average Convergence Divergence (MACD) for AAVE showed a bullish crossover on March 2, 2025, with the MACD line crossing above the signal line, suggesting potential upward momentum (TradingView, March 2, 2025). COMP’s MACD also exhibited a bullish crossover on March 1, 2025, reinforcing the positive trend (TradingView, March 1, 2025). The trading volumes for AAVE and COMP have remained elevated, with AAVE averaging a daily volume of $400 million and COMP at $300 million between March 1 and March 3, 2025 (CoinMarketCap, March 3, 2025). These technical signals, combined with the increased trading volumes and on-chain metrics, suggest that traders might consider entering long positions on AAVE and COMP, particularly if the tokens continue to show strength against key resistance levels.

Regarding AI-related developments, there have been no direct announcements on March 3, 2025, that specifically link AI to the rise of fixed-rate yields in DeFi. However, the general sentiment around AI in the crypto space remains positive, with AI-driven trading algorithms reportedly increasing their market share by 10% since January 2025, as per a report by CryptoQuant (CryptoQuant, March 3, 2025). This growth in AI trading could indirectly influence trading volumes and market sentiment in DeFi, as AI algorithms might favor tokens with stable yield options. The correlation between AI-related tokens like SingularityNET (AGIX) and major cryptocurrencies like Bitcoin (BTC) has remained stable, with a Pearson correlation coefficient of 0.65 as of March 3, 2025 (CoinMetrics, March 3, 2025). This suggests that movements in AI tokens might still be influenced by broader market trends, including those in DeFi. Traders interested in AI-crypto crossover might look for opportunities where AI tokens react to DeFi developments, potentially creating arbitrage or trading strategies based on these correlations.


Source link

3 03, 2025

Platinum price settles below the moving average – Forecast today – 3-3-2025

By |2025-03-03T13:10:53+02:00March 3, 2025|Forex News, News|0 Comments


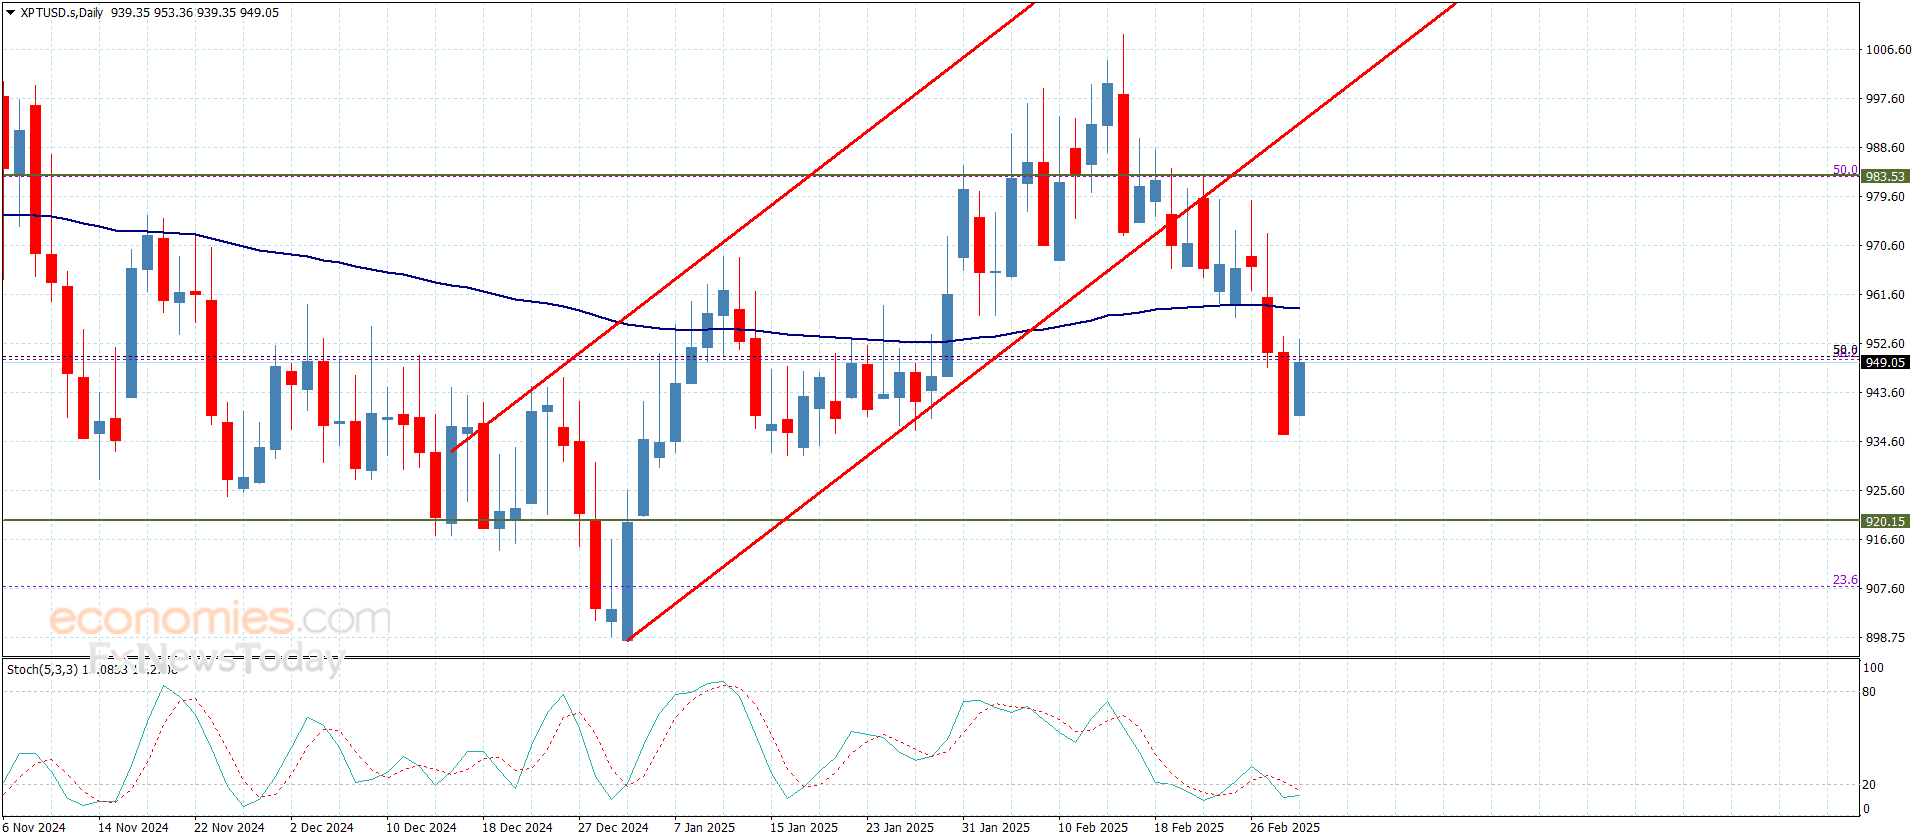
Copper price provided some additional negative trades by touching 4.4580$ level followed by forming sideways fluctuation due to the continuous contradiction between the major indicators, to notice settling near the broken additional support line now at 4.5400$.


We remind you that the frequent stability below the additional barrier 4.6800$ and stochastic attempt to provide the negative momentum will increase the chances of activating the bearish track, to keep waiting to reach the next target at 4.3900$.


The expected trading range for today is between 4.3900$ and 4.5600$


Trend forecast: Bearish


Source link

3 03, 2025

The GBPJPY tests the resistance – Forecast today – 3-3-2025

By |2025-03-03T12:56:08+02:00March 3, 2025|Forex News, News|0 Comments

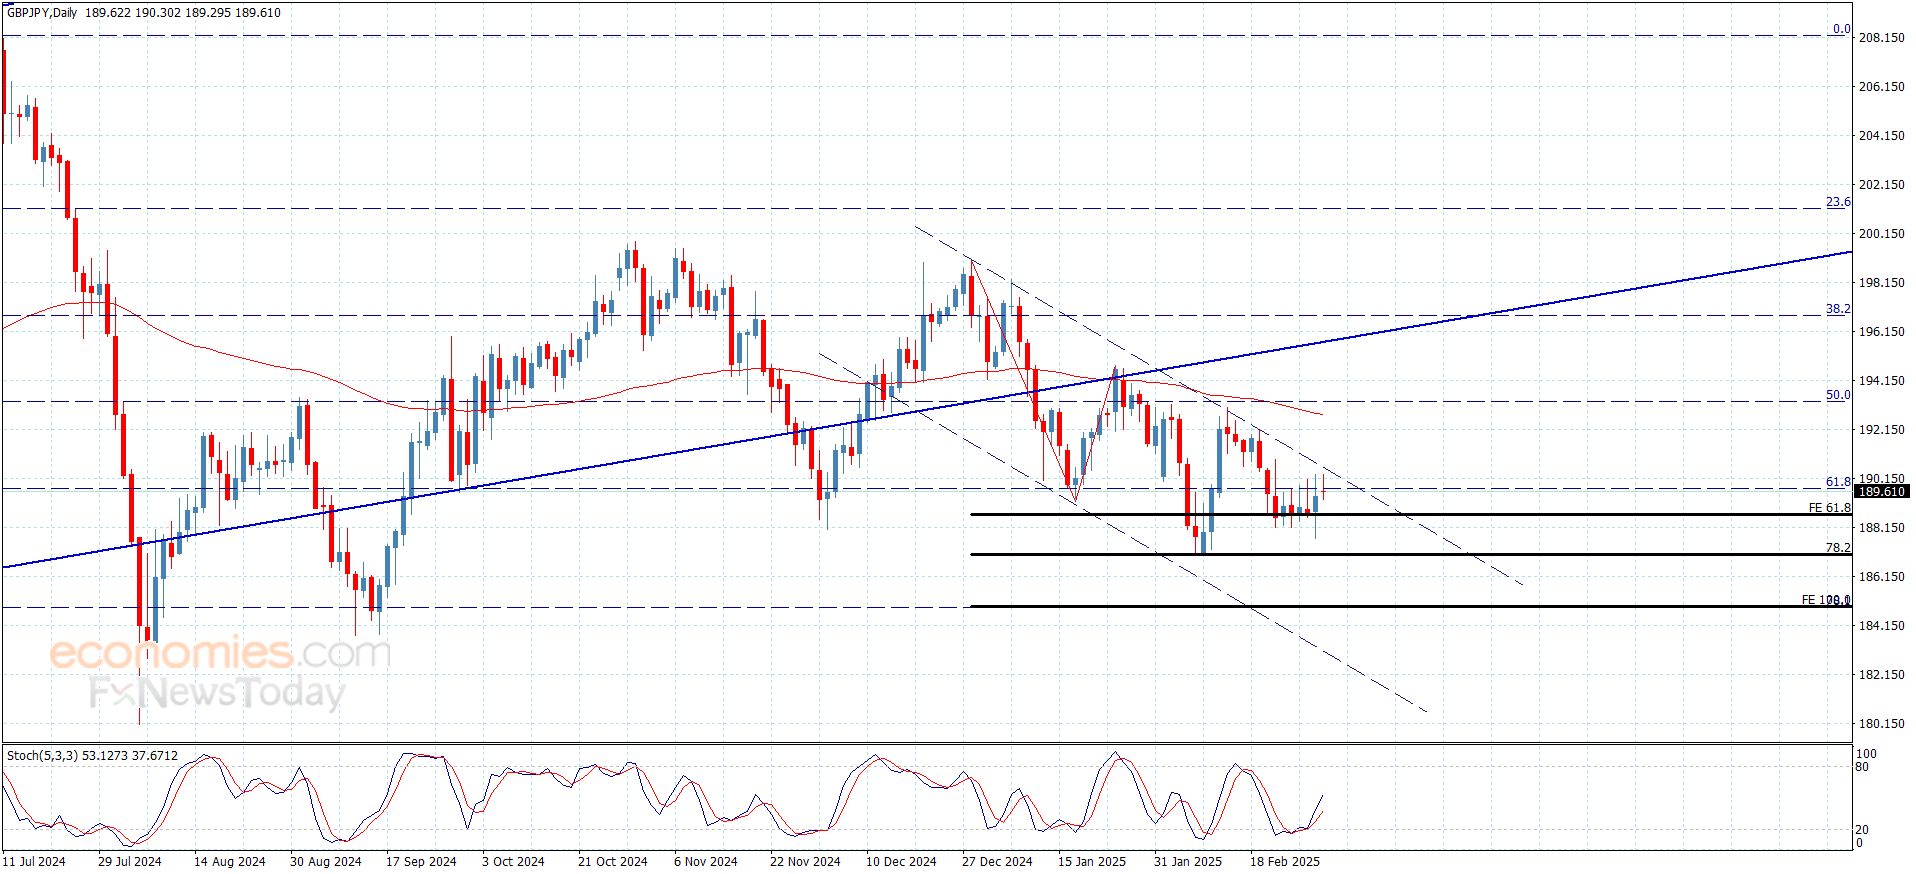
The GBPJPY pair reacted to stochastic positivity by forming correctional bullish rebound and approach the minor bearish channel’s resistance line at 190.45, while the upcoming scenario depends on the strength of this resistance, as its stability allows us to expect renewing the negative attempts by crawling towards 188.75 followed by reaching 187.90.


On the other hand, facing strong positive pressures and rallying above the current resistance will cancel the bearish overview to start forming bullish waves, expecting to target 190.80 as a first station, followed by reaching the MA55 at 192.60.


The expected trading range for today is between 188.75 and 190.50


Trend forecast: Bearish


Source link

3 03, 2025

The dangers in your daily cup of matcha tea or coffee: Influencers claim it lowers anxiety and blood pressure, but mounting evidence suggests it can also trigger a dangerous health condition…

By |2025-03-03T12:54:53+02:00March 3, 2025|Dietary Supplements News, News|0 Comments


A trendy ‘health’ drink popular with teenagers and young adults can trigger fatigue, shortness of breath and even heart problems, experts have warned.

Matcha – a Japanese concentrated form of green tea known for its vibrant colour – has become a familiar sight in supermarkets and coffee shops in recent years.

Starbucks sells an iced matcha latte, while Tesco stocks a wide range of matcha teas and ready-made drinks.

Health influencers claim drinking it can increase focus, reduce anxiety and lower blood pressure. But mounting evidence suggests too much can trigger iron deficiency. Left untreated, this can raise the risk of severe infections as well as life-threatening heart failure.

Iron, found in red meat and a variety of vegetables, is crucial for the production of red blood cells, which transport oxygen to the organs. It is also vital for a healthy immune system.

Experts now say that drinking just one matcha tea a day could cause problems.

Matcha is a vivid green, caffeinated powder made from the ground leaves of the Camellia sinensis tea plant – a type of green tea

Research suggests teenage girls, pregnant and post-menopausal women are at the highest risk of a matcha-related iron deficiency.

‘People need to be aware of the potential risks of this drink,’ says Dr Jeannine Baumgartner, an expert in nutrition and researcher at King’s College London, who has studied matcha. ‘There is a real danger of a deficiency, particularly for younger women who have higher iron needs.’

Matcha is a vivid green, caffeinated powder made from the ground leaves of the Camellia sinensis tea plant – a type of green tea. A 2022 review found that 14 studies suggested that regular consumption improves brain function, reduces stress and can aide weight loss.

In the past year alone, sales of matcha products have doubled in the UK. The arrival of the US cafe Blank Street to Britain’s high streets in 2020 is thought to have led to a surge in the popularity here, with its range of matcha teas combined with other flavours such as blueberry and white chocolate.

But it has long been known that green tea can, in some cases, trigger an iron deficiency.

This is because it contains high levels of tannins – a compound which gives tea its bitter flavour.

Research shows that tannins attach to iron molecules in the digestive system and prevent them from being absorbed.

A major review of over 150 studies in 2010 published by the Journal of Chinese Medicine found that consumption of

more than three cups of regular green tea a day reduced iron absorption. However, it is believed that matcha has an even greater effect, as one cup has nearly seven times as many tannins as a similarly sized green tea.

As well as the tannins, caffeine has also been shown to reduce iron absorption and, per gram, matcha can contain up to four times as much caffeine as coffee.

Experts say this means that even one matcha a day could have health impacts.

‘Matcha is much more problematic than green tea, as it is more concentrated so affects iron absorption even more,’ says

Prof Baumgartner. ‘Even one cup, if it is poorly timed, either during or up to two hours after a meal, will affect your iron levels.’

Iron deficiency is already a problem. Three per cent of men and 8 per cent of women in the UK have the iron deficiency condition anaemia, and it is on the rise. Symptoms include a yellowing of the skin, dizziness and depression.

Last year there was a tenfold rise in the number of people hospitalised with iron deficiency, with nearly 200,000 being admitted.

But there are steps that matcha drinkers can take to protect themselves against this complication.

‘If you add milk or lemon juice, it can neutralise the tannins, which can help with iron absorption,’ says Sarah Carolides, a London based nutritionist. ‘It’s also best to avoid using oat milk in your matcha latte as oats contain phytates, an acid which can also interfere with iron absorption.’

Timing is key for those considering a cup of green tea.

Prof Baumgartner recommends against drinking matcha within three hours before or after a meal. A 1983 study revealed a cup of green tea while eating a hamburger meal reduced iron consumption by 68 per cent.

As drinking habits change experts are calling for the guidelines to doctors looking out for iron deficiency to be updated.

‘Doctors and GPs are not aware of the link between drinks and iron absorption and that really needs to change,’ says Prof Baumgartner.

 What’s the difference?

The early symptoms of both are similar – warm to the touch, red and often painful.

But ulcers are open sores that develop when an organ’s lining or the skin breaks down but doesn’t heal properly.

They can occur on the stomach, intestines, skin or in the mouth. Ulcers can become irritated, painful and sometimes require antibiotics.

Abscesses, painful pockets of pus caused by the body trying to fight infections, are usually closed internal lumps.

They can form under the skin, in teeth or inside the body and are usually treated with minor procedures to drain the pus.

Patients are often given antibiotics and pain relievers.


Source link

Go to Top