About Editorial team of BIPNs

Main team of content of bipns.com. Any type of content should be approved by us.
26 02, 2025

Crude Oil Price Forecast: Bearish Correction Deepens as Sellers Maintain Control

By |2025-02-26T04:04:21+02:00February 26, 2025|Forex News, News|0 Comments


Down by 14.6%

At today’s low, the price of crude oil had decreased by $11.80 or 14.6% from the recent swing high at $80.76. On a relative basis, that put it at the low end of bearish corrections that have occurred since the April 2024 peak. There were four corrections identified since then that ranged from a decline of 14.7% to 18.3%. These measured moves indicate that the current correction may be close to completing and that crude oil may have a little more to fall before the correction is complete.

Monthly Bearish Reversal Points to Lower Prices

Crude oil triggered a monthly bearish reversal earlier this month (not shown) and it continues to trade near the lows of the month. This shows aggressive selling with lower monthly support in a range from around $67.11 to $66.65. Given the decisiveness of the bearish retracement, these lower price levels may yet be tested before a notable bounce. There are three more trading days before the end of February, which means that crude is at risk of ending the month in a bearish position, near the lows of the month.

Nearing Key Price Levels

Although the lower trendline provides a potential support line, the next lower support zone is from $67.11 to $66.86. That range is determined by two previous interim swing lows that were established late last year. They represent a more significant support area since a drop below that price range more clearly indicates a possible continuation of the larger bear trend.

Since the $131.31 swing high in March 2022 crude oil has been in a downtrend with a series of lower swing highs and lower swing lows. However, a new lower swing low for the downtrend was attempted in September with a decline to $65.65. But that decline failed to fall below the earlier swing low at $63.67 from May 2023. The September support zone could be challenged if the $66.86 price area fails to hold as support.

For a look at all of today’s economic events, check out our economic calendar.


Source link

26 02, 2025

Dogecoin Price Prediction: A Plunge To $0.20 Or A 400% Rally Like Before?

By |2025-02-26T03:38:53+02:00February 26, 2025|Crypto News, News|0 Comments

Dogecoin’s price has dropped to below $0.24 signaling a bearish pressure.

The price drop indicates a descending triangle breakdown pattern triggering the investors’ concern.

Amid this bearish realm, the network usage of Doge significantly declined, which points to weak demand.

Analysts have started questioning if the DOGE price is about to fall below the $0.20 psychological technical support level.

Dogecoin Price Confirms Triangle Breakdown

Dogecoin’s 4-hour chart shows a descending triangle pattern, with a strong resistance trendline keeping the bearish momentum intact.

The price fell below the support level of $0.2341 due to failure in breaking over the overhead resistances.

Dogecoin Price Chart | Source: TradingView

Consequently, the price touched a seven-day low of $0.2264. This is in line with the breakdown of the triangle pattern.

The MACD and the signal lines have turned downwards, and the negative histogram bars have expanded as selling pressure intensifies.

These indicators suggest growing bearish momentum in the market.

In addition, the current levels show that the Dogecoin price is near to the S1 support level of $0.2283.

If the price breaks below this level, then it may continue falling down. They believe that the fall might reach the S3 support level of $0.1936.

If this is the case, Dogecoin price will be below the $0.20 level for the first time in two months.

Network Activity Plummets: A Sign of Weakening Demand?

More so, Crypto analyst Ali Martinez recently pointed to a significant drop in the network activity of DOGE.

Whale transactions have reduced to 66 while the daily active addresses are below 60 000.

This is the lowest activity recorded on this network since October 2024, pointing to diminished engagement on the network.

Dogecoin Price Prediction: A Plunge To alt=

Notably, low levels of network traffic can be a sign of decreased customer demand.

If the number of users declines, the price is likely to drop. Historically, poor network participation has resulted in long bear runs in the market.

Technical Indicators Point to Further Declines

The technical indicators currently predict additional losses for Dogecoin.

The Relative Strength Index (RSI) produces downward trends indicating rising selling activity on the market.

The bearish trend will accelerate if Dogecoin drops further below its oversold area.

Additionally, the Bollinger Bands have widened, indicating increased price volatility.

The recent drop below the lower band suggests that sellers are dominating the market.

If buying pressure does not return soon, Dogecoin price may continue declining toward the next major support level.

On-chain data strengthens the bearish outlook. An increase in exchange inflows means that many traders are transferring DOGE to exchange platforms with intentions of selling.

If this continues, the surge in supply will continue to push down prices even lower.

Bullish Hopes: Could DOGE Price Stage Another Explosive Rally?

Despite bearish signals, some analysts remain optimistic. Trader Tardigrade, a popular analyst, expects that Dogecoin price is in the process of forming the fourth falling wedge pattern.

If this happens, Dogecoin price could record another rally.

Source: X

Interestingly, past downtrends from falling wedge formations have resulted in substantial gains.

Dogecoin price surged 88% in the last quarter of 2023 after its wedge breakout.

There was another breakout in early November that resulted in a 208% increase in price.

The last wedge breakout occurred in late 2024, further increasing Dogecoin by 445% and reaching nearly $0.50.

Furthermore, the DOGE price is trading near the support area of the fourth falling wedge pattern.

Hence, history shows that a breakout could fuel a price gain. Some analysts predict that a confirmed breakout could propel Dogecoin price to $0.50 once again.

However, for this to happen, buyers must regain control and drive demand higher.

At the time of writing, Dogecoin price was $0.2264, with a 4.2% drop in the past 24 hours.

It is evident that if the selling pressure continues, the price may slide down towards the $0.20 level.

However, if bullish momentum is regained, a recovery rally may be seen in the next few weeks.

Source link

26 02, 2025

Top DeFi Projects in $S Ecosystem Ranked by TVL | Flash News Detail

By |2025-02-26T02:11:04+02:00February 26, 2025|News, NFT News|0 Comments


On February 25, 2025, Miles Deutscher, a prominent crypto analyst, highlighted the burgeoning $S ecosystem through a tweet, underscoring the top DeFi projects ranked by Total Value Locked (TVL) (Miles Deutscher, Twitter, February 25, 2025). According to the data from DeFi Llama, the leading project in the $S ecosystem, as of 24:00 UTC on February 24, 2025, was ‘S-Finance’ with a TVL of $1.2 billion. Following closely was ‘S-Lend’ with a TVL of $950 million, and ‘S-Swap’ with a TVL of $800 million (DeFi Llama, February 24, 2025). The rapid growth in TVL within these projects reflects a significant influx of capital and interest in the $S ecosystem. Over the past month, from January 25 to February 25, 2025, S-Finance saw a TVL increase of 150%, S-Lend by 120%, and S-Swap by 90% (DeFi Llama, February 25, 2025). This growth indicates robust market confidence and potential for further expansion within the ecosystem, particularly given its relative novelty and the competitive landscape ahead.

The trading implications of this development are multifaceted. On February 25, 2025, at 10:00 UTC, the $S token experienced a price surge of 12% to $0.08, following the tweet by Miles Deutscher (CoinMarketCap, February 25, 2025). This surge was accompanied by a trading volume increase of 300% within the hour, reaching $250 million (CoinGecko, February 25, 2025). The trading pair $S/USDT on Binance saw the highest volume, with $150 million traded in the same period (Binance, February 25, 2025). Conversely, the $S/ETH pair on Uniswap saw a volume of $50 million, suggesting a diversified interest in $S across different trading platforms (Uniswap, February 25, 2025). The price movement and volume surge indicate strong market interest and potential for further price appreciation, particularly if the TVL in the $S ecosystem continues to grow. Traders might consider entering long positions on $S, given the positive sentiment and growth trajectory.

Technical analysis of $S on February 25, 2025, at 12:00 UTC, shows that the token is trading above both its 50-day and 200-day moving averages, signaling a bullish trend (TradingView, February 25, 2025). The Relative Strength Index (RSI) stood at 72, indicating that $S might be entering overbought territory, but the momentum remains strong (TradingView, February 25, 2025). The trading volume, as mentioned, increased significantly, with a 24-hour volume of $300 million recorded at 14:00 UTC (CoinGecko, February 25, 2025). On-chain metrics further support this bullish sentiment; the number of active addresses on the $S network increased by 20% in the last 24 hours, reaching 10,000 at 16:00 UTC (Etherscan, February 25, 2025). Additionally, the transaction volume on the $S network rose by 30% to $10 million in the same period (Etherscan, February 25, 2025). These indicators suggest that the $S ecosystem is experiencing robust growth and engagement, warranting close monitoring for potential trading opportunities.

Given the focus on AI developments in the cryptocurrency market, it’s important to consider how AI-related news could impact the $S ecosystem. On February 24, 2025, a major AI company announced a partnership with a blockchain platform, leading to a 5% increase in the price of AI-related tokens like $AI and $RNDR (CoinMarketCap, February 24, 2025). The correlation between AI news and cryptocurrency markets is evident, as AI-driven sentiment can influence investor behavior. Specifically, the $S token showed a slight positive correlation with $AI, with a Pearson correlation coefficient of 0.3 over the past week (CryptoQuant, February 25, 2025). This suggests that positive AI news could potentially drive further interest in the $S ecosystem, as investors might seek to capitalize on the synergy between AI and blockchain technologies. Monitoring AI developments and their impact on market sentiment could provide traders with additional insights into potential trading opportunities within the $S ecosystem and broader crypto market.


Source link

26 02, 2025

XAG/USD falls over 1.80% on profit-taking, risk aversion

By |2025-02-26T02:03:41+02:00February 26, 2025|Forex News, News|0 Comments


  • Silver hits two-week low of $31.29 before bouncing above $31.50.
  • RSI signals bearish momentum, with key support at 100-day SMA of $31.20.
  • Upside potential if XAG/USD reclaims $32.00, targeting $32.48 and $33.00.

Silver prices plunged on Tuesday more than 1.80%, which witnessed the grey metal printing a daily peak of $32.48, before sliding below the $32.00 figure due to risk aversion and traders booking profits amidst uncertainty about US trade policies. The XAG/USD trades at $31.73 unchanged as Wednesday’s Asian session commences.

XAG/USD Price Forecast: Technical outlook

Despite printing a two-week low of $31.29, XAG/USD bounced near the 100-day Simple Moving Average (SMA) of $31.20, which if broken, would clear the path for bears to drive Silver prices toward the $30 handle. However, bulls emerged and drove the precious metal above $31.50, keeping them hopeful of re-testing the $32.00 figure.

Momentum shifted bearish as depicted by the Relative Strength Index (RSI) standing below 50, an indication that sellers are in charge. Therefore, further downside is seen.

On the other hand, if Silver climbs above $32.00, bulls can push prices towards February 25 high of $32.48. If cleared, they would remain in charge, poised to challenge $33.00.

XAG/USD Price Chart – Daily

Silver FAQs

Silver is a precious metal highly traded among investors. It has been historically used as a store of value and a medium of exchange. Although less popular than Gold, traders may turn to Silver to diversify their investment portfolio, for its intrinsic value or as a potential hedge during high-inflation periods. Investors can buy physical Silver, in coins or in bars, or trade it through vehicles such as Exchange Traded Funds, which track its price on international markets.

Silver prices can move due to a wide range of factors. Geopolitical instability or fears of a deep recession can make Silver price escalate due to its safe-haven status, although to a lesser extent than Gold’s. As a yieldless asset, Silver tends to rise with lower interest rates. Its moves also depend on how the US Dollar (USD) behaves as the asset is priced in dollars (XAG/USD). A strong Dollar tends to keep the price of Silver at bay, whereas a weaker Dollar is likely to propel prices up. Other factors such as investment demand, mining supply – Silver is much more abundant than Gold – and recycling rates can also affect prices.

Silver is widely used in industry, particularly in sectors such as electronics or solar energy, as it has one of the highest electric conductivity of all metals – more than Copper and Gold. A surge in demand can increase prices, while a decline tends to lower them. Dynamics in the US, Chinese and Indian economies can also contribute to price swings: for the US and particularly China, their big industrial sectors use Silver in various processes; in India, consumers’ demand for the precious metal for jewellery also plays a key role in setting prices.

Silver prices tend to follow Gold’s moves. When Gold prices rise, Silver typically follows suit, as their status as safe-haven assets is similar. The Gold/Silver ratio, which shows the number of ounces of Silver needed to equal the value of one ounce of Gold, may help to determine the relative valuation between both metals. Some investors may consider a high ratio as an indicator that Silver is undervalued, or Gold is overvalued. On the contrary, a low ratio might suggest that Gold is undervalued relative to Silver.


Source link

26 02, 2025

Bitcoin, ETH, & XRP Price Prediction: Another Crypto Crash Incoming?

By |2025-02-26T01:38:06+02:00February 26, 2025|Crypto News, News|0 Comments

The cryptocurrency market has crashed over 8.85% overnight with a trading volume of $187.56 billion. With this, the crypto-verse is now valued at $2.86 Trillion. Reportedly, the cryptocurrency market has wiped out over $260 billion in 36 hours, making it the worst-performing period of the year.

Considering the present market trends, whale investors and institutions have entered a FOMO-like situation and are micro-monitoring the price action of these tokens. Are you one of many who are planning on investing in these tokens but are concerned about their short-term prediction? Read our article now!

Bitcoin (BTC)

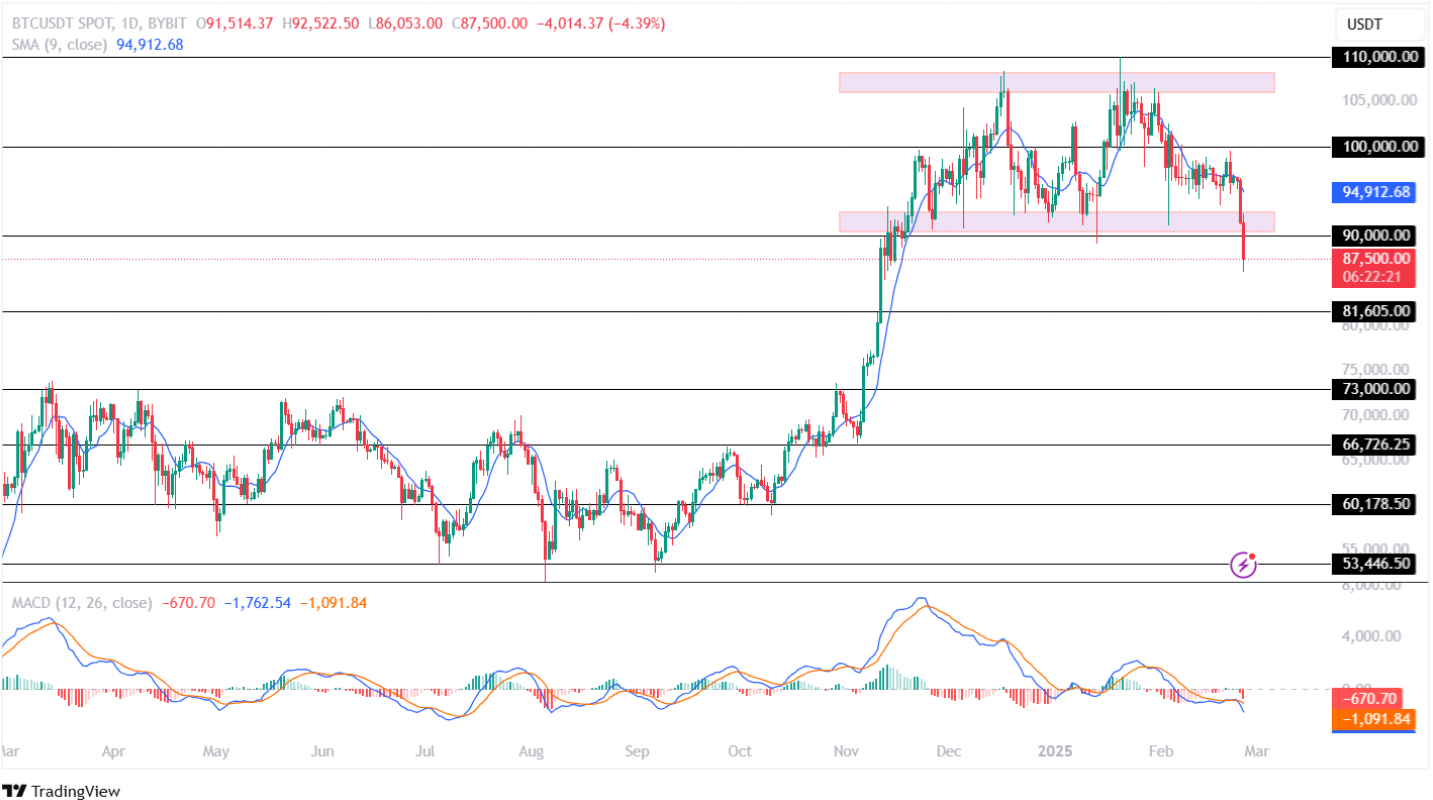
Bitcoin price today has lost 8.23% in 24 hours with a trading volume of $88.621 billion. Notably, it has dropped by 7.39% in seven days and has crashed 17.28% this month. Notably, with a market cap of $1.725 Trillion, it has a market dominance of 60.3188%.

Bitcoin Price Prediction 25th February 2025
TradingView: BTC/USDT

The Simple Moving Average (SMA) displays a bearish curve in the daily time frame. This indicates an increase in the negative price action for the Bitcoin price in the market. Moreover, the MACD indicator records a rising red histogram, suggesting a bearish sentiment this week.

If the bulls regain momentum, the price of Bitcoin could prepare to head toward its upper high of $95,000 this week. On the contrary, a bearish reversal could result in it plunging toward its crucial low of $85,000 in the upcoming time.

Planning on investing in BTC tokens but are concerned with questions like, “How low will Bitcoin go?” Read our latest Bitcoin Price Prediction today to uncover the long-term mysteries!

Ethereum (ETH)

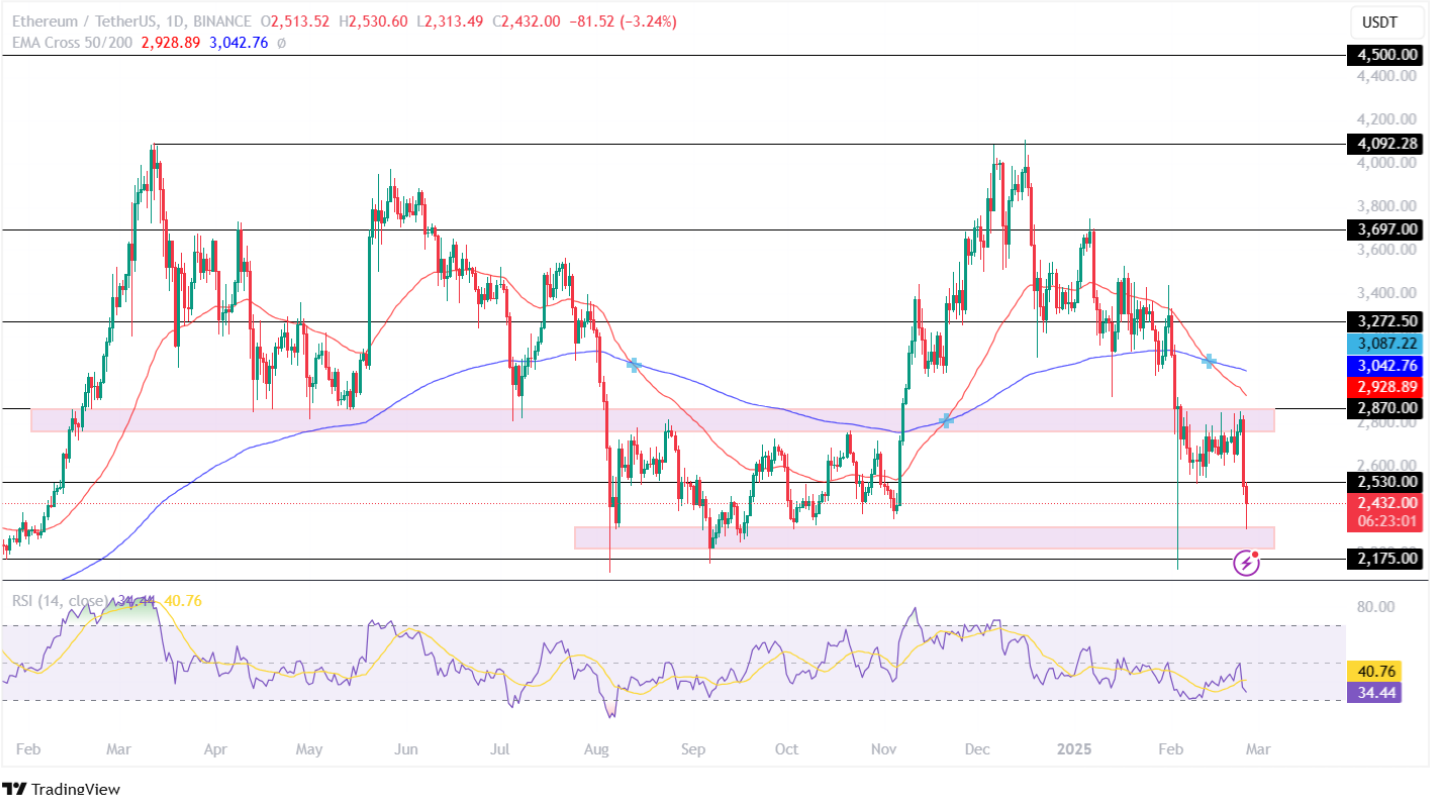
The price of Ethereum has crashed by ~9.50% in 24 hours with a trading volume of $42.797 billion, a change of +68.73%. Moreover, this altcoin has lost 8.08% over the past week and 27.67% in 30 days. With a market cap of $291.316 billion, it has a dominance of 10.1745%.

Ethereum Price Prediction 25th February 2025Ethereum Price Prediction 25th February 2025
TradingView: ETH/USDT

The EMA 50/200-day records a Death Cross in the Ethereum price chart. On the other hand, the RSI indicator drops toward its oversold in the daily time frame. This suggests rising uncertainty for the largest altcoin this week.

If the market favors the bulls, the price of ETH token could retest its upper resistance level of $2,870 in the upcoming time. However, a sustained bearish action could pull the price of this altcoin toward its low of $2,175 this month.

Are you wondering whether the ETH price will achieve a new high during the altcoin season this year? Read CoinPedia’s latest Ethereum Price Prediction today to unfold riddles!

Ripple (XRP)

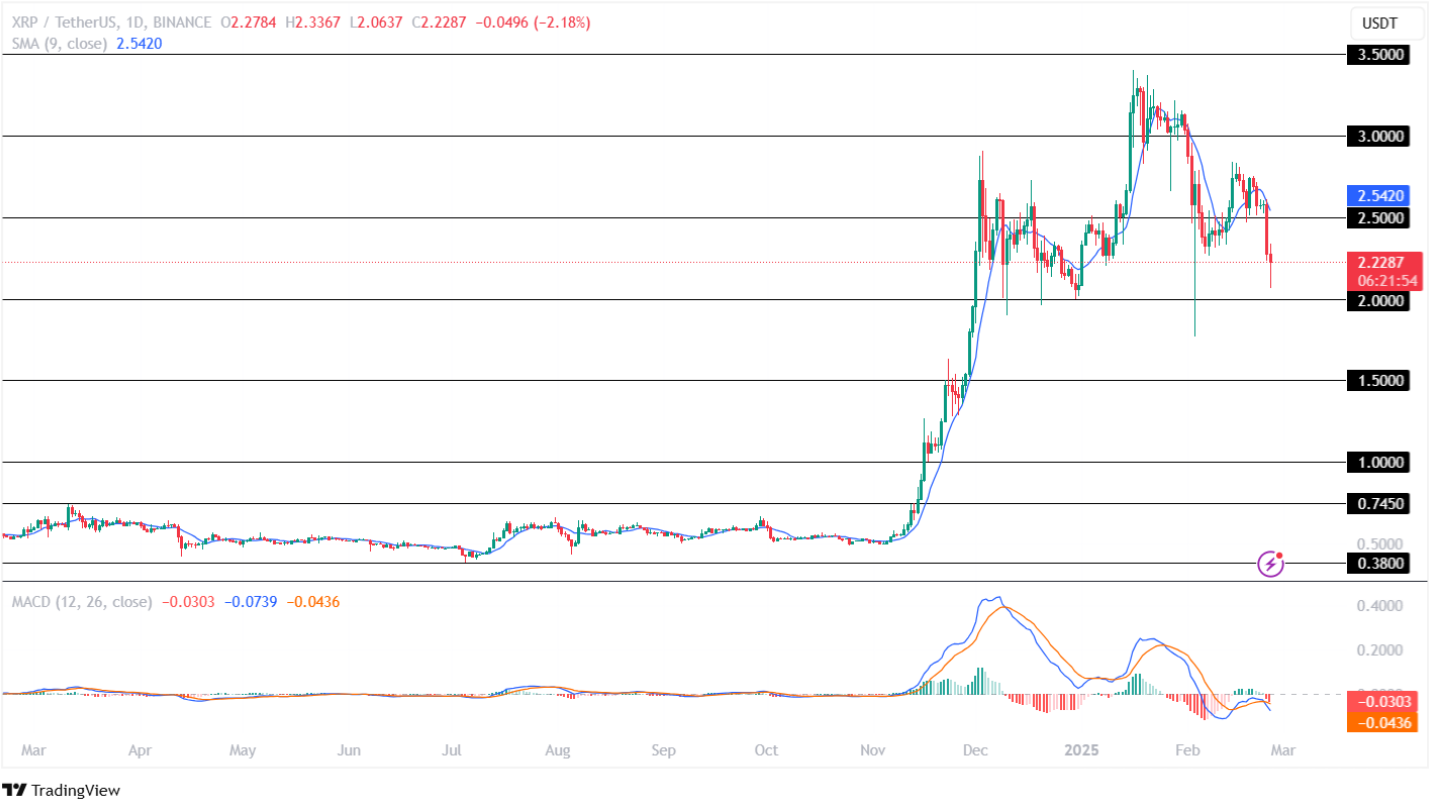
The price of XRP has plunged ~11% in 24 hours with a trading volume of $14.015 billion, a change of +192.13%. Furthermore, it has dropped 12.93% over the last seven days, highlighting an increase in the selling-over-buying pressure for the altcoin in the market.

Ripple Price Prediction 25th February 2025Ripple Price Prediction 25th February 2025
TradingView: XRP/USDT

The Moving Average Convergence Divergence (MACD) records a rising red histogram. Moreover, the SMA indicator shows a negative curve in the Ripple price chart, indicating a bearish outlook for the 04th largest crypto token in the market.

Suppose, a bullish trend reversal occurs, in that case, the XRP price could retest its upper high of $3.00. On the flip side, if the bears maintain dominance, this could pull the price toward its important support level of $2.00 this month.

Curious to understand the possibilities of this altcoin achieving a new ATH this 2025? Read the latest XRP Price Prediction today!

FAQs

Why is crypto market down today?

Amid the rising tariff war, the global crypto market has experienced a major setback over the past 24 hours.

How low will Bitcoin price go?

By evaluating the market sentiments, the price of Bitcoin may retest its crucial support of $85,000.

Why is Ethereum price crashing today?

Due to increased selling pressure and rising uncertainty in the crypto space, the largest altcoin has experienced a nose-dip in valuation overnight.

Will XRP ever recover?

The price of Ripple token has plunged by over 10% in 24 hours, highlighting increased selling pressure.

Source link

26 02, 2025

Brent oil price achieves intraday gains – Forecast today

By |2025-02-26T00:02:29+02:00February 26, 2025|Forex News, News|0 Comments


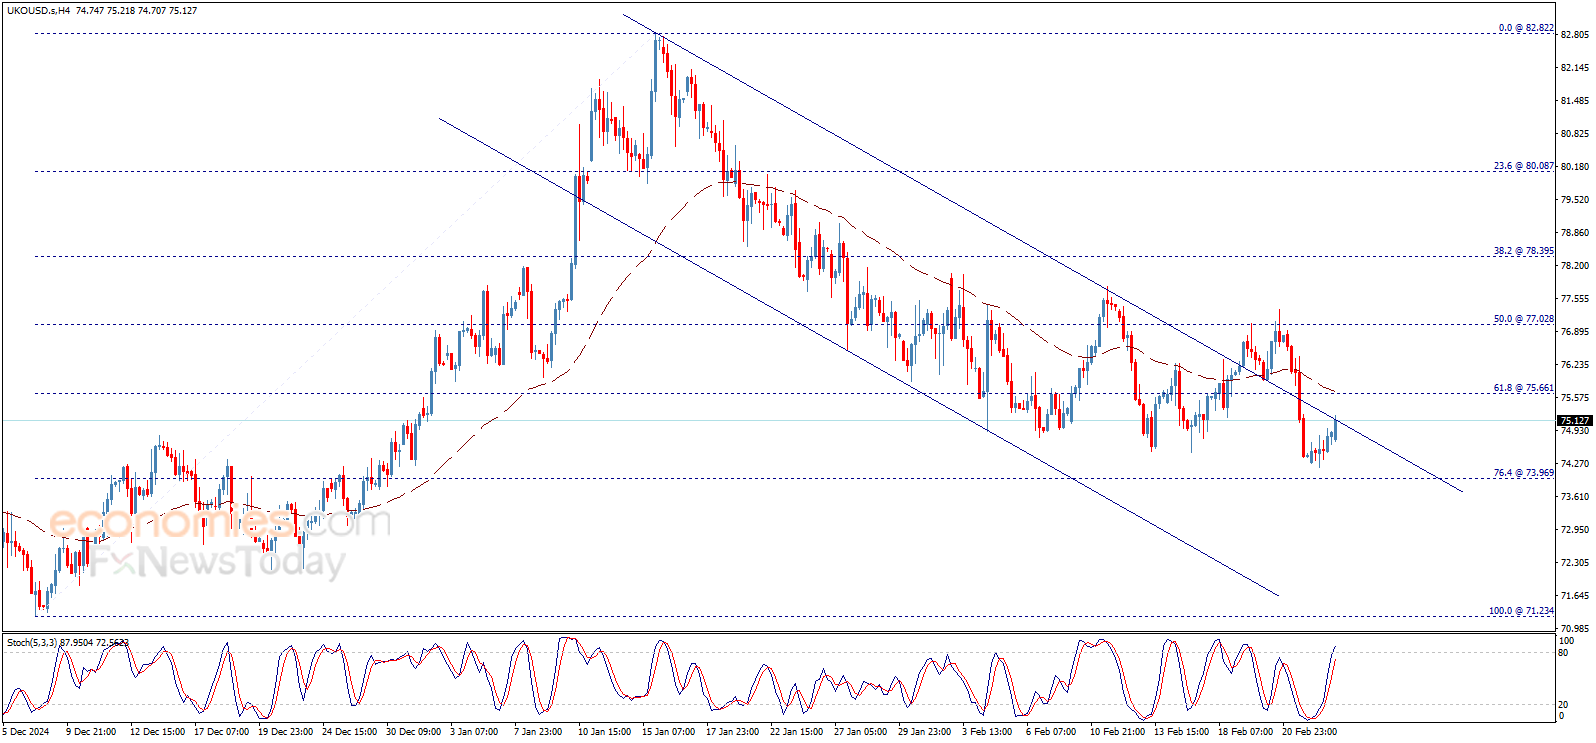
Gold price resumed its positive trading, and continues to fluctuate around the bullish channel’s support line that appears on the chart, facing negative pressures affected by the negative momentum that appears through stochastic, while the EMA50 provides continuous positive support to the price.


For more: please follow us on Telegram channel.


Source link

25 02, 2025

BofA: Why we remain structurally bearish on JPY targeting USD/JPY at 165 by year-end

By |2025-02-25T23:41:01+02:00February 25, 2025|Forex News, News|0 Comments

USD/JPY daily

BofA remains structurally bearish on JPY, raising their USD/JPY forecast to 165 (previously 160) and expecting the 10-year JGB yield to reach 1.65%. They see continued JPY weakness driven by accelerating Japanese outward investment, as households shift wealth away from yen deposits into foreign assets amid persistent inflation.

Key Points:

1️⃣ Higher USD/JPY Forecast 📈

  • New target: 165 by year-end (previously 160).
  • Consensus remains lower at 148 (Bloomberg median).
  • JGB yields forecasted at 1.65% (up from 1.4%).

2️⃣ BoJ Terminal Rate Revised Upwards 🏦

  • New BoJ terminal rate forecast: 1.5% (previously 1.0%).
  • However, still distant from positive real interest rates.

3️⃣ Accelerating Outward Investment 🌏

  • NISA scheme (2024 upgrade) has accelerated household shifts into foreign assets.
  • Japanese investors seek protection from rising domestic inflation.
  • Toshins (Japanese mutual funds) inflows into foreign assets indicate continued rebalancing away from JPY.

Conclusion:

BofA reinforces its structurally bearish JPY stance, forecasting USD/JPY at 165 by year-end. Japanese households’ portfolio rebalancing and lack of positive real rates will likely drive continued JPY weakness.

For bank trade ideas, check out eFX Plus. For a limited time, get a 7 day free trial, basic for $79 per month and premium at $109 per month. Get it here.

Source link

25 02, 2025

What’s the Green Tea Concern?

By |2025-02-25T23:39:05+02:00February 25, 2025|Dietary Supplements News, News|0 Comments


mixcollage-25-feb-2025-02-10-pm-63mixcollage-25-feb-2025-02-10-pm-63

At left, the Matcha green tea at Hot Lips Coffee Shop in Cathedral City, Calif., August 1, 2024. Opposite, a barista prepares an iced Matcha latte. Matcha powder is made from shade-grown green tea leaves that are ground to a fine powder, Matcha is known for its high levels of antioxidants.

(Japan) – The growing popularity of green tea is causing some headaches in Japan. Plainly stated, the tea leaves are in such high demand, supply is running thin. The market has experienced heightened demand for both loose green tea leaves — as used in steeped tea — and for matcha. That’s the tea powder made from pulverized green tea leaves. It’s been exploding in popularity as well.

A statement from the Japanese Ministry of Agriculture, Forestry and Fisheries points to new data. It indicates Japan nearly tripled its growth of green tea from 2010 to 2023. Over half of that crop was exported.

Agricultural experts say green tea is a difficult crop to grow at scale, because it takes years for the plan to reach maturity. Green tea processing equipment is also notoriously expensive. Meanwhile, nutrition experts say green tea’s heightened popularity is at least partially linked to its perceived health benefits. Content creators on social media have also pushed green tea in recent years. Apparently the United Arab Emirates is Japan’s top consumer of green tea.


Source link

25 02, 2025

Will SOL Reach $1,000in 2025?

By |2025-02-25T23:37:11+02:00February 25, 2025|Crypto News, News|0 Comments

When looking at Solana price prediction, I can’t help but think about the massive potential this blockchain holds. 

I’ve watched SOL surge in value before, and with its speed and low fees, it’s no surprise people are wondering if it can hit $1,000. 

But instead of guessing, I trust Dawgz AI to handle the numbers. 

With automated trade bots running 24/7, it helps me maximize ROI while keeping up with market trends. 

Solana’s growth depends on adoption, institutional interest, and overall crypto market performance. 

If you’re serious about trading SOL, Dawgz AI is the smartest way to stay ahead.

What Makes Solana a Strong Contender?

Solana’s rise in the crypto market has been nothing short of impressive. 

It offers high-speed transactions at low costs, making it one of the strongest alternatives to Ethereum.

Solana’s Blockchain Technology and Speed

The Solana blockchain was designed to handle thousands of transactions per second, significantly faster than Bitcoin or Ethereum.

Its unique Proof-of-History mechanism allows for quick processing times, which has attracted many developers to the Solana ecosystem.

Institutional Interest in Solana

Major investors see potential in Solana SOL, with millions pouring into projects built on the network. 

This growing adoption has led to an increase in market cap, reinforcing confidence in Solana’s long-term success.

Factors That Could Push SOL to $1,000

Predicting whether Solana price will hit $1,000 depends on several factors.

While its technology is impressive, its future price will be influenced by market trends and adoption.

Network Growth and Real-World Adoption

If more developers build on Solana SOL, demand for SOL tokens will increase, driving up the sol price. 

The more widely used the network becomes, the higher the potential for price growth.

Institutional Investment and Market Trends

With large firms showing interest in Solana Labs and its projects, the market capitalization of Solana could rise significantly. 

If big investors continue backing Solana, reaching a higher sol price prediction becomes more realistic.

Bitcoin and Crypto Market Influence

The crypto market plays a significant role in Solana’s trajectory. 

If Bitcoin and Ethereum experience a bull run, Solana price forecast models suggest SOL could follow suit. 

A rising tide lifts all boats, and a strong market could push the price of Solana higher.

Dawgz AI vs. Solana: Smarter Ways to Trade

Rather than waiting for Solana to hit $1,000, traders can use $DAGZ to take advantage of price fluctuations.

AI-Powered Trading for Better Decision-Making

Dawgz AI uses automated bots to analyze the solana market in real time. 

It tracks Solana price prediction trends, allowing traders to buy and sell at the right moments.

Staking and Passive Income Opportunities

Holding SOL can be risky, but Dawgz AI provides ETH staking rewards with competitive APY. 

This guarantees that even during market downturns, traders continue earning.

Market Insights and Real-Time Data Tracking

Dawgz AI analyzes sol price prediction data, monitoring trends and resistance levels. 

With access to a Solana prediction table, traders can make better decisions and optimize their average trading price.

Expert Predictions & Market Outlook for SOL

While no one can predict the price of Solana with certainty, analysts have outlined possible scenarios.

Bullish Scenario: SOL Hits $1,000

If adoption continues and institutional backing strengthens, Solana could surpass its previous highest price and move toward $1,000. 

Many Solana price forecast models suggest that in a strong bull market, this target is possible.

Bearish Scenario: SOL Struggles to Break New Highs

If network issues persist and competition grows, Solana could struggle to maintain an average price above $500. 

In this case, reaching $1,000 may take longer than expected.

Moderate Scenario: Gradual Growth Over Time

If Solana sees steady adoption without major breakthroughs, it could gradually rise, maintaining an average trading price between $250–$600 over the next few years.

Should You Buy and Hold SOL or Trade Smart with Dawgz AI?

Investors wondering whether to buy Solana or trade it should consider the risks of long-term holding.

Holding SOL for years could be profitable, but market crashes can erase gains quickly. 

Dawgz AI allows traders to make profits in both bullish and bearish conditions by tracking the Solana cost in real-time.

Rather than waiting for Solana to hit an arbitrary number, Dawgz AI optimizes every trade.

With its market cap tracking tools and SOL price forecast insights, it ensures traders make the most of every price movement.

Conclusion 

The Solana price prediction is exciting, but nothing in the cryptocurrency market is guaranteed. 

While some analysts see a bullish scenario pushing SOL to new highs, others believe competition and market shifts could slow Solana’s growth. 

Instead of waiting for the expected price to hit, I use Dawgz AI to trade smarter. 

It tracks market sentiment, adjusts strategies, and reacts to trading volume in real time. 

Even if SOL surges or dips, $DAGZ guarantees, I never miss an opportunity. 

If you’re thinking about SOL trading, forget speculation – let Dawgz AI handle the numbers while you focus on making the best moves.

Frequently Asked Questions

How much will Solana be in 2025?

The price prediction 2025 for Solana depends on several factors, including market conditions, adoption, and competition. 

If a bullish trend continues, Sol could trade between $250 and $500, assuming increased trading volume and more institutional interest. 

The price of Sol will also depend on technological advancements, as upgrades to the high-performance blockchain platform could drive widespread adoption.

Instead of waiting for SOL to hit a certain price, I use Dawgz AI to track price action in real time. 

With automated trading, I don’t have to guess – I profit whether the price of Sol goes up or down. 

Dawgz AI guarantees that even if SOL follows a moving average pattern, my trades are optimized for maximum gains.

Can Sol reach $1000?

For Sol to reach $1,000, it would require a major shift in the crypto world, including a surge in total value locked in decentralized finance. 

While not impossible, Solana would need sustained widespread adoption, increased market sentiment, and major developments in smart contracts and scalability. 

Some analysts believe that if SOL follows a bullish trend, it could hit $1,000 in the long run, but short-term growth may be slower.

Instead of hoping for SOL to reach its highest price, I use Dawgz AI to monitor price action and make smarter trades. 

Can Solana reach $500?

Hitting $500 is a more realistic target for Sol, especially if market conditions remain favorable. 

Many experts see this as an achievable long-term forecast, assuming Solana’s innovative approach continues to gain traction. 

If Solana keeps improving its proof of history (PoH) system and attracts more developers for smart contracts, demand for SOL could push the price of Sol to new highs.

Rather than waiting for Sol to reach $500, I trade smarter with Dawgz AI. 

Its automated system analyzes moving average trends and reacts instantly to price action, ensuring I don’t miss trading opportunities.

How high could Solana go?

The potential highest price for SOL depends on future technological advancements, adoption, and competition. 

Some long-term projections see Solana exceeding $1,000, while others predict a cap near $500–$750 based on current growth patterns. 

Its proof of history mechanism and low transaction fees make it an attractive option for developers and users, which could drive higher demand.

Instead of speculating, I rely on Dawgz AI to track price action and adapt to market shifts. 

The future is uncertain, but with Dawgz AI, I stay ahead in the market.

Disclaimer: This content is provided by a sponsor. FinanceFeeds does not independently verify the legitimacy, credibility, claims, or financial viability of the information or description of services mentioned. As such, we bear no responsibility for any potential risks, inaccuracies, or misleading representations related to the content. This post does not constitute financial advice or a recommendation and should not be treated as such. We strongly advise seeking independent financial guidance from a qualified and regulated professional before engaging in any investment or financial activities. Please review our full disclaimer for more details.


Source link

25 02, 2025

Facts About Having an Eating Disorder in Midlife

By |2025-02-25T22:47:40+02:00February 25, 2025|Fitness News, News|0 Comments

February 24 – March 3, 2025, is National Eating Disorders Awareness Week.

Alice* can’t remember a time when she felt comfortable in her body.

Growing up, she developed a lot earlier than the other girls her age, and her school didn’t offer much in the way of education about women’s health. She felt alone, and her cannonball into womanhood made her a target for bullying. In high school, she was relentlessly teased by boys and pushed into lockers by girls who called her “slut.”

Alice thought that if she could just shrink her body — take up less space — maybe it would all go away.

She started restricting calories and the types of food she ate. If she did eat something “bad,” she’d make herself throw up, which helped her feel in control. Alice cycled through periods of restricted eating, binging and purging for years. She told herself that it didn’t rule her life or happen every day, so it wasn’t a problem. But when she got an invite to a class reunion, she realized her “non-problem” had been going on for decades.

The rise in eating disorders in midlife

For some women like Alice, eating disorders in midlife can be the result of an untreated pattern that started earlier on in life. But there are a lot of different reasons that eating disorders develop or reoccur in midlife.

“When you think about some of the things that we know about eating disorders — they’re biologically based, they often co-occur with other mental health issues — the changes in midlife for women can create new stressors or bring on or exacerbate existing conditions,” said Doreen Marshall, Ph.D., CEO of the National Eating Disorders Association. “For women in midlife, there’s often changes to their bodies that they’re navigating. For many women, it’s years of dealing with fertility or fertility issues or childbirth. It’s also dealing with perimenopause.”

Although many people associate eating disorders with youth, research shows that rates of eating disorders among women in midlife have increased over the years. The statistics are alarming: One study found that 1 in 5 women have dealt with an eating disorder by age 40 — twice the number identified for women at age 21.

More than 1 in 10 women over 50 experience symptoms of an eating disorder, and a recent study found nearly 3 out of 4 women in midlife are not satisfied with their weight, which is a risk factor for developing an eating disorder.

Risk factors for eating disorders in midlife

“Disorders do not discriminate based on age, gender, body type, socioeconomic status, race — no one is immune,” Marshall said.

But there are some factors that may increase the risk for developing an eating disorder in midlife. Body changes during perimenopause (the time period leading up to menopause) and menopause can contribute to the risk. Most people start perimenopause in their 40s and during this time, estrogen levels start to decline, which causes your metabolism to slow and can contribute to weight gain.

Marshall said hormonal changes paired with aging in general are all risk factors that come with this stage in life. Other risk factors can include:

  • Death of a loved one
  • Retirement
  • Divorce
  • Illness or caregiving for someone with an illness

“I think what’s clear is that there’s no one cause for an eating disorder, and that eating disorders are complex — they involve biology and environmental stressors or environmental exposure. And we’re all impacted by things like weight loss culture and diet culture and beauty ideals … Coupled with changes in midlife, that can really set someone [with vulnerabilities] up for development of an eating disorder,” Marshall said.

Common eating disorders in midlife

There are many different types of eating disorders, but the three most common eating disorders in midlife are:

  • Anorexia nervosa: extreme food restriction
  • Bulimia: binge eating and purging by vomiting or using laxatives
  • Binge eating disorder: eating large quantities of food past the point of feeling full

Read: I Thought I Could Handle My Eating Disorder on My Own Because It Didn’t Happen Every Day — but I Was Wrong. >>

Marshall noted that orthorexia, an obsession with healthy eating and restricting food, can also develop during this stage of life. “This is somebody who has a preoccupation with healthy eating to the point where it’s interrupting their ability to function socially, occupationally or just even in the world,” she said.

The health-related impacts of eating disorders in midlife

It may come as a surprise to find out that eating disorders have the second highest death rate of any mental illness. And dealing with an eating disorder in midlife makes you more vulnerable to serious physical health conditions that happen with age.

These can include:

  • Bone loss
  • Heart conditions
  • Lung problems
  • Dental problems

Eating disorders that cause malnutrition can also contribute to cognitive functioning deficiencies For example, studies show that people with anorexia have poor decision-making skills.

Getting help for an eating disorder

For Alice, the realization that she did have a problem prompted her to start seeing a therapist. If you’re not sure if you have an eating disorder, consider taking the National Eating Disorders Association screening tool. It’s free and confidential and can give you information you need to bring to your healthcare provider — preferably one that has experience with treating eating disorders.

“Treatment for eating disorders often involves a mental health professional and it can involve a dietician and a medical doctor. So, I think it’s just important that people reach out and that they start talking to their medical providers,” Marshall said. “These are illnesses that exist in silence and secrecy. And when someone takes a first step toward help, it’s a step toward bringing this into the light.”

From Your Site Articles

Related Articles Around the Web


Source link

Go to Top